Table of Contents |
A hypothesis test for population proportions is a hypothesis test where we compare to see if the sample proportion of "successes" differs significantly from a hypothesized value that we believe is the population proportion of "successes." The type of data that is collected for a population proportion is qualitative data.
When calculating a z-test for population proportions, you need the following information:

IN CONTEXT
Approximately 10% of the population is left-handed, with a standard deviation of 3.13%. Of 100 randomly selected people, 14 claimed to be left-handed.
Find the z-test statistic for this data set.
This type of data is qualitative data; people are answering either yes or no. They're either left-handed or not left-handed. We're placing the answers into categories, which is why it's also called categorical data.
Since we know the population standard deviation, we can use the formula for population proportions to find the z-score. We have p-hat, which is the proportion of successes from our sample. In this case, a success is being left-handed, which is 14 out of 100, or 14%, or 0.14. Now, p is the population number proportion of successes, which is 10%, or 0.10. Then, we have q, which is the complement to p. This tells us that for people who are right-handed, there would be 90%, or 0.90. Our sample size was 100.
Let's go ahead and calculate the z-score.

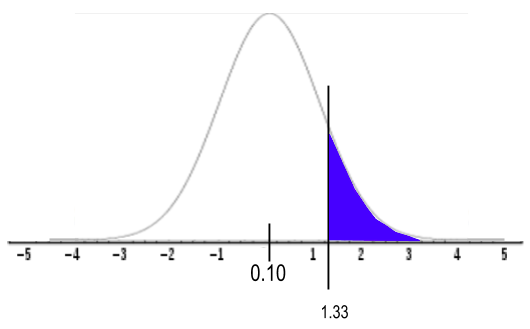
We've got our 14% minus the population proportion of 10%. We're going to divide by the standard error, so the square root of 0.10 times 0.90 all over our sample size of 100. We end up getting a z-test statistic of 1.33.
We can use a normal distribution because we know the population standard deviation. This distribution is centered at 10%. Our sample rendered 14% of people being left-handed, which was 1.33 standard deviations above the mean.
When running a hypothesis test for population proportions, the same four parts apply every time:
EXAMPLE
Let's look at a situation that would require proportions.
| Criteria | Description |
|---|---|
| Randomness |
How was the data collected? The randomness should be stated somewhere in the problem. Think about the way the data was collected. |
| Independence |
Population ≥ 10n Make sure that the population is at least 10 times the size of the sample because you're sampling without replacement. |
| Normality |
np ≥ 10 and nq ≥ 10 Because you're using the sampling distribution of p-hat instead of x-bar, there are different conditions for normality. Use the conditions np is at least 10 and nq is at least 10. We can't use the central limit theorem here because this is not the sampling distribution of x-bar. It's the sampling distribution of p-hat, sample proportions. |


Source: THIS TUTORIAL WAS AUTHORED BY JONATHAN OSTERS FOR SOPHIA LEARNING. PLEASE SEE OUR TERMS OF USE.
