Table of Contents |
In order to write the inequalities that make up this system, we need to look at each individual piece of the graph and construct an inequality.
EXAMPLE
Write the system of inequalities from the graph below: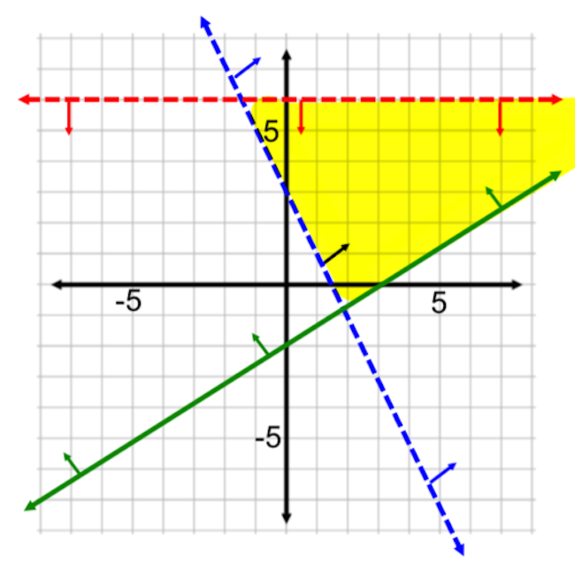
 , and simply replace the equals sign with our inequality symbol. To write the equation in the form , we need to find the slope and the y-intercept.
 , or 2. The equation of the boundary line is
  . Now replace the equal sign with our inequality sign > and we have determined one inequality in the system:

 . This creates the equation
  . Our boundary line is a solid line, narrowing our inequality symbol to either ≤ or ≥. Since the solution region to the system includes all points above this line, we know the inequality symbol is ≥. Replace the equal sign with our inequality sign ≥ and we have determined another inequality in the system:

 . To turn this into an inequality, we note the dashed line, which indicates that it will either be the symbol < or >. Since the solution region is underneath the line, we will use the <, or the "less than" symbol. Replace the equal sign with our inequality sign < and we have determined the third inequality in the system:


We can create a system of linear inequalities to express real-world situations.
EXAMPLE
You manage an art store and need to order canvas paper and brushes for the studio. You must buy at least 200 sets of paint brushes, which cost $15 each, but no more than 75 rolls of canvas paper, which cost $30 each. Your budget for this expense is $5,000.


Source: THIS TUTORIAL HAS BEEN ADAPTED FROM "BEGINNING AND INTERMEDIATE ALGEBRA" BY TYLER WALLACE. ACCESS FOR FREE AT www.wallace.ccfaculty.org/book/book.html. License: Creative Commons Attribution 3.0 Unported License