Table of Contents |
Examining unemployment can help us better understand poverty in the United States. When people lose their jobs during a recession or in a changing job market, it can take longer to find a new one, if they can find one at all. When people who have been unemployed for a long period of time do find a job, it is often at a much lower wage or not full time. This can force people into poverty.
The unemployment rate is how the U.S. government tracks the relative portion of the population that is experiencing unemployment at any given time. But the unemployment rate is not the percentage of the total adult population without jobs. Rather, it is the percentage of adults who are in the labor force—adults who are of working age and who are trying to find work—but who do not have jobs. It is an incomplete picture.
The unemployment rate does not include:
Some unemployment is due to the principle of supply and demand: there are too many chefs, and not enough kitchens for them to run, so only some of those chefs get to have a job (or get to have a job in their chosen field). But some unemployment is due to what is called structural unemployment, which describes long-lasting unemployment that is a result of shifts to the economy and the job market.
EXAMPLE
When grocery stores began implementing self-checkout, this decreased the number of jobs available for grocery cashiers. Former grocery cashiers were then facing structural unemployment.There can also be geographic reasons for structural unemployment, as when a major employer relocates from a town that had depended on it, or when jobs are plentiful in one region but most of the unemployed people live too far away to work there.
Let’s look at how unemployment rates have changed over time and how various groups of people are affected by unemployment differently.
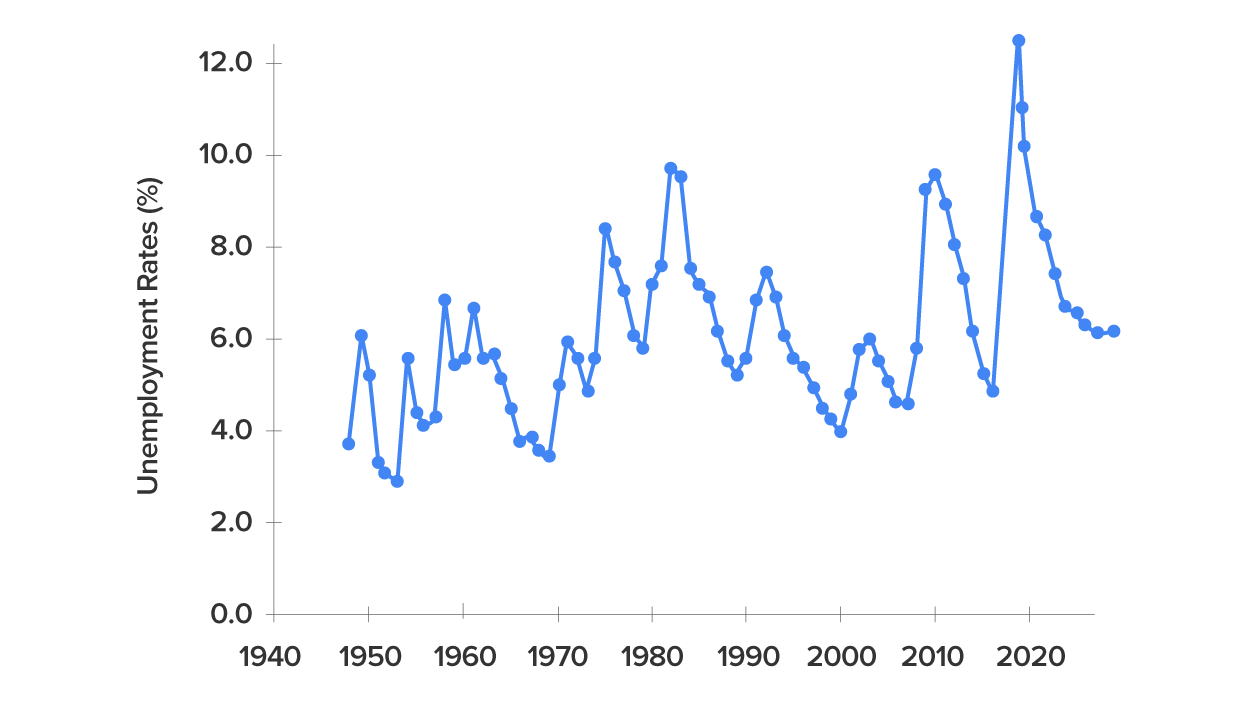
This chart shows the historical pattern of U.S. unemployment since 1948. While it clearly fluctuates over time, the unemployment rate seems to return to a range of 4% to 6%. There does not seem to be a long-term trend toward the rate moving generally higher or generally lower.
As we look at this data, several patterns stand out:
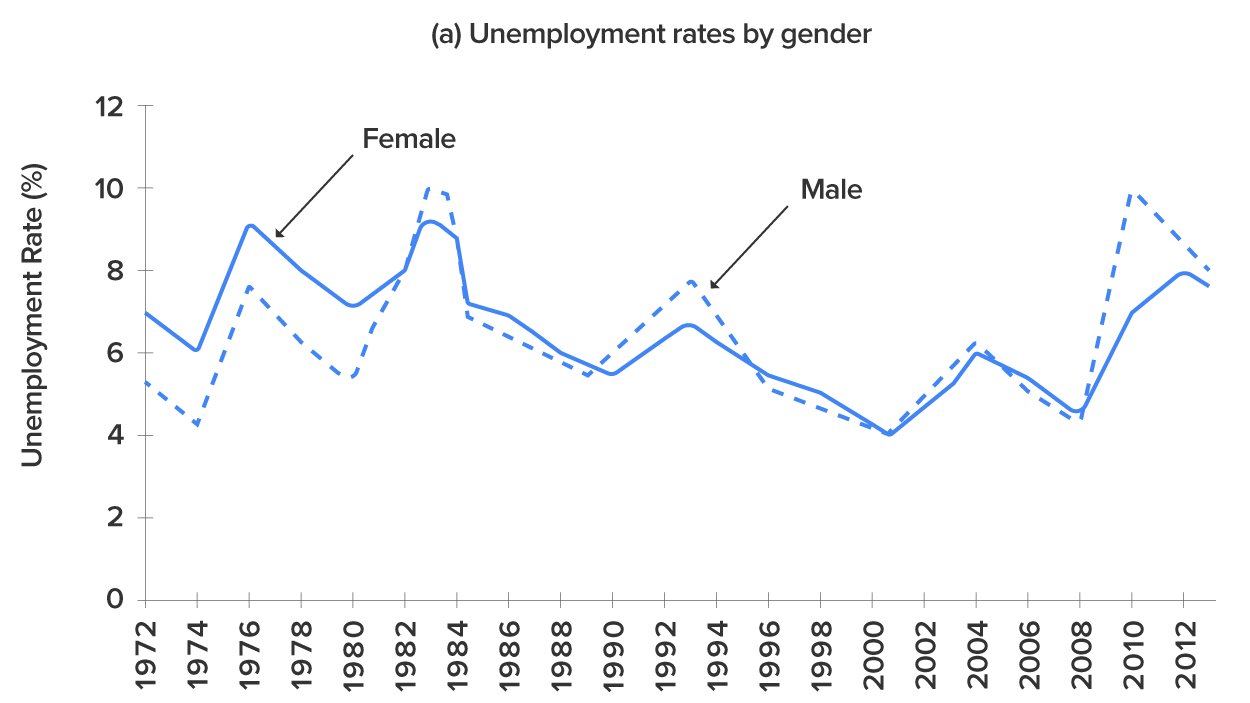
Unemployment is not distributed evenly across the U.S. population. These charts show unemployment rates broken down in various ways: by gender, age, and race/ethnicity.
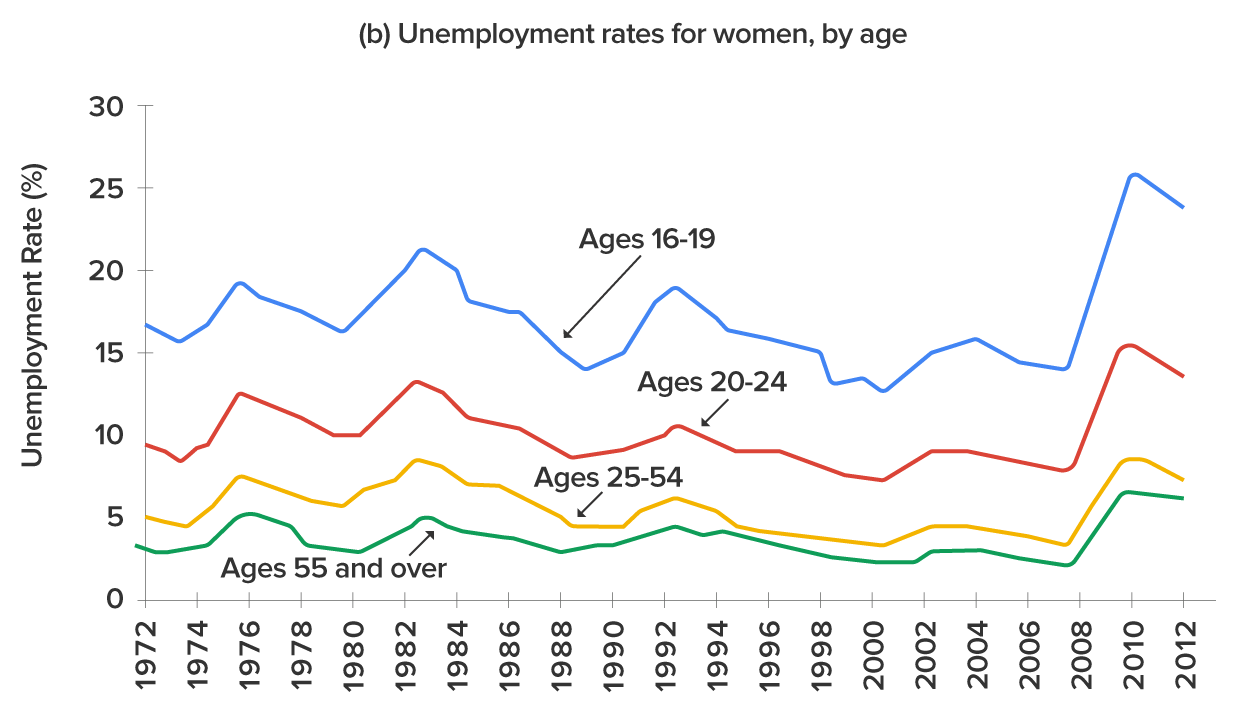
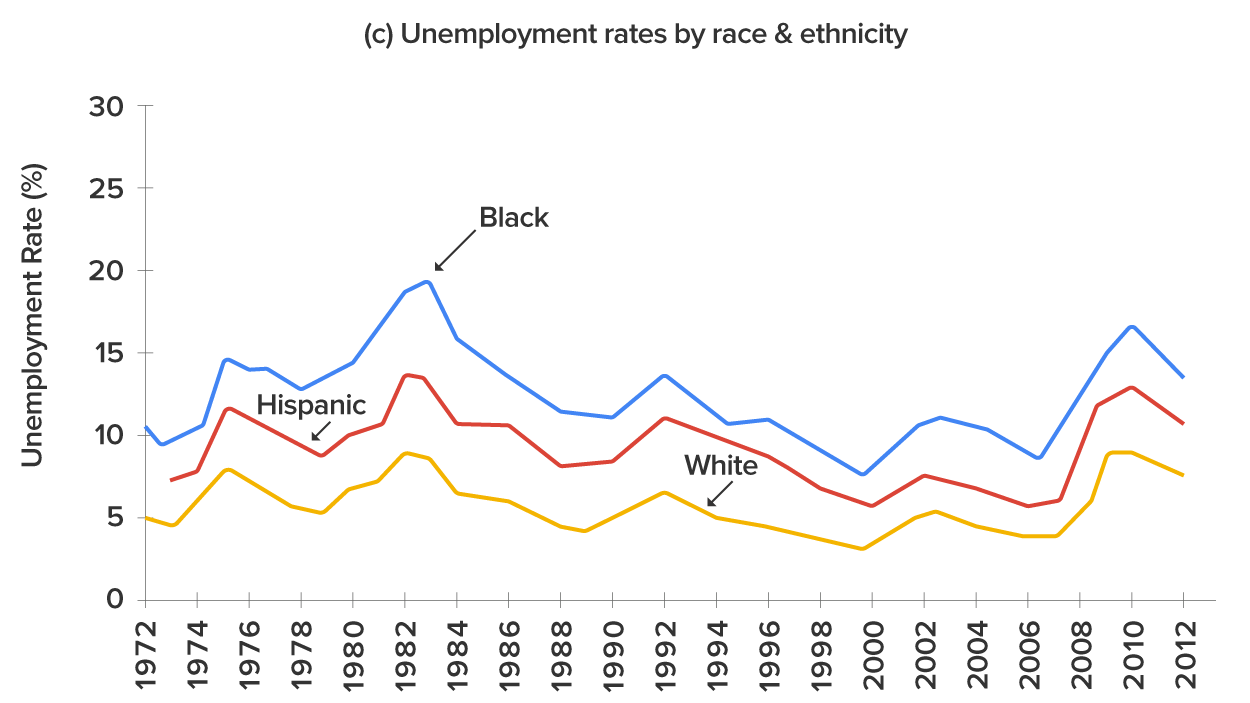
These line graphs show how unemployment rates since 1972 have changed for various demographics. Unemployment rates for people over the age of 55 have remained lower than unemployment rates for people ages 16–54. While unemployment rates for all ethnicities tend to rise and fall around the same time, it is notable that the unemployment rate for white people has always been lower than that of Black and Hispanic people.
The unemployment rate for women had historically tended to be higher than the unemployment rate for men, perhaps reflecting the historical pattern that women were seen as “secondary” earners. By about 1980, however, the unemployment rate for women was essentially the same as that for men. During the recession of 2008–2009, however, the unemployment rate climbed higher for men than for women. But in the pandemic spike in unemployment, the unemployment rate was higher for women than for men.
Younger workers tend to have higher unemployment, while middle-aged workers tend to have lower unemployment. Younger workers move in and out of jobs (and in and out of the labor force) more easily. Elderly workers have extremely low rates of unemployment, because those who do not have jobs often exit the labor force by retiring, and thus are not counted in the unemployment statistics.
The unemployment rate for African Americans is substantially higher than the rate for other racial or ethnic groups, a fact that surely reflects, to some extent, a pattern of discrimination that has constrained labor market opportunities for this group. However, the gaps between unemployment rates for white, Black and Hispanic people diminished in the 1990s. In fact, unemployment rates for Black and Hispanic people were at the lowest levels for several decades in the mid-2000s before rising during the Great Recession of 2008.
Finally, those with less education typically suffer higher unemployment.
EXAMPLE
In early 2013, the unemployment rate for those with a college degree was 3.7%; for those with some college but not a four-year degree, the unemployment rate was 6.0%; for high school graduates with no additional degree, the unemployment rate was 7.6%; and for those without a high school diploma, the unemployment rate was 10.3%.This pattern may arise because additional education offers better connections to the labor market and higher demand, or it may occur because the labor market opportunities for low-skilled workers are less attractive than the opportunities for the more highly-skilled.
The myth of the American Dream is based on the idea that there is plentiful opportunity for success, which is available to all who work hard enough. While the reality has always been more complex than the myth might lead us to believe, few recent events have done more to shatter the myth of the American Dream than the worldwide recession that began in 2008. In the first year of the recession alone, more than 2.6 million American jobs were lost, and the unemployment rate peaked above ten percent.
The Great Recession of 2008 was brought on, at least in part, by the lending practices of banks in the early twenty-first century. During this time, banks provided adjustable-rate mortgages (ARM) to customers with poor credit histories at an attractively low introductory rate (often after convincing the buyer that the property’s value would quickly increase to such a degree that the unrealistic debt would become realistic). After the introductory rate expired, the interest rate on these ARM loans rose, often dramatically, creating a sizable increase in the borrower’s monthly mortgage payments. As their rates adjusted upward, many of these “subprime” mortgage customers were unable to make their monthly payments and stopped making payments, which is known as defaulting. The widespread implosion of these mortgages, which had themselves been used to secure other forms of risky borrowing and speculation, put a strain on the financial institutions that had made the loans, and this stress rippled throughout the entire global economy.
Median income dropped during the recession for all income levels, but the upper-class fared best in its aftermath. By 2016, the median income level for the upper-income tier was 2.4 times that of the middle-class level and 7.3 times that of someone in the lower-income level.
The United States fell into a period of high and prolonged unemployment, extreme reductions in wealth (except at the very top), stagnant wages, and loss of value in personal property (houses and land). The S&P 500 Index, which measures the overall share value of selected leading companies whose shares are traded on the stock market, fell from a high of 1565 in October 2007 to 676 by March 2009. But by 2019, the United States had recovered from the 2008 recession and was experiencing the longest economic expansion in history, with much lower unemployment rates. Of course, this recovery was interrupted by the COVID-19 pandemic in 2020 and 2021, which brought a new spike in unemployment and poverty.
While these and several other factors indicated that the pre-pandemic United States was on the road to recovery, many people were still struggling. The size, income, and wealth of the middle class have been declining since the 1970s—effects that were hastened by the recession. Overall, the number of adults in the middle class fell by ten percent between 1971 and 2011. While the income levels of middle-income Americans remained more stable over this same time period, only higher-income houses saw significant financial gains, furthering the income disparity between the lower, middle, and upper-class.
Today, wealth is distributed inequitably at the top, making the United States more unequal than it has been in many decades. In 2010, the top 1% of households (the upper class) owned 35.4% of all privately held wealth, and the next 19% (the managerial, professional, and small business stratum) had 53.5%, which means that just 20% of the people owned a remarkable 89%, leaving only 11% of the wealth for the bottom 80% (wage and salary workers).
IN CONTEXT
You might be familiar with the phrase “we are the 99%.” This slogan was made popular by the Occupy movement of 2011, in which people protested economic inequality through widespread encampments that lasted for months. The purpose of these encampments was to draw attention to the concentration of American wealth in the hands of the top 1% of households. “We are the 99%” was a rallying cry intended to encourage regular people to identify with one another across class to fight inequality and corporate greed.
During the time the Occupy movement was active, many questioned whether it was effective. From the perspective of a decade later, it is clear that Occupy was hugely influential in bringing language about the 99% and the 1% into mainstream discourse, as well as in the popular support among millennials and other young people for the presidential campaigns of Senator Bernie Sanders. The encampments also provided valuable training in organizing and political action for thousands who participated, including Representative Alexandria Ocasio-Cortez.
The economic downturn had a ripple effect throughout the economy. For instance, it delivered a significant blow to the once-vibrant U.S. automotive industry. While consumers found loans harder to get due to the subprime mortgage lending crisis and increasing fuel costs, they also grew weary of large, gas-guzzling sport utility vehicles (SUVs) that were once the bread-and-butter product of U.S. automakers. As customers became more aware of the environmental impact of such cars and the cost of fuel, the large SUV ceased to be the status symbol it had been during the 1990s and 2000s. It became instead a symbol of excess and waste.
All these factors created the perfect storm that nearly decimated the U.S. auto industry. To prevent mass job loss, the government provided emergency loans funded by taxpayer dollars, as well as other forms of financial support, to corporations like General Motors and Chrysler. (General Motors, once the world’s largest corporation, declared bankruptcy in 2009.) While the companies eventually recovered, the landscape of the U.S. auto industry was changed as result of the economic decline.
IN CONTEXT
Millennials, or Americans born between 1982 and 2000, now number 83.1 million and represent more than one quarter of the nation’s population. As a generation, they have been uniquely impacted by the recession in ways that will ripple throughout their entire working lives.
When the recession hit, the oldest millennials were recently out of high school and college, or soon to graduate. Those who were in their first adult jobs were disproportionately impacted by layoffs, since they had the least seniority. Those who tried to find their first or second jobs at this time were suddenly competing against older and more experienced workers for entry-level jobs. Many millennials at the start of their working lives experienced prolonged unemployment and underemployment. Others had to change fields or move back home with their parents in order to get by. Younger millennials who were still in school during the recession saw what was happening to their older peers, and shifted their courses of study to reflect the job market they could expect to find after graduation. This shaky start to their working years will impact millennials throughout their working lifetime.
Millennials today are marrying at lower rates than previous generations, and self-reports suggest that a lack of economic security—including low wages, poverty, and unstable housing—are all associated with lower marriage rates among young adults. According to Pew Research (2017) more millennial households are in poverty than households headed by any other generation. In 2016, of the approximate 17 million U.S. household living in poverty, 5.3 million were headed by a millennial.
The mix of jobs available in the United States began changing many years before the 2008 recession, and, as mentioned above, the American Dream has not always been easy to achieve. Geography, race, gender, and other factors have complicated the pathway to success. More recently, the increased outsourcing—or contracting a job or set of jobs to an outside source—of manufacturing jobs to developing nations has greatly diminished the number of high-paying, often unionized, blue-collar positions available.
A similar problem has arisen in the white-collar sector, with many low-level clerical and support positions also being outsourced, as evidenced by the international technical-support call centers in Mumbai, India, and Newfoundland, Canada. The number of supervisory and managerial positions has been reduced as companies streamline their command structures and industries continue to consolidate through mergers. Even highly educated skilled workers such as computer programmers have seen their jobs vanish overseas.
The automation of the workplace, which replaces workers with technology, is another cause of changes in the job market. Computers can be programmed to do many routine tasks faster and less expensively than the people who used to do such tasks. Jobs like bookkeeping, clerical work, and repetitive tasks on production assembly lines all lend themselves to automation.
EXAMPLE
Envision your local supermarket’s self-scan checkout aisles. The automated product scanners, card readers, and change dispensers can largely take the place of paid employees. Now one cashier can oversee transactions at six or more self-scan aisles, which was a job that used to require one cashier per aisle.While the job market on the whole is again growing, it is doing so in a polarized fashion. Polarization means that a gap has developed in the job market, with most employment opportunities at the lowest and highest levels and few jobs for those with midlevel skills and education. At one end, there has been strong demand for low-skilled, low-paying jobs in industries like food service and retail. On the other end, some research shows that in certain fields there has been a steadily increasing demand for highly skilled and educated professionals, technologists, and managers. These high-skilled positions also tend to be highly paid.
The fact that some positions are highly paid while others are not is a characteristic of the class system. Theoretically, at least, the class system as it is organized in the United States is an example of a meritocracy, an economic system that rewards merit—typically in the form of skill and hard work—with upward mobility. A theorist working in the functionalist perspective might point out that this system is designed to reward hard work, which encourages people to strive for excellence in pursuit of reward, while a theorist working in the conflict perspective might counter that hard work does not guarantee success even in a meritocracy, because social capital—the accumulation of a network of social relationships and knowledge that will provide a platform from which to achieve financial success—is often required to access the high-paying jobs. Increasingly, we are realizing intelligence and hard work aren’t enough. If a person lacks access, connections, and certain forms of knowledge, they are unlikely to experience upward mobility.
A minimum wage is set by the government as the lowest earning rate that can be legally offered by an employer within the jurisdiction. The federal minimum wage is the lowest wage that can legally be paid in the United States for most jobs (although incarcerated and disabled workers can be paid less, as well as tipped workers such as waitstaff), but some states and cities have a higher minimum wage. For the last several decades, the federal minimum wage has grown at a rate lower than inflation, which means that a person earning minimum wage in 1990 was making more money, in terms of spending power, than a person earning minimum wage in 2020.
Each state’s minimum wage must be at least equal to the federal minimum wage, but it can be higher. As of 2021, the federal minimum wage was $7.25, but in Washington, DC with the highest minimum wage in the country, workers earn a minimum of $15 per hour. The highest state minimum wage is $14/hr in California, but twenty states don't require any wages higher than the federal minimum.
Although the federal minimum wage seems like it should be the lowest wage anyone in the United States can be paid, there are exceptions to the rule. Tipped workers, such as restaurant waitstaff, can be paid much less; the tipped minimum wage is less than a third of the regular minimum wage. Incarcerated and disabled workers can also be paid less than minimum wage, with incarcerated workers routinely earning less than a dollar per hour.
The existence of cheap convict labor today helps to keep wages low. Manufacturers who only employ free people, and who thus have to pay minimum wage and face the possibility of workers unionizing for benefits and pay increases, struggle to compete with manufacturers that contract for incarcerated labor. Incarcerated workers make pennies on the dollar compared to free workers, and they cannot unionize or demand benefits. This hurts individual workers as well, because there is little incentive for an employer to pay more for free labor when they could contract incarcerated labor for even less. Every day Americans lose jobs when prisons put bids on government contracts.
IN CONTEXT
In 2001, Barbara Ehrenreich published Nickel and Dimed: On (Not) Getting By in America, in which she conducted an experiment by working a series of minimum wage jobs in three states and documenting her experiences. She focused especially on the challenges facing women among the working poor, who often hold the types of “service” jobs she herself sought out and analyzed.
A tenth-anniversary edition was published in 2011, and Ehrenreich followed up with many of the minimum wage workers she had met a decade before during her participant observation research. In this edition, she writes:
“In what has become a familiar pattern, the government defunds services that might help the poor while ramping up law enforcement. Shut down public housing, then make it a crime to be homeless. Generate no public-sector jobs, then penalize people for falling into debt. The experience of the poor, and especially poor people of color, comes to resemble that of a rat in a cage scrambling to avoid erratically administered electric shocks. And if you should try to escape this nightmare reality into a brief, drug-induced high, it’s ‘gotcha’ all over again, because that of course is illegal too.”
Ehrenreich’s book is a compelling example of public sociology, a branch of sociology that strives to bring sociological dialogue to public forums. The goals of public sociology are to increase understanding of the social factors that underlie social problems and to assist in finding solutions.
Sociologists may also consider the minimum wage issue from differing perspectives. How much of an impact would a minimum wage raise have for a single mother? Some might study the economic effects, such as her ability to pay bills and keep food on the table. Others might look at how reduced economic stress could improve family relationships. Some sociologists might research the impact on small business owners.
Opponents of raising the minimum wage argue that some workers would get larger paychecks while others would lose their jobs, and companies would be less likely to hire new workers because of the increased cost of paying them. Proponents of raising the minimum wage contend that some job loss would be greatly offset by the positive effects on the economy of low-wage workers having more income.
As of the writing of this lesson in 2021, the federal minimum wage has not been raised since 2009, when it was set to $7.25; if the minimum wage had been keeping pace with inflation, it would be $9.02 today. In 2012, fast food workers began the Fight For 15 campaign, an effort to raise the minimum wage to $15. In 2012, this number was considered enough to be a living wage, which is defined as the wages required for a worker to meet their basic needs, such as food, housing, and transportation, although these living costs vary by region. Through strikes, boycotts, protests, and public information campaigns, workers grew support for living wages. More than eight states have passed legislation gradually increasing the minimum wage to $15, and some expensive cities like San Francisco and New York City have done the same.
In the last few years, increasing the minimum wage to a living wage has become significantly more popular in national politics, with Bernie Sanders making a $15 minimum wage a major part of his 2016 presidential campaign. This shifted the effort into mainstream politics, and today President Biden supports a $15 minimum wage and attempted to include it in pandemic relief legislation. But the Senate did not pass the version of the bill that included a $15 minimum wage, so the effort continues. Of course, a living wage is a moving target thanks to inflation. The $15 proposed by activists in 2012 would have to be $17 today to have the same purchasing power.
Source: THIS TUTORIAL HAS BEEN ADAPTED FROM (1) "INTRODUCTION TO SOCIOLOGY" BY LUMEN LEARNING. ACCESS FOR FREE AT LUMEN LEARNING. (2) "INTRODUCTION TO SOCIOLOGY 2E" BY OPENSTAX. ACCESS FOR FREE AT OPENSTAX. LICENSE (1 & 2) CREATIVE COMMONS ATTRIBUTION 4.0 INTERNATIONAL.