Table of Contents |
Clean data is the foundation for reaching accurate and reliable insights from your data. The old saying, “garbage in, garbage out,” is particularly true as it applies to business data analytics. When we feed flawed or messy data into our analytical methods, the results are bound to be unreliable. It’s like trying to bake a cake with spoiled ingredients—the final product will not be appetizing!
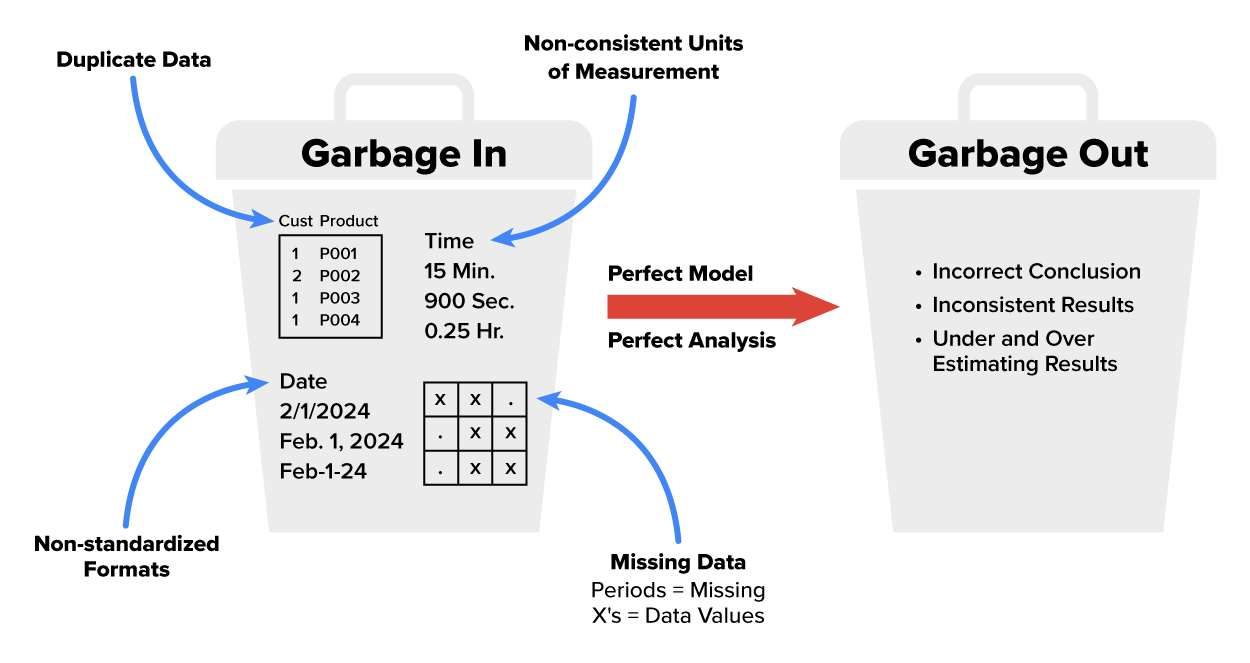
A business can hire highly trained and skilled analysts to carry out the proper analytical methods. A business can spend a lot of money and resources on analytical software, infrastructure, and technology to analyze and store the data. Yet, if the data has not been cleaned, the accuracy and reliability of the analytical results cannot be trusted.
Data cleaning is one task that analysts spend most of their time on. The 80/20 rule, also known as the Pareto principle, applies to most data analysts. The 80/20 rule states that a data analyst spends 80% of their time cleaning data and 20% of their time applying the data analytical methods to the data (Nduati, 2022). While this is a lot of time, and data cleaning is certainly not the most glamorous part of the job, the importance of data cleaning cannot be underestimated. It has been estimated that poor data quality costs businesses an average of $13 million dollars a year due to making decisions on poor quality data (Gartner, 2021). The next several sections will provide you with reasons why data needs to be cleaned to make reliable conclusions from the data.
Data cleaning plays a crucial role in enhancing the accuracy and consistency of data for decision-making.
Below are a few examples of how data cleaning affects data accuracy and consistency.
Missing data is a reality of almost any real-world data set and one of the major reasons why data needs to be cleaned. Missing data can occur for various reasons like measurement errors, system glitches, or non-responses.
A typical data set is shown in the figure below. Note the missing values scattered throughout.
There are several variables with missing values in the data shown above. If you applied an ANOVA, regression, or correlation analysis, any row with a missing value would be removed before the analysis was conducted. Even some machine learning models that you will also study later in this course treat missing values in the same manner. This concept of when these analyses remove the row for any variable that has a missing value is known as complete case-wise deletion.
Using this example, rows 2, 4, 5, 6, and 7 would be removed, leaving just three complete rows for the analysis as shown in the figure below.
You can end up losing a lot of data quickly if you do not handle missing values in some manner. You will explore appropriate methods to handle missing data later in this Challenge.
Let’s explore a concrete example of why data cleaning related to missing values is important from an accuracy perspective.
IN CONTEXT
Identifying Fraudulent Transactions
Suppose you are an analyst at Moneybags Bank. You have been tasked with building a predictive model to detect fraudulent customer transactions. The predictive model you have selected performs complete case-wise deletion. However, you’re excited to get started and overlook detecting if you have missing values before building your model.
The model you build uses historical data, so the transactions are labeled as fraudulent or not. The Fraudulent column in the data below is an indicator of whether the transaction is fraudulent or not (1 = transaction is fraudulent, 0 = transaction is not fraudulent). Many of the fraudulent transactions have missing values for some of the columns. A small sample of the data is shown below.
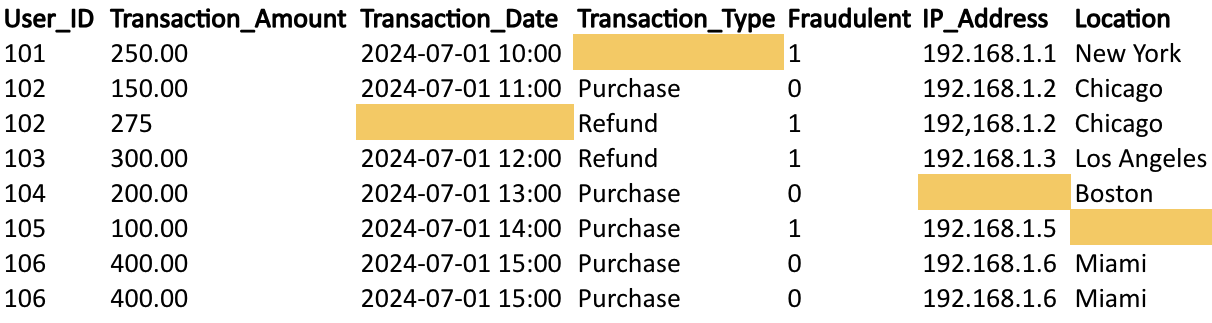
When you build your predictive model with this data, every column with missing data will be excluded or removed. The model will be built upon only the remaining data, which in this case means three-quarters of the fraudulent transactions have been excluded.
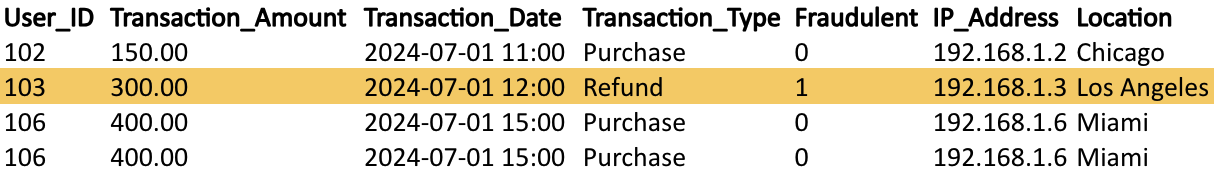
The remaining dataset includes only 25% of the original fraudulent transactions to base your model upon. By ignoring the missing data, you have inadvertently introduced bias into the model. The model learned to make decisions based on only the available data, but without a complete picture, the model will struggle to generalize accurately. In this case, the model’s classifications of fraudulent vs non-fraudulent predictions are skewed toward non-fraudulent transactions, while fraud cases remained hidden. Mishandling missing data can lead to inaccurate conclusions.
Instead of removing data with missing values, we need methods that allow us to include this data in our analysis. Soon, we will learn more about cleaning methods that allow us to include transactions with missing data.
In addition to accuracy, cleaning data provides the business with consistent data to work with. Consistent data ensures that information is uniform across different systems. It is common for businesses to have different systems for storing different types of data. Two common systems used to store data in businesses are Customer Relationship Management (CRM) and Enterprise Resource Planning (ERP) systems. CRM systems serve as a central hub for storing and managing centralized data. CRM systems store any information related to a customer interaction such as their names, addresses, purchase histories, and service interactions. An ERP system is used to store data related to the overall management of the business such as finance, inventory, supply chain, and any activities related to human resources (HR). ERPs are used for activities like order processing, invoicing, and payroll.
Inconsistent data leads to confusion and unreliable insights as illustrated by an example.
IN CONTEXT
Knowing One Gnome from Another
Imagine you work for Rainforest, a company that provides landscape materials for eco-friendly, sustainable gardens. The garden designers record the custom garden gnome models from inventory records from the ERP system, but the records do not match the ones recorded by the sales team in the CRM system.
For example, the two tables show how the data was collected for the company’s ERP and CRM systems.
ERP System Data Set:
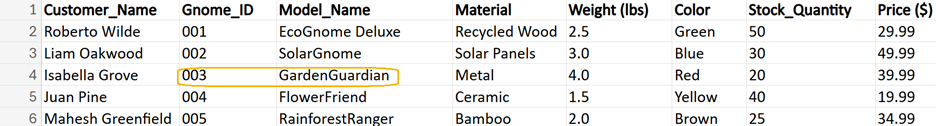
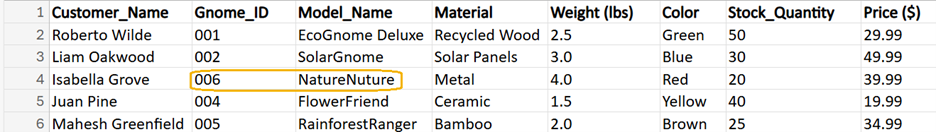
Isabella Grove, a longtime customer, wants to order the same gnome for a garden expansion at her business. When her data was collected by Rainforest's CRM system, the Model ID and Model Name from the inventory system were recorded incorrectly.
CRM System Data Set:
This inconsistency can lead to confusion when fulfilling orders and managing inventory. For instance, if a customer orders a specific garden gnome model based on inventory data, but the sales team processes a different model, it could result in incorrect installations and unhappy customers.
This inconsistent labeling of models across two data systems can also cause unreliable insights. For example, imagine the quarterly profit report that you generate. If there is a mismatch between the model numbers in the CRM and ERP systems, this would distort the profit figures and hinder decision-making.

Another reason to clean data related to consistency is data standardization. Data standardization refers to the process of transforming data into a consistent format or structure. It ensures uniformity across various data elements, making them easier to compare and analyze.
Below are some key aspects of data standardization.
EXAMPLE
A retail company that specializes in high-quality clothing and outdoor recreational equipment collects data from three different channels: online store, physical retail stores, and phone orders. Each channel records data differently—some use abbreviations, others spell out product names completely.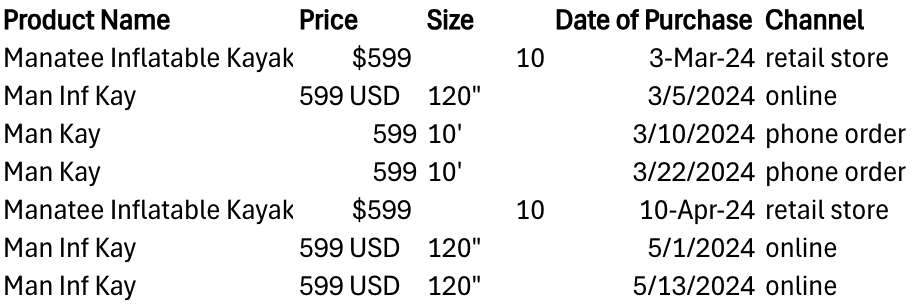
Data standardization enhances reliable analysis and correct business insights based on the data. Sometimes you might have to share your data across business units or groups. Standardizing data ensures that everyone interprets the data consistently. Standardizing data minimizes the effort required to clean and align data across business units.
In addition to ensuring accuracy, cleaning data at the beginning of the process can save significant time during the analysis phase. Let’s explore a few of the ways cleaning data can save an analyst time.
Source: THIS TUTORIAL WAS AUTHORED BY SOPHIA LEARNING. PLEASE SEE OUR TERMS OF USE.
REFERENCES