Use Sophia to knock out your gen-ed requirements quickly and affordably. Learn more
×

Visually Representing the Project Schedule

Author: Sophia

what's covered
This lesson will discuss how to visually represent a project schedule. Project managers who work with schedules every day sometimes don't realize how difficult it might be for others to understand the project schedule. That’s why there are several methods for representing the schedule in a simpler form:

Table of Contents

1. Gantt Chart

A Gantt chart is a chart used to display all the work, the resources assigned, and the dependencies in the schedule.

As you can see in the example below, the Gantt chart visually represents the schedule as boxes to show a logical flow through the project.

Two horizontal bar charts labeled ‘Gantt Chart’ and ‘High Level Version’, each with an overall project time of 22 hours. In the Gantt Chart, the first row has a bar labeled ‘Survey Customers’ with ‘Omar 5 hours’. The second row has a bar labeled ‘Design Modules’ with ‘Alma 5 hours’. The third row has a bar labeled ‘Design Form’ with ‘Russell 4 hours’. The fourth row has a bar labeled ‘Program Modules’ with ‘Ali 5 hours’. The fifth row has a bar labeled ‘Program Form’ followed by ‘Rhonda 4 hours’. The last row has a bar labeled ‘Test Form’ with ‘Kima 3 hours’. In the High Level Version, the first row has a bar labeled ‘Survey Customers’ with ‘5 hours’. The second row has a bar labeled ‘Design’ with ‘5 hours’. The third row has a bar labeled ‘Programming’ with ‘9 hours’. The last row has a bar labeled ‘Test Form’ with ‘3 hours’. The bars form a staircase pattern.

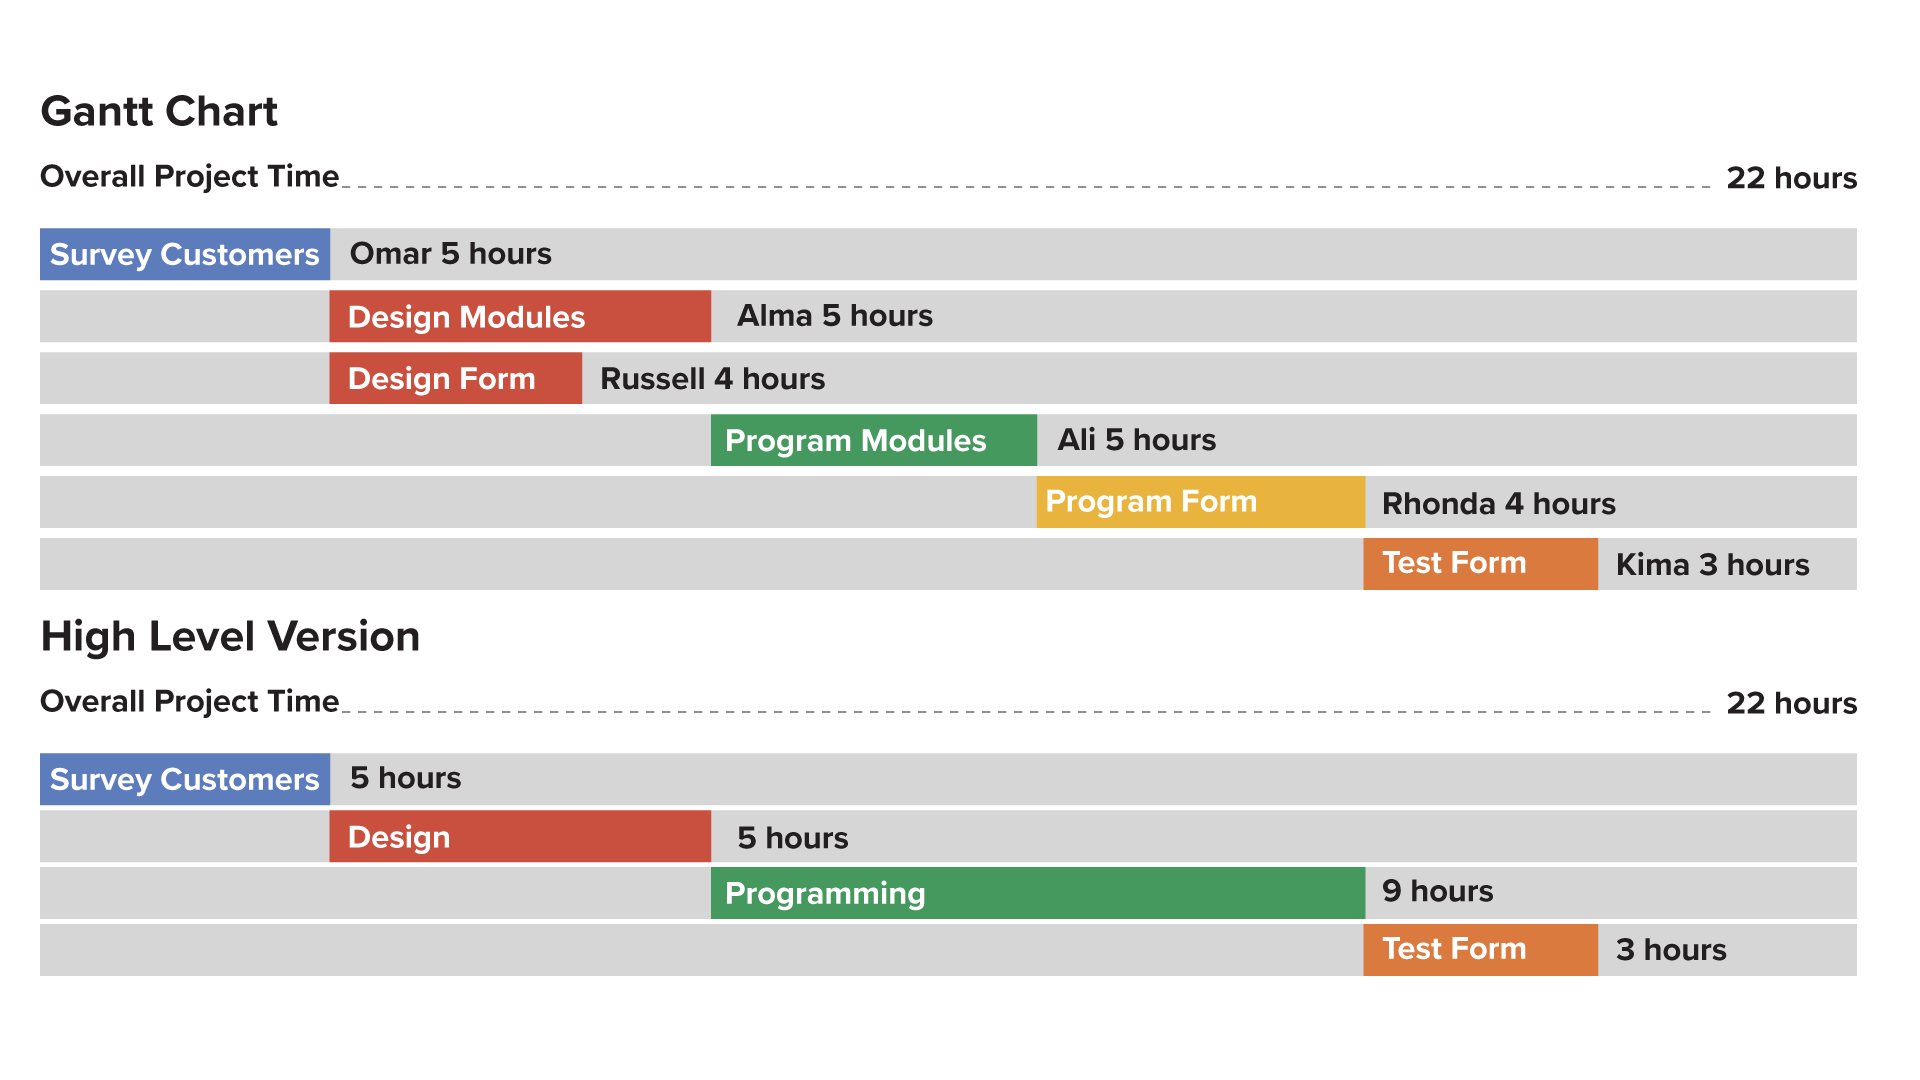
This chart makes it simple to see who's working on a task, how long that task will take, and what tasks must be completed before and after the current work.

Some project managers will use the Gantt chart to build the schedule and often continue to use it throughout the project.


2. Network Diagram

The network diagram shows the flow of work between tasks or project units, and each unit is represented as a node on a network.

A flowchart with a circle labeled ‘Start’ leading to two paths, connected by dashed arrows. The top path goes to a box labeled ‘TASK 1’, then horizontally to ‘TASK 3’. From here, an arrow points downward to ‘TASK 5’ and then to a circle on the far right labeled ‘End’. The bottom path goes to ‘TASK 2’, then horizontally to ‘TASK 4’. From here, an arrow points upward to ‘TASK 5’ and then to ‘End’. Another arrow points upward from ‘TASK 2’ to ‘TASK 3’.

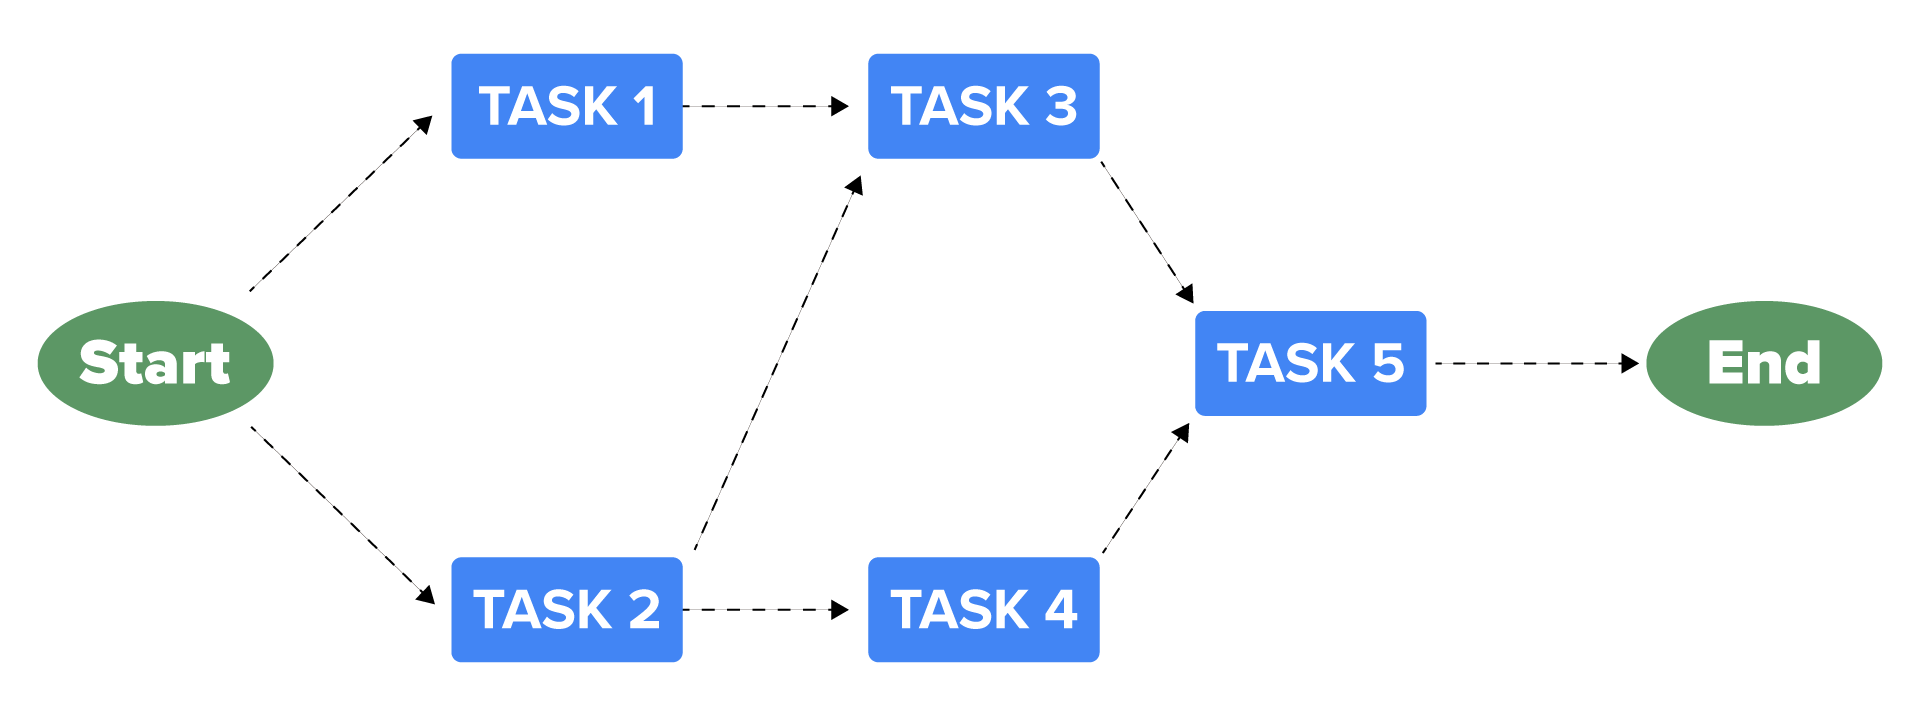
The start and end of the project are represented as circles, tasks are shown as boxes, and arrows show the dependencies between the tasks. Note how Task 3 cannot begin until Task 1 and Task 2 are both complete.

A network diagram should be used when there are multiple dependencies between tasks that might be too complicated for a Gantt chart to display.

term to know
Network Diagram
A display of the logical relationships and sequence of project activities.


3. Critical Path

A critical path will run through both a Gantt chart and a network diagram and is the longest string of continuous dependent tasks.

This path represents the shortest amount of time in which a project can be completed; project managers identify critical paths because attempts to shorten the schedule need to occur by modifying tasks along this path.

A network diagram showing six circles labeled ‘10’, ‘20’, ‘30’, ‘40’, and ‘50’, connected by dashed arrows with time labels.

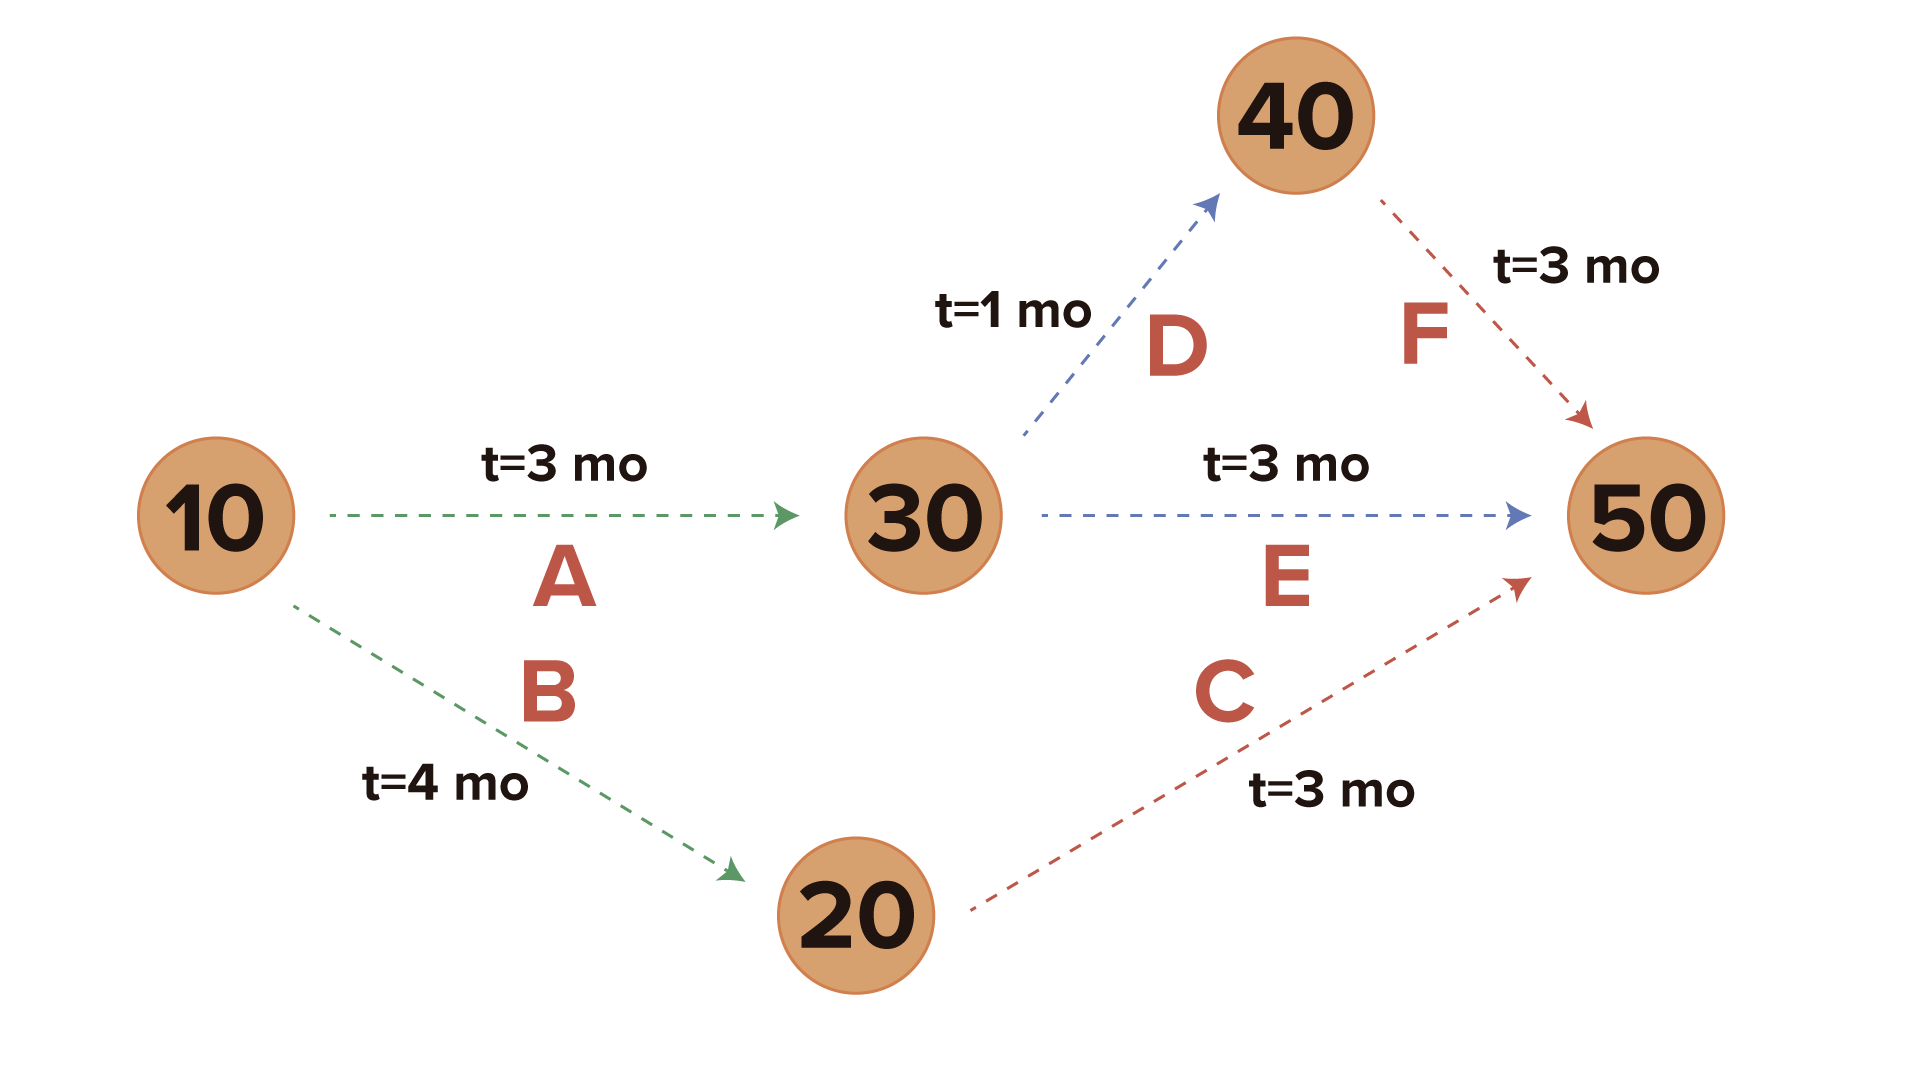
In the image above, you can see that the project has two critical paths: Activities B and C, and Activities A, D, and F. Both paths show a minimum project time of seven months.

  • Critical path with B and C : B + C = 4 months + 3 months = 7 months
  • Critical path with A, D, and F : A + D + F = 3 months + 1 month + 3 months = 7 months
Since the critical path is based on dependencies and duration, it gives the project manager the clearest picture of the key project work, which is the work that must be tracked closely and managed well to successfully complete the project deliverables.

It is important to note that any delay in the tasks on the critical path will cause the schedule to increase in length. Think about the most recent project you worked on. With this project in mind, choose one of the three methods you just learned, and try to create a visual project schedule.

summary
In this lesson, you learned three ways to visually represent a project schedule. A Gantt Chart shows who is working on a task, how long that task will take, and what tasks must be completed before and after the current work. A Network Diagram shows the flow of work between tasks or project units, and each unit is represented as a node on a network. A Critical Path shows the longest string of continuous dependent tasks.

Source: This work is adapted from Sophia author Jeff Carroll.

Terms to Know
Network Diagram

A display of the logical relationships and sequence of project activities.