Table of Contents |
Vector graphics are a type of digital image created using mathematical equations to define shapes such as points, lines, curves, and polygons. Unlike raster graphics, which are composed of a fixed grid of pixels, vector graphics are resolution independent. This means they can be scaled to any size without losing quality, making them ideal for designs that need to be resized frequently, such as logos and icons.
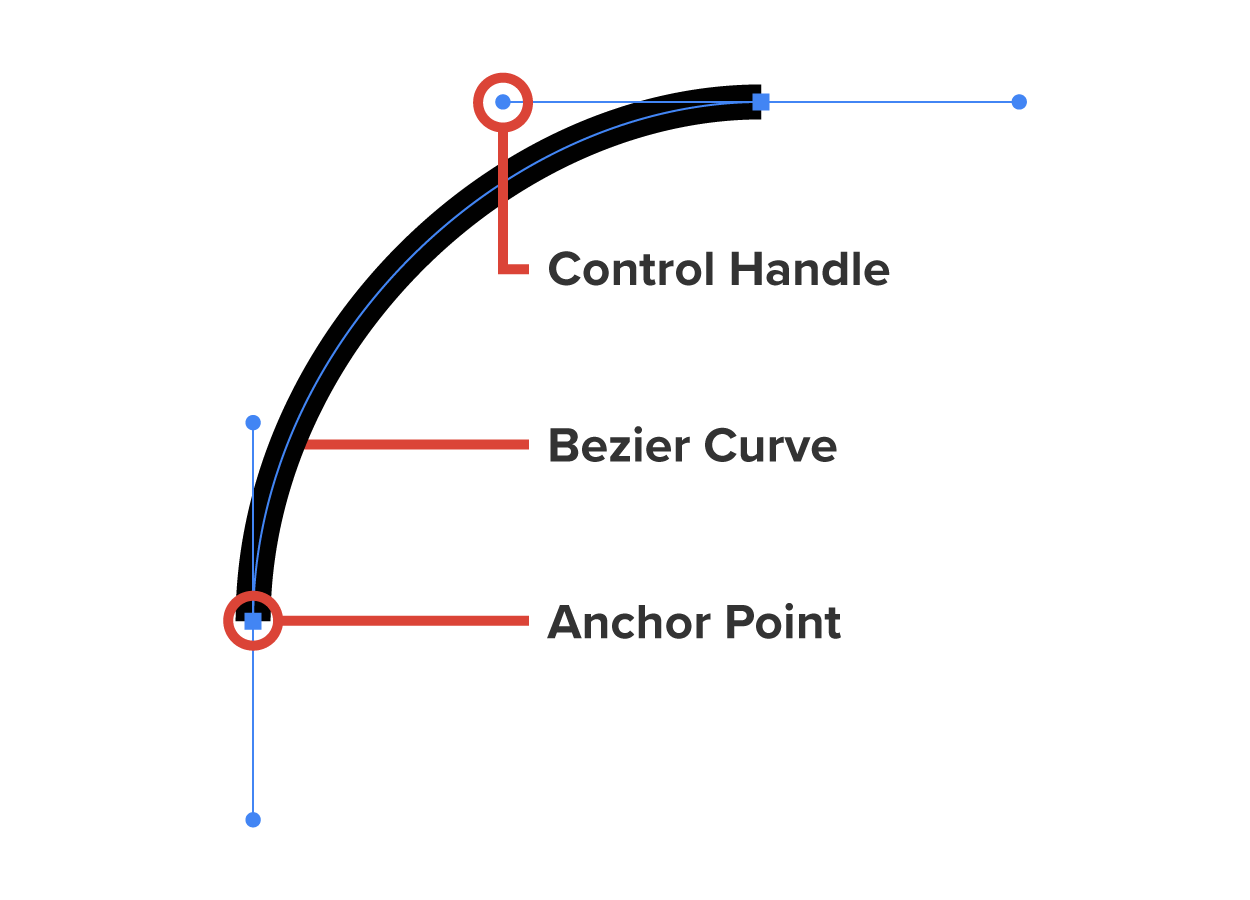
In vector graphics, each shape is defined by its geometric properties. For example, a line is defined by its start and end points, while a curve might be defined by control points that determine its shape. This mathematical basis allows vector graphics to maintain crisp edges and smooth curves at any scale, whether shrinking them down to fit on a business card or enlarging them for a billboard. Nodes, also known as anchor points, points, or control points, are essential elements that define the shape and structure of a vector path. These nodes are connected by lines or curves to form the overall graphic. By manipulating these nodes, designers can precisely control the shape of the vector graphic, adjusting the direction and curvature of the connecting lines to achieve the desired design.
Paths are the fundamental elements used to create shapes and designs, consisting of a series of points, or nodes, connected by straight lines or curves. These paths can be either open, like a line, or closed, like a polygon. An open path is a path that has distinct start and end points, meaning it does not form a closed shape. A closed path is a path where the start and end points are the same, forming a complete loop. A polygon is a two-dimensional geometric figure with at least three straight sides and angles, typically having five or more sides. Common examples of polygons include triangles, rectangles, and pentagons.
Bezier curves, a specific type of curve used in vector graphics, are defined by mathematical equations and controlled by points. By adjusting these control points, designers can create complex and precise curves, making Bezier curves an essential tool.
One of the advantages of vector graphics is their scalability. Scalability refers to the ability of an image to be resized or scaled to different dimensions without losing quality or clarity. Because they are not made up of pixels, they do not suffer from pixelation when resized. This makes them particularly useful for graphic design work where the same image might need to be used in various sizes and formats. For instance, a company logo designed as a vector graphic can be used on everything from small promotional items to large signage without any loss of quality. Scalable Vector Graphics (SVG) is an XML-based file format used to describe two-dimensional vector graphics. SVG images are defined using XML text, allowing them to be created and edited with any text editor or drawing software. One of the advantages of SVG is its scalability, meaning that images can be resized to any dimension without losing quality, making them perfect for responsive web design. Additionally, SVG supports interactivity and animation, enabling dynamic and interactive graphics. Since SVG files are text-based, they can be searched, indexed, and compressed easily. XML (eXtensible Markup Language) is a flexible text format used to create structured documents by defining custom tags. It is highly versatile for various applications, including web development.
Vector graphics are also highly editable. Since each element in a vector graphic is defined by mathematical equations, individual components can be easily modified. Designers can adjust the position, color, and shape of each element without affecting the overall quality of the image. This flexibility is particularly useful in design work where changes and adjustments are often needed.
Another benefit of vector graphics is their relatively small file size compared to high-resolution raster images. Because vector graphics store information about shapes and colors rather than individual pixels, they tend to be more compact. This can be advantageous when working with large or complex designs, as it makes the files easier to store, share, and load.
Vector graphics are commonly used in various fields, including graphic design, illustration, and typography. They are ideal for creating illustrations, diagrams, and technical drawings that require precise lines and shapes. Additionally, vector graphics are often used in web design and development, as they can be scaled to fit different screen sizes and resolutions without losing clarity. Vector graphics are a powerful tool for creating scalable, editable, and high-quality digital images. Their mathematical basis allows for precise control over shapes and colors, making them an essential component of modern graphic design and digital art.
Raster graphics are a fundamental type of digital image, composed of a grid of tiny, individual pixels, each representing a single point of color. This grid structure allows for the creation of highly detailed and complex images, such as photographs and digital paintings. A pixel, short for picture element, is the smallest unit of a digital image or display. Pixels are the tiny dots that make up the images you see on screens, such as computer monitors, televisions, and smartphones. Each pixel can display a specific color, and when combined in large numbers, they form the complete image. Raster graphics are also known as bitmaps, or bitmap images.
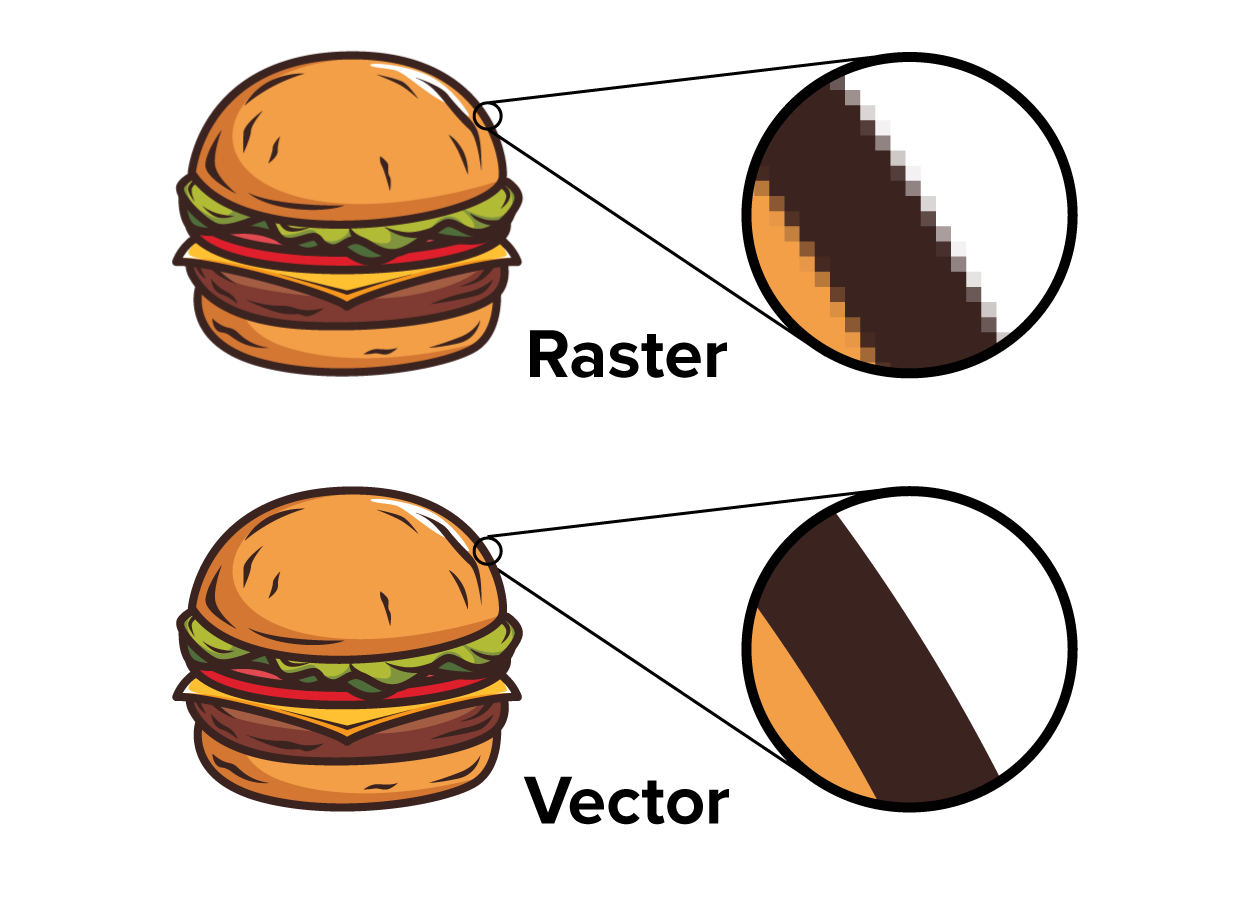
One of the characteristics of raster graphics is their resolution dependency. Resolution dependency refers to an image or graphic where its quality and clarity are directly tied to its resolution, which is the number of pixels or dots per unit of measurement, such as inches. In resolution-dependent images, the detail and sharpness of the image are fixed based on its original resolution. When you enlarge a resolution-dependent image beyond its original size, it can become pixelated or blurry because the individual pixels become more noticeable. Pixelization is the effect of individual pixels of a digital image becoming visible to the naked eye, giving the image a blocky or grainy appearance. This often happens when an image is enlarged beyond its original resolution, causing the pixels to become more conspicuous.
The resolution of a raster image is determined by the number of pixels it contains, typically measured in pixels per inch or dots per inch. Pixels Per Inch (PPI) is a measurement of pixel density, referring to the number of pixels contained within one inch of a digital display or image. It indicates the resolution of an image or screen, with higher PPI values representing greater detail and clarity. For example, a display with 300 PPI will have 300 pixels in every inch, resulting in a sharper and more detailed image compared to a display with 72 PPI. Dots Per Inch (DPI) refers to the number of individual dots of ink that a print job can produce within a one-inch space. Higher DPI values indicate a higher resolution and finer detail in the printed output. For example, a printed image in 300 DPI will produce 300 distinct dots in a single inch, resulting in a sharper and more detailed print compared to a 150 DPI image.
Raster graphics are commonly used in various applications, including digital photography, web graphics, and print media. Popular file formats for raster images include JPEG, PNG, GIF, and BMP. Each format has its own advantages and use cases. For example, JPEG is widely used for photographs due to its efficient compression, while PNG supports transparency and is often used for web graphics.
Despite their widespread use, raster graphics do not scale well to different sizes without losing quality and therefore aren’t the best choice for logos and other scalable media. This is in contrast to vector graphics, which use mathematical equations to define shapes and can be scaled to any size without loss of quality. As a result, raster graphics are best suited for images that require a high level of detail and are intended to be displayed at a specific size.
Source: THIS TUTORIAL WAS AUTHORED BY SOPHIA LEARNING. PLEASE SEE OUR TERMS OF USE.