In this lesson, you will learn about four measures of central tendency. Specifically, this lesson will cover:
-
Before beginning this lesson, we suggest you review Sophia’s Introduction to Statistics course for a refresher on several key ideas. Specifically, in this lesson, we will cover the following topics from the Introduction to Statistics course:
- Data Analysis
- Shapes of Distribution
- Mean, Median, and Mode
- Measures of Center
1. Measures of Central Tendency
The mean, median, and mode are often referred to as measures of central tendency because they provide a central or typical value of the data. In business analytics, few concepts are as fundamental as mean, median, and mode. These statistical measures of center serve as the backbone of data analysis, providing insights into various aspects of business operations, customer behavior, and market trends. In this tutorial, we will investigate the mechanics of mean, median, and mode in the context of analyzing data, exploring their practical applications, their common misinterpretations, and real-world examples of their use and misuse.
-
- Measures of Central Tendency
- The mean, median, or mode of a data set.
1a. Mean
Let us begin with the mean, perhaps the most familiar of the three measures. The mean, also known as the average, is calculated by summing all values in a dataset, and then dividing by the total number of values. The mean provides a snapshot of the central tendency of the data and is widely used in business analytics in multiple ways, from calculating revenue per customer to assessing employee productivity.
It is important to remember that the mean can be from a population (denoted by μ) or a sample (denoted by x̅). A population mean considers all data in a complete set, while a sample mean is the average of a subset of a population. The population mean is a parameter, and the sample mean is a statistic. In other words, the population mean is a fixed value that describes the entire population, while the sample mean is a variable estimate based on a sample from that population. As a business analyst, it is paramount that you understand whether you are working with population or sample data, as many analytical methods will vary based on whether the data is population or sample.
The table below displays how to calculate a population and a sample mean. For a mean, the two formulas are the same, but the notation used to denote population mean and sample mean is different.
|
Calculation
|
Formula
|
Notes
|
|
Population Mean
|

|
μ = population average
X = individual values of population
N = count of individual values
|
|
Sample Mean
|

|
x̅ = sample average
x = individual values of population
n = count of individual values in sample
|
-
The Greek sigma, written as Σ, is a symbol in mathematics and statistics to indicate to “add up” or “sum together” a series of numbers. Sometimes, Σ has indices that tell you where to start and stop adding. For example, in

the lower index is

, meaning that you start at 1. The upper index is
n, which usually denotes the total number of observations in a data set for a particular variable, meaning that you end at your last data point in the data set. The lowercase values of
x denote the data values.
If you wanted to use the ∑ notation to sum up the number of patients that a veterinary sees each day who are delinquent in paying their bills, you would perform the following.
|
Day
|
Number of Patients
|
|
Monday
|
8
|
|
Tuesday
|
9
|
|
Wednesday
|
10
|
|
Thursday
|
2
|
|
Friday
|
5
|

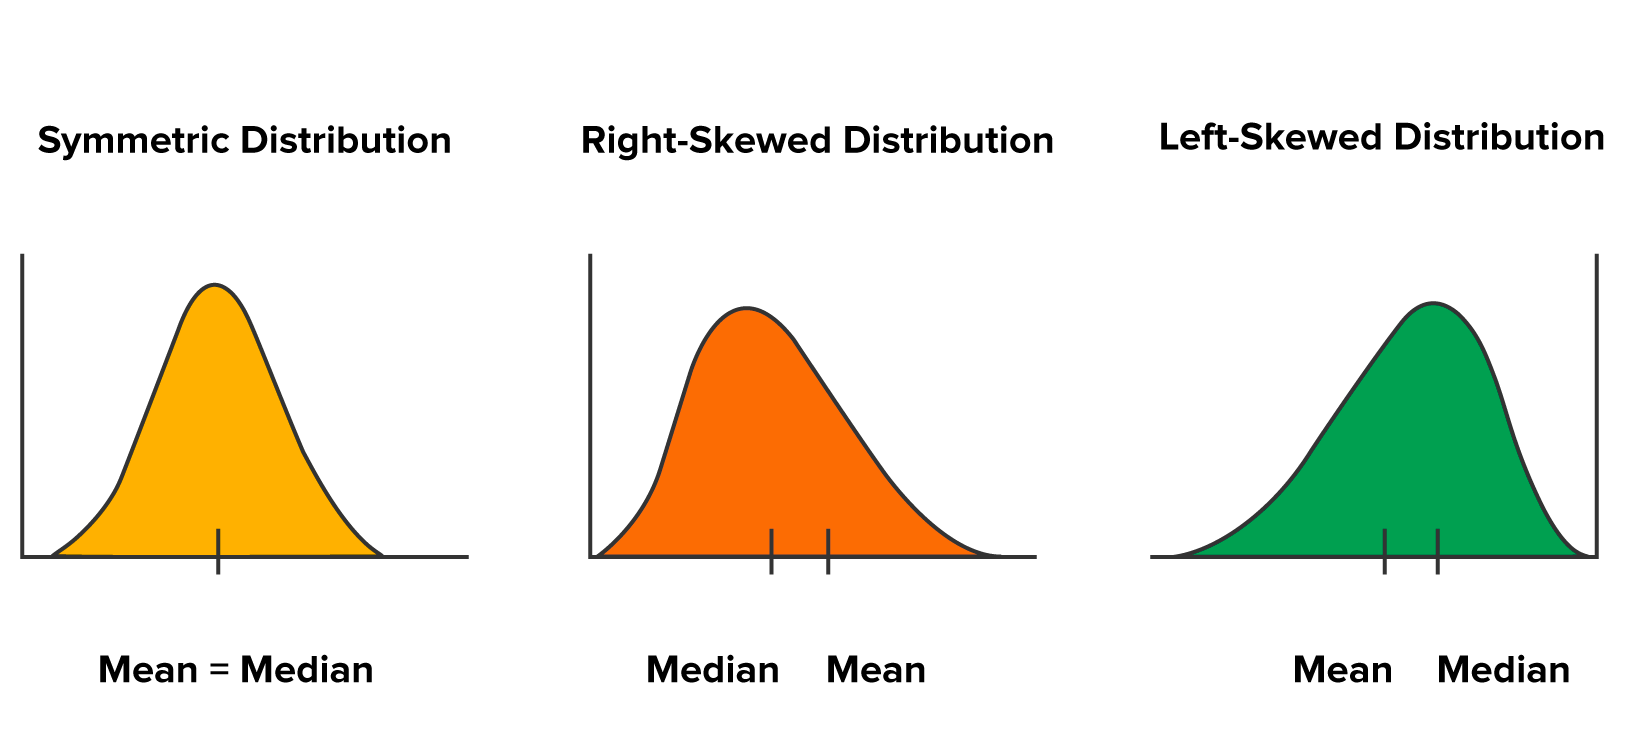
Means can be heavily influenced (skewed) when outliers are present. Skew happens when data is not distributed symmetrically, it is the measure of asymmetry in the distribution of data. If data is skewed to the right, most of the outliers will be present on the right side of the distribution. In a right-skewed distribution, the mean will be larger than the median. If data is skewed to the left, most of the outliers will be present on the left side of the distribution. In a left-skewed distribution, the mean will be smaller than the median. If data is not skewed, it is considered symmetric. Symmetric data is data that is evenly distributed around the mean. The figure below illustrates these concepts.
|
Situation
|
Skew
|
|
Mean > Median
|
Right
|
|
Mean > Mode
|
Right
|
|
Mean = Median
|
Normal
|
|
Mean = Mode
|
Normal
|
|
Mean < Median
|
Left
|
|
Mean < Mode
|
Left
|
IN CONTEXT
The Case of Misleading Averages
Retail Row, a low-price retail chain, is analyzing regional average sales to evaluate performance. Assume there are four regions, and there are five stores per region. Region A boasts impressive average sales figures, leading management to shower it with praise and incentives. However, upon closer inspection, it is revealed that this average is skewed by a few exceptionally high-performing stores, while the majority struggle to meet targets. By relying solely on the mean, the company fails to identify underperforming stores in need of support and optimization.
While the mean provides valuable insights, it can be easily influenced by outliers, leading to skewed interpretations and misguided decisions. Always examine the distribution of data alongside the mean to gain a comprehensive understanding.
-
Let’s calculate some averages for the Retail Row example.
1. Open the
retail_row_rents.xlsx data in Excel.
The data provided are the rent expenses as reported by four regional managers for Retail Row. Each regional manager is responsible for five stores. The averages reported are in the $1,000s.
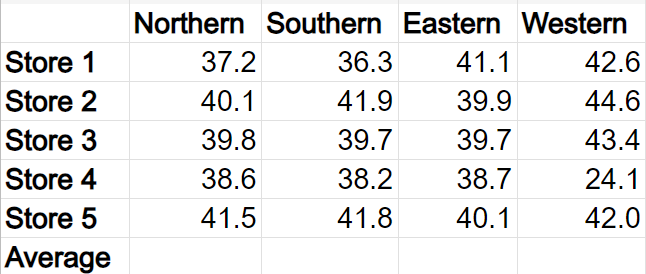
You are going to calculate the average rent for the five stores in each region using the AVERAGE() Excel function. The argument required for the AVERAGE() function is the range of cells that contain the data you wish to take the average of.
2. In cell B7, enter the following formula and select
Enter.
=AVERAGE(B$2:B$6)
You will obtain an average value of 39.44 ($39,440) for the five stores in the Northern region.
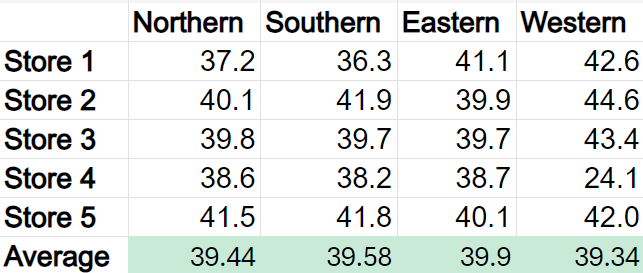
Regional managers report the average rent expense for their regions as follows (in $1,000’s):
|
Northern Region:
|
39.44
|
|
Southern Region:
|
39.58
|
|
Eastern Region:
|
39.90
|
|
Western Region:
|
39.34
|
Based on these regional averages, management proposes that the Western regional manager should receive a bonus for her careful attention to rent expenses. The Northern regional manager disagrees. To resolve the case, management presents you with a spreadsheet of yearly rent expenses, by region and store.
-
Use what you have learned about means to resolve this issue for Retail Row. Hint: recall the effect of outliers on means.
Do the data support a decision to give the Western Manager a bonus?Even though the Western region has the lowest rent expense average, its other stores (except for store four) have higher rent expenses than the comparable regions. Store four has an unusually low rent expense, which skews the data when using averages. Averages can be misleading, due to (in this case) one store with an exceptionally low rent expense.
What other data might you need to present your case?It would be helpful to have to following data:
- Sales data for each store—this could help justify the expense of each store.
- The city in which the store is located—rent is more expensive in some areas than others.
- Net profit/loss for each store—determining rent expense as a percentage of profit can help in the analysis of the expense.
- What other data might you choose?
This data could help to add clarity to why rent expenses are high or low in some areas.
-
Follow along with this video on calculating average rent.
-
- Mean
- The sum of values divided by count.
- Population Mean
- A mean that is calculated from a population.
- Sample Mean
- A mean that is calculated from a sample.
- Skew
- The measure of asymmetry in the distribution of data.
- Skewed to the Right
- Data in which most of the outliers are present on the right side of the distribution.
- Skewed to the Left
- Data in which most of the outliers will be present on the left side of the distribution.
- Symmetric Data
- Data that is evenly distributed around a mean.
1b. Geometric Means for Growth Rates
Let’s consider an example of when you would need a geometric mean as a motivation to understand why we need an alternative to the standard mean calculation (arithmetic).
The arithmetic mean can be misleading when calculating average growth rates due to its additive nature. The arithmetic mean treats each data value equally, sums them up, and divides them by the total number of observations. However, growth rates are inherently multiplicative, not additive. When we say that a growth rate is multiplicative, we are referring to how changes in a quantity are expressed relative to its previous value. A multiplicative change occurs when a value increases or decreases by a certain percentage (or factor) relative to its previous value. Instead of adding or subtracting a fixed amount, we multiply or divide by a factor. When calculating an average growth rate, you are examining how multiplicative changes occur over time. Multiplicative changes, such as growth rates, compound over periods, while additive changes, like the number of units sold per quarter, do not.
The geometric mean is a measure of central tendency that is calculated by taking the nth root of the product of n values. The formula for the geometric mean is given by:
-
- Geometric Mean

The subscript g on the sample mean symbol (x̅) denotes the mean is a geometric sample mean.
The geometric mean is appropriate for analyzing growth rates in financial data.
-
EXAMPLE
Suppose you are analyzing the annual growth rates of a company’s revenue over three years. The growth rates are given below:
- Year 1: Revenue increased by 10%
- Year 2: Revenue increased by 15%
- Year 3: Revenue increased by 30%
To calculate the geometric mean, add 1 to each percentage before multiplying them together to avoid negative percentages. For example, if a company had a -5% decrease in revenue, if we add 1 to this percentage, the percentage used in the calculation will remain positive

The geometric mean for this data would be:

The geometric mean for this data is 1.18. This means that, on average, the company’s revenue grew by ~18% annually over the three-year period.
The example below illustrates how the arithmetic mean is a poor measure when calculating an average with data that has a compounding effect.
-
EXAMPLE
You are interested in calculating the mean growth rate over a four-year period, based on the percentage changes from the previous year (PY). You can follow along with the formulas used in this example by opening
GvA_Growth.xlsx.
 Model A:
 The geometric mean accounts for compounding effects by multiplying all percentage changes together and taking the nth root (where n is the number of years).
1. Open
GvA_Growth.xlsx.
2. Convert the percentages to decimal form by selecting Column C and changing the number format to General.
3. Add 1 to each decimal to help avoid having negative percentages. In the cell next to C3, enter the following formula and select ENTER.
=C3+1
4. Use the fill handle (a small square at the bottom-right corner of the cell) to drag the formula down from D3 to D6. This will apply the same calculation to the other cells in Column D.
5. Now calculate the geometric mean growth rate. If you want, you can label a cell A8 with Geometric Average and then in cell D8, enter the following formula and press ENTER.
=GEOMEAN(D3:D6)
6. To obtain the mean growth rate, we will subtract 1 from this average and then view the calculation as a percentage.
In cell D7, place the following formula and press ENTER.
=D8-1
7. To see the answer as a percentage, ensure Number Format is set to Percentage.
If calculated by hand, the formula for this calculation would be:
 Model B:
 The arithmetic mean simply adds up all the percentage changes and divides by the number of years.
1. Calculate the arithmetic mean growth rate. If you want, you can label cell A9 with Arithmetic Mean and then in cell D9, enter the following formula and press ENTER.
=AVERAGE(C3:C6)
2. Ensure Number Format is Percentage for this cell.
The formula for this calculation, if calculated by hand, would be:

Check your work by comparing it to the table shown at the beginning of the example.
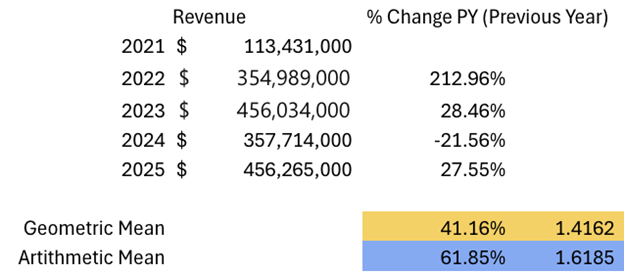
The spreadsheet below compares these two models of revenue growth from 2021-2025. Model A is based on the geometric mean, and Model B is based on the arithmetic mean.
Which average accurately captures the rate of growth over this period? Let’s start with the actual year 1 revenue and apply the geometric and arithmetical calculated average growth rates.
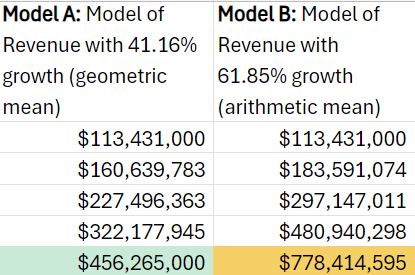
The geometric mean is the most suitable measure of central tendency in this scenario because it accounts for the compounding effects inherent in growth rates, thereby accurately reflecting consistent proportional growth over time.
-
Use geometric means for data involving growth rates or returns over multiple periods, such as investment returns, sales growth, or population growth.
-
- Geometric Mean
- A central tendency measure that is appropriate for data with a multiplicative nature.
1c. Median
The median is the middle value of a data set, when arranged in ascending (smallest to largest) order. Unlike the mean, the median is not affected by extreme values, making it a robust measure of central tendency, particularly in skewed distributions. In business analytics, the median finds application scenarios such as determining the typical salary in a company or assessing housing prices in a real estate market.
-
Recall, if the dataset has an odd number of entries, there is a true median. If the dataset has an even number of entries, the median is the average of the two middle numbers, when arranged in ascending order.
IN CONTEXT
The Tale of Two Salaries
Consider a Human Resources (HR) department analyzing employee salaries. The mean salary appears inflated due to a few high-paid executives, giving the impression of generous compensation across the board. However, when the median salary is calculated, it paints a different picture, revealing that most employees earn significantly less than the mean suggests. This discrepancy prompts HR to reassess its compensation strategy and ensure equitable pay practices.
The median serves as a reliable indicator of central tendency, especially in datasets prone to skewness or outliers. Incorporate the median alongside the mean to gain a more nuanced understanding of the data distribution.
-
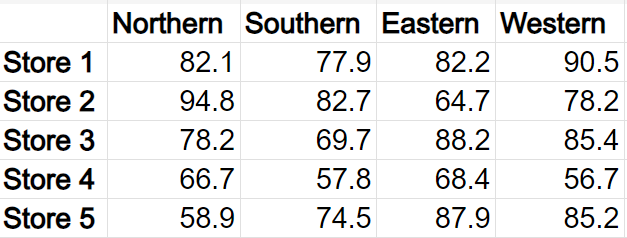
Returning to the Retail Row scenario, you have now been provided with the net sales for the company for the five stores in all four regions.
1. Open the
retail_row_sales.xlsx file in Excel. The sales are presented in $1,000s.
Calculate the median net sales for all stores using the MEDIAN() Excel function. The argument required for the MEDIAN() function is the range of cells that contain the data you wish to take the median of.
2. In any empty cell, enter the following formula and select
Enter.
=MEDIAN(B2:E6)
The cells B2 through E6 contain all the values of the net sales for all stores.
The formula should have returned 78.2. The median sales for all stores across all regions is $78,200.
3. Repeat these steps, but now find the average of the net sales. In another empty cell, enter the following formula and press
Enter.
=AVERAGE(B2:E6)
The formula should have returned 76.54. The average net sales for all stores is $76,540.
Since the mean is a little less than the median, you can conclude that the data is slightly left-skewed. When data is skewed, the median is a better measure of central tendency than the mean.
-
Follow along with this video on calculating average and median net sales.
-
- Median
- The middle value of a data set, when the data is arranged in ascending order (smallest to largest).
1d. Mode
The mode is the value that appears most frequently in a dataset. While less commonly used than the mean and median, the mode offers unique insights, particularly when working with categorical data. Assume you want to know which department customers visited in a department store, so you ask a random sample why they came to the department store that day. If you constructed the frequency distribution for departments shown in the table below, the Toy category would be the mode because it is the category that appears the most (has the largest frequency).
|
Product Category
|
Frequency
|
|
Electronics
|
10
|
|
Clothing
|
8
|
|
Home Appliances
|
5
|
|
Toys
|
12
|
|
Beauty
|
6
|
In business analytics, the mode finds relevance in identifying the most popular product or service, understanding customer preferences, and optimizing inventory management.
IN CONTEXT
The Inventory Conundrum
A bookstore is concerned with inventory management. Because inventory is disproportionately allocated, often popular items are not in stock, while they carry excess inventory of slower-moving products. The management team relies on historical sales data to predict demand and ensure adequate stock levels, but overlooks the importance of identifying the best-selling products. This oversight not only impacts sales but also incurs additional storage and handling costs. In this case, identifying the mode (the most popular items) could help assure the bookstore of having the correct inventory levels of popular items.
Do not underestimate the power of the mode in identifying patterns and trends within categorical data. Incorporate it into your analysis to optimize decision-making and resource allocation.
-
- Mode
- The value that appears most frequently in a data set.
2. Comparing Mean, Median, and Mode
Now that we've explored the significance of mean, median, and mode in business analytics, let's review some real-world examples of companies that have struggled with the analysis of these measures. See if you can identify the problem.
-
Real-World Missteps: Business Paralysis Due to Bad Analysis
Misstep 1: The "Average" Coffee Price
A trendy coffee shop chain decides to set its prices based on the average cost of coffee in the city. They calculate the mean price across various competitors and proudly announce their pricing strategy.
What’s the problem?The coffee shop failed to consider that the mean is heavily influenced by outliers—including luxury cafes serving premium blends. As a result, their pricing falls significantly above what most customers are willing to pay, leading to dwindling sales and disgruntled caffeine aficionados.
Misstep 2: The "Median" Marketing Campaign
A multinational corporation launches a marketing campaign targeting millennials, citing the median age of the demographic as justification.
What’s the problem?This company overlooked the fact that the median represents the midpoint of the age distribution, not necessarily the peak of the target audience. As a result, their campaign fails to resonate with the intended demographic, leaving them reevaluating their approach.
Misstep 3: The "Mode" Mishap
A fast-food chain has decided to revamp its menu based on customer feedback, focusing on the most commonly requested items. They conduct surveys and interviews, compiling a list of popular menu choices.
What’s the problem?They failed to account for regional preferences and seasonal variations, resulting in a menu dominated by burgers and fries while neglecting regional delicacies and healthier options. Customers are left disappointed, and the chain faces backlash for its lack of product diversity and innovation.
The mean, median, and mode are indispensable tools of business analytics, offering valuable insights into data distributions, central tendencies, and patterns. However, their misuse or misinterpretation can lead to erroneous conclusions and misguided decisions, as evidenced by the previous examples. By understanding the strengths and limitations of each measure and incorporating them into analysis, businesses can unlock deeper insights, optimize performance, and avoid statistical blunders along the way.
So, the next time you find yourself crunching numbers or analyzing data, remember the importance of the mean, median, and mode—and the lessons they can teach us about business analytics.
In this lesson, you learned about four measures of central tendency: mean, geometric mean, median, and mode. Guidelines were provided for choosing between each of the measures of central tendency. Examples were given of misguided consequences that can occur if the incorrect central measure of tendency is selected in a business analytics scenario.
