Use Sophia to knock out your gen-ed requirements quickly and affordably. Learn more
×

Understanding Indicators

Author: Sophia

what's covered
This lesson will cover the topic of understanding indicators. We will explore how economists use data to study the economy and discuss different economic indicators, such as leading, lagging, and coincident. Specifically, this lesson will cover the following:

Table of Contents

1. Economic Indicators

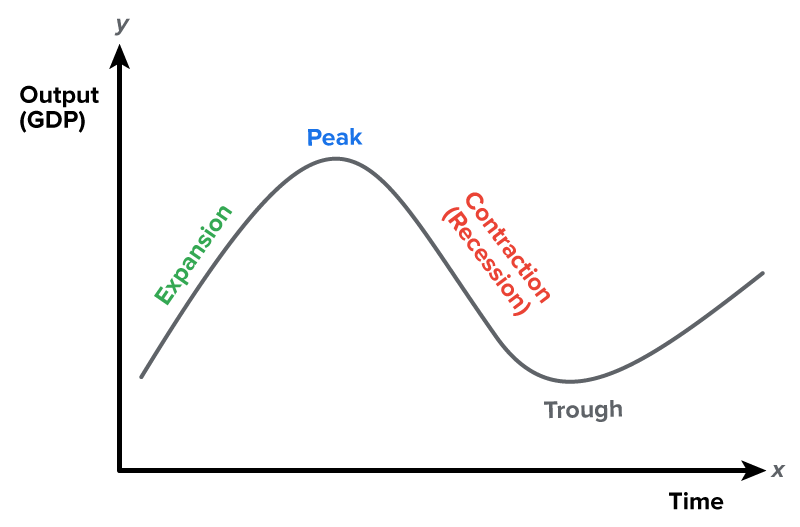
This is a business cycle, which shows that it is normal for the economy to go through periods of growth (also known as expansion or a peak) and contraction (also known as recession or a trough).

The line graph shows a business cycle. The graph is in the shape of a sine wave showing changes in GDP over time, with four labeled stages: ‘Expansion’, which is an upward slope; ‘Peak’, the highest point; ‘Contraction (Recession)’, the downward slope; and ‘Trough’, the lowest point.

At any given time, when thinking about the health of any economy, most people pay attention to the three key macroeconomic indicators: economic growth, full-employment and unemployment rates, and the consumer price index (CPI)/inflation rate.

However, economists use several kinds of data to help them track and measure these three primary economic indicators:

  • Economic growth
  • Employment
  • Price
Having this information will help them better understand the economy as well as do the following:
  • Predict where the economy is headed
  • Explain what has just occurred in the economy
  • Look at what is currently happening in the economy
These correspond to the three data-specific economic indicators that indicate the direction of past, present, or future economic activity:
  • Leading/predictive indicator (future)
  • Lagging/lagged indicator (past)
  • Coincident/lagged indicator (past)
Economic indicators provide a snapshot of the economy at any given point in time, which is why they are studied in macroeconomics, because macroeconomics is all about the overall economy and how healthy it is.


2. Leading Indicators

Leading indicators are trends, patterns, or situations that assist in forecasting the economy. They show us where the economy is headed, and they can be used by policymakers and business owners to predict future economic events and make economic decisions in the hopes of fostering economic growth and development, ceteris paribus (an economic term for “all other things being equal”).

Examples of leading indicators include the following:

  • Unemployment insurance claims
  • Building permits
  • Stock or equity market performance.
  • Consumer and producer confidence index
These indicators show us where the economy might be headed, which is why they are leading indicators.

term to know
Leading Indicators
Trends, patterns, or situations that assist in forecasting the economy.
Ceteris Paribus
A Latin phrase used in the field of economics that means “all other things being equal.” It holds the indictment that a single variable in an economic model or situation has an effect or causes a change as long as all other variables or things remain the same or unchanged.


3. Lagging Indicators

Lagging indicators are trends, patterns, or situations that provide a clear indication of where the economy has been. Basically, they are after the fact, or confirm and provide evidence to evaluate how the economy reacted to the economic policies and decisions made by businesses and policymakers.

Examples of lagging indicators include the following:

  • Unemployment rate
  • CPI
  • Producer price index
  • Corporate profit margins (bottom and top lines)
  • Consumer credit
These indicators show us, after the fact, where our economy might have been, so they tend to lag what is currently happening in the economy.

term to know
Lagging Indicators
Trends, patterns, or situations that provide a clear indication of where the economy has been.


4. Coincident Indicator

Finally, a coincident index is an indicator that provides a view of the current state of the economy. These indicators help in monitoring the performance of the economy in real time.

A good example of a coincident indicator is a retail sales number, which is the subject of a different lesson. This economic indicator provides a snapshot of the performance at the moment.

Examples of coincident indicators include the following:

  • Retail sales numbers
  • Subscription to service products
  • Labor participation index
term to know
Coincident Index
An indicator that provides a view of the current state of the economy.


5. Why So Many Indicators?

There are many indicators that help us assess the state of the economy. It is helpful to have multiple indicators because of the following:

  • Our economy is very complex.
  • No single indicator is perfect at thoroughly explaining what is going on.
Let's examine the following cases:

EXAMPLE

If the state of Texas wants to increase its road construction expenditure, policymakers will have to analyze the following leading economic indicators:
  • Stock and bond markets
  • Building permit approval rates
  • Consumer confidence

A favorable result from these indicators indicates that the economy is likely to see economic growth and development soon.

EXAMPLE

If Walmart wants to evaluate its performance in the context of the overall performance of the economy, its top executives will have to analyze the following lagging economic indicators:
  • Consumer and producer price index (inflation)
  • Industry-wide corporate profit margins
  • The unemployment rate

Companies like Walmart use these indicators to evaluate how favorable the economy is to invest in new products or discontinue existing projects.

EXAMPLE

If Equinox Gym decides to expand its space within the next two quarters of the year, its top business advisors will have to analyze the following coincident economic indicators:
  • Retail/sale figures
  • Membership subscription figures
  • Local economy labor participation figures

This is why it is helpful to have so many indicators.

summary
Today, we briefly discussed how economists use data to study the overall economy. We learned that there are three different categories of economic indicators: leading indicators, lagging indicators, and coincident indicators. Lastly, we learned that there are so many indicators because our economy is complex and no single indicator can completely explain what is happening in the economy. Here is a breakdown of the indicators we covered:

Indicators Timing Aim/Use Economic Indicators Example
Leading Before economic trajectory Predict future performance Unemployment insurance claims, building permits, stock or equity market performance, and consumer and producer confidence index The declining stock market, increasing approval of homeowners with bad credit, approval of new housing permits, and declining consumer confidence in late 2005–2006 suggested the 2007–2008 Great Recession.
Lagging After economic trajectory Confirm/evaluate past decisions/performance Unemployment rate, consumer price index, producer price index, corporate profit margins (bottom and top lines), and consumer credit The supply chain shortage, the high unemployment rate among nonessential workers, increased transfer payments through stimulus checks, and the Great Resignation period confirmed that the 2019 COVID-19 pandemic harmed the U.S. economy.
Coincident During economic trajectory Monitor current economic events and conditions Retail sales numbers, subscription to service products, and labor participation index Both local and international investment bankers use the current RGDP, labor participation rate, and retail sales data to monitor the momentum of the U.S. economy.

Source: THIS TUTORIAL WAS AUTHORED BY KATE ESKRA FOR SOPHIA LEARNING. PLEASE SEE OUR TERMS OF USE.

Terms to Know
Ceteris Paribus

A Latin phrase used in the field of economics that means “all other things being equal.” It holds the indictment that a single variable in an economic model or situation has an effect or causes a change as long as all other variables or things remain the same or unchanged.

Coincident Index

An indicator that provides a view of the current state of the economy.

Lagging Indicators

Trends, patterns, or situations that provide a clear indication of where the economy has been.

Leading Indicators

Trends, patterns, or situations that assist in forecasting the economy.