Table of Contents |
Transitioning from one-sample to two-sample hypothesis testing involves expanding your focus from analyzing a single group to comparing two distinct groups. In one-sample hypothesis testing, you assess whether the mean of a single sample significantly differs from a known or hypothesized population mean, denoted as  This approach is useful when you have a specific benchmark or standard to compare against. However, in many real-world scenarios, you are interested in comparing the means of two independent groups to determine if there is a significant difference between them. This is where two-sample hypothesis testing comes into play. By comparing the means of two samples, you can draw conclusions about the differences between two populations. An example of this could be comparing the effectiveness of a marketing campaign for two different sales regions of the country.
Just as there are three types of tests for one-sample hypothesis tests, there are similar tests for two-sample hypothesis tests, including two-tailed, right-tailed, and left-tailed tests.
In the table below, we'll look at each of these types of tests and provide an example of each.
| Type of Test | Hypothesis | Example |
|---|---|---|
| Two-Tailed |

|
Comparing the average monthly expenses of the marketing and development departments to see if there is any difference. |
| Right-Tailed |

|
Comparing the average monthly sales of Store A to Store B to see if Store A has higher sales. |
| Left-Tailed |

|
Comparing the average monthly expenses of marketing strategy A to see if it is less expensive compared to marketing strategy B. |
 (mean response time after the training program is the same as the mean response time before the training program)
 (mean response time after the training program is less than the mean response time before the training program) (mean number of tasks completed per day by employees in Sales and Customer Support are equal)
 (mean number of tasks completed per day by employees in Sales and Customer Support are different, not equal) (mean revenue generated by Campaign A is equal to the mean revenue generated by Campaign B)
 (mean revenue generated by Campaign A is greater than the mean revenue generated by Campaign B)
Below are the steps you can use to perform a two-sample hypothesis test for means.
When comparing the means of two groups using a t-test, it’s important to check if the variances (a measure of how spread out the data is) of the two groups are equal. This is known as the equal variance assumption.
A t-test will be used to perform the two-sample hypothesis test for two means. The standard two-sample t-test assumes that the variances of the two groups are equal. If this assumption is not true, the test results might be inaccurate. This could lead to wrong conclusions about whether the means of the two groups are different.
If the variances are equal, you use the pooled t-test. This test combines the variances of both groups into one, making the calculation simpler. If the variances are not equal, you use Welch’s t-test. This test adjusts for the difference in variances, providing more reliable results when the spreads of the data are different.
Let’s look at how you would determine if you had equal variances or not among two groups of interest.
EXAMPLE
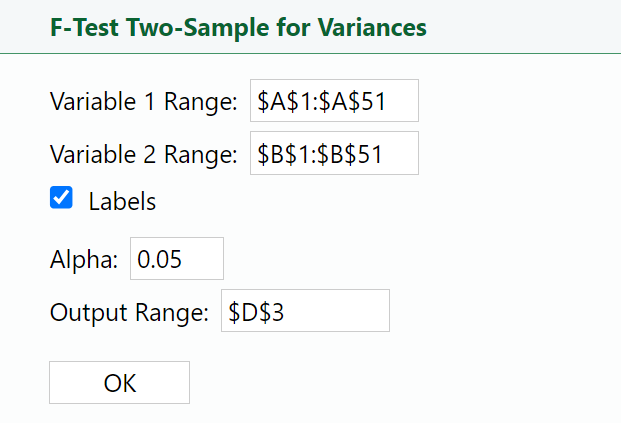
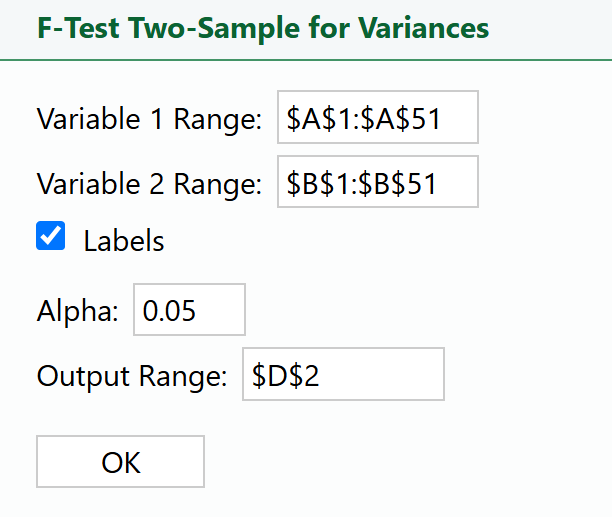
TechWave Innovations is a rapidly growing tech company specializing in developing cutting-edge software solutions. The company has two main departments: Marketing and Development. Recently, the CFO (Chief Financial Officer) has noticed fluctuations in the monthly expenses of these departments and wants to ensure that resources are being allocated efficiently. (variance in monthly expenses for the Marketing department is equal to the variance in monthly expenses for the Development department)
 (variance in monthly expenses for the Marketing department is not equal to the variance in monthly expenses for the Development department)
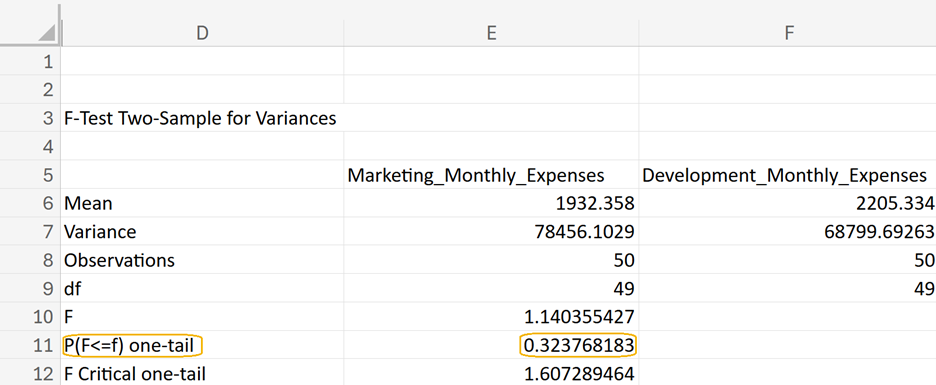
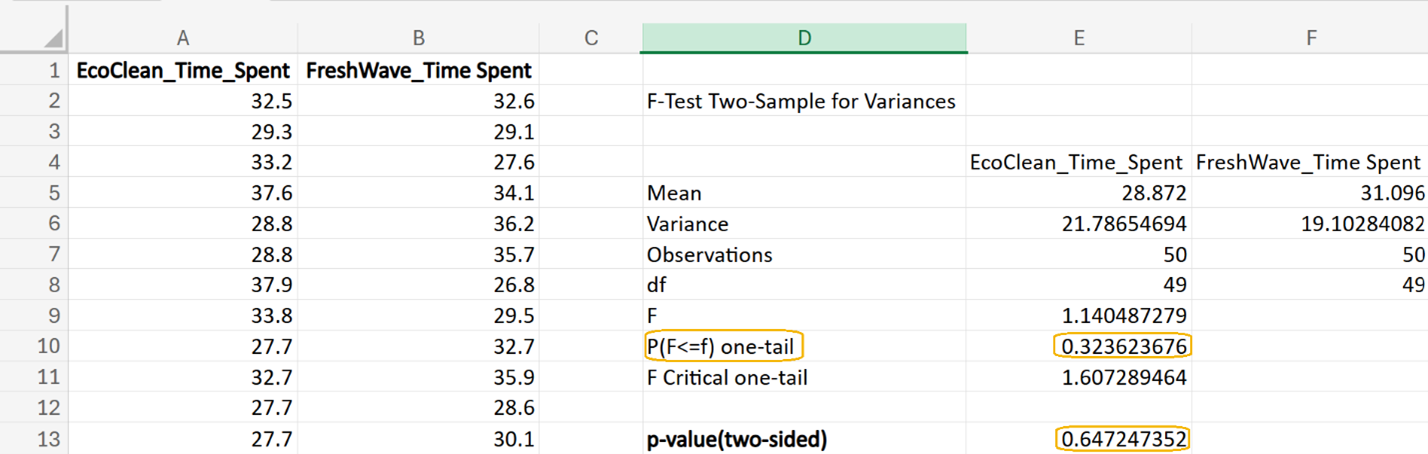
 is the p-value for the hypothesis test for the equality of variances. With this p-value, using a level of significance (α) of 0.05, you fail to reject the null hypothesis.
In the upcoming sections, you will explore how to perform a two-tailed hypothesis test for detecting differences in means. You will discover the purpose of the test, how to perform the test, and how to interpret the results. Examples and hands-on exercises will illustrate how to set up and interpret a two-tailed test for testing the difference between two means, helping you understand when and how to use them. By working through these scenarios, you will gain a deeper insight into hypothesis testing for testing differences among the means from two populations and their applications in real-world data analysis.
Let's walk through a practical example of performing a two-sample hypothesis test for means for a two-tailed test.
EXAMPLE
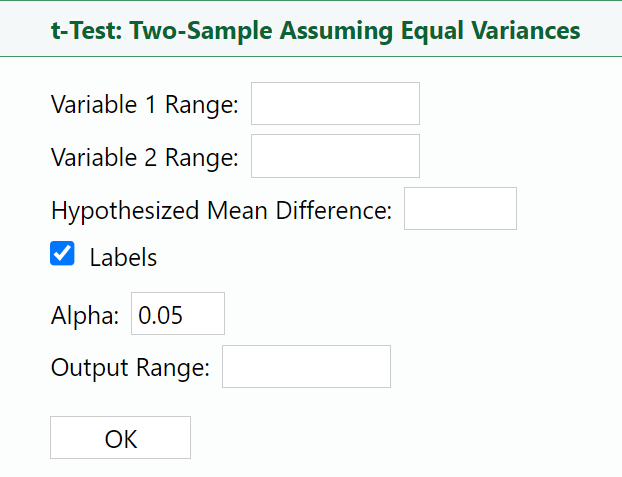
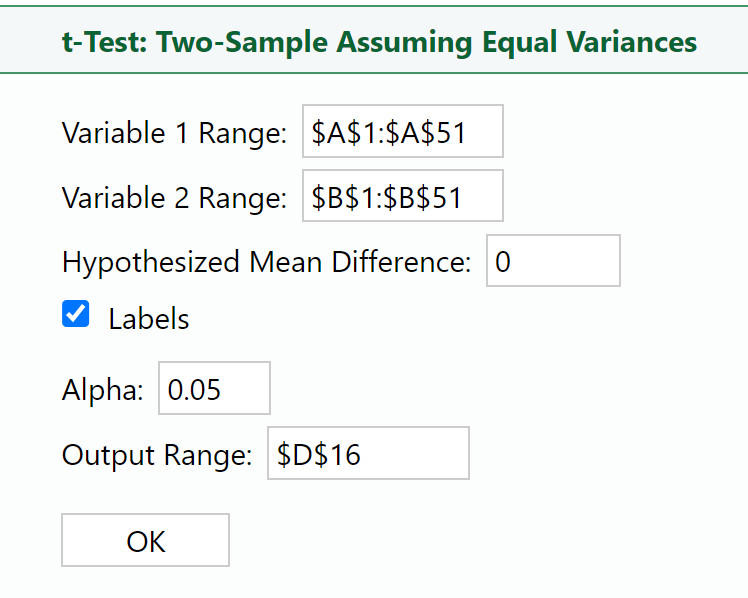
Continuing with the TechWave Innovations example from the previous section, conduct the two-sample t-test, now that you know you can assume equal variances among the Marketing and Development departments' expenses. (no difference in the average monthly expenses between the Marketing and Development departments)
 (there is a difference in the average monthly expenses between the Marketing and Development departments)
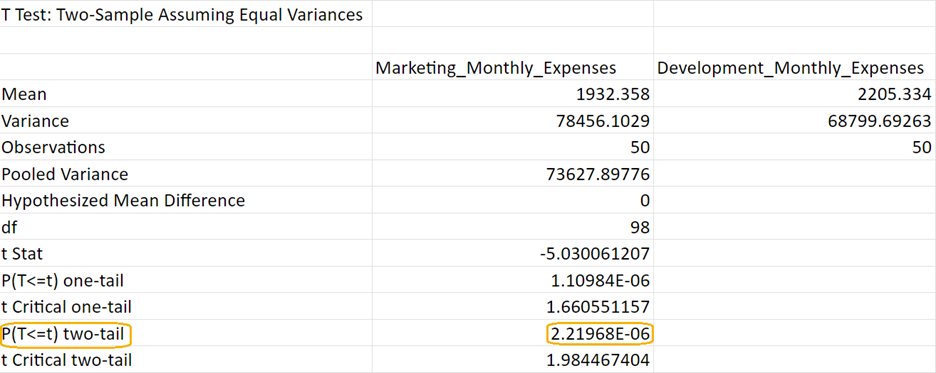
 To convert 2.21968E-06 to standard form, multiply
  which is a very small p-value!
 (level of significance), you reject the null hypothesis.
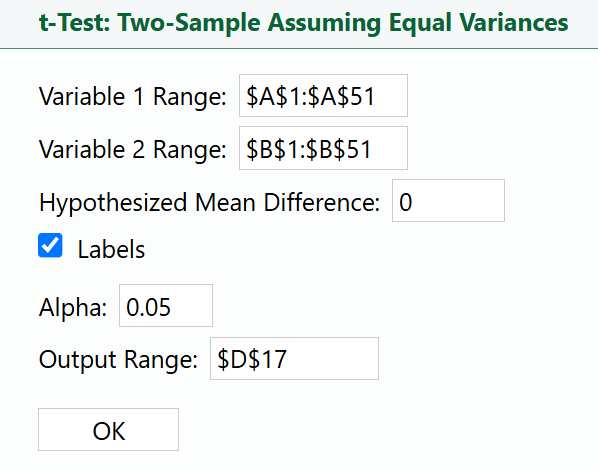
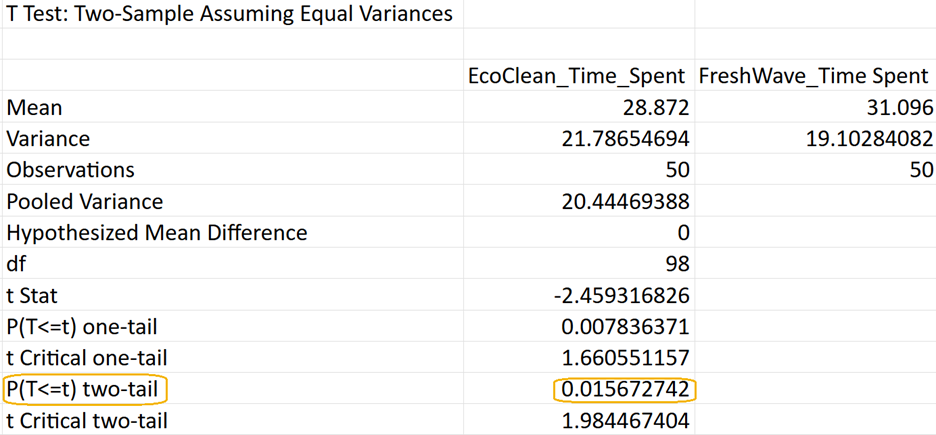
(mean amount of time spent on EcoClean product page is the same as mean amount of time spend on FreshWave product page for all visitors) (mean amount of time spent on EcoClean product page is not the same as mean amount of time spent on FreshWave product page for all visitors)
(level of significance), you reject the null hypothesis.
(mean amount of time spent on EcoClean product page is the same as mean amount of time spend on FreshWave product page for all visitors) (mean amount of time spent on EcoClean product page is not the same as mean amount of time spent on FreshWave product page for all visitors)  is population variance for EcoClean and measures how much the time spent on the EcoClean product page varies among all visitors.
 is the population variance for FreshWave and measures how much the time spent on the FreshWave product page varies among all visitors.
Source: THIS TUTORIAL WAS AUTHORED BY SOPHIA LEARNING. PLEASE SEE OUR TERMS OF USE.