EXAMPLE
BrightFuture Electronics, a company specializing in consumer electronics, recently launched a new marketing strategy aimed at boosting sales. To evaluate the effectiveness of this strategy, the marketing team decided to compare the average monthly sales figures from two different periods: three months before the strategy was implemented and three months after.
Before implementing the new marketing strategy, the company recorded the monthly sales data for a sample of 50 stores. After the strategy was launched and completed, they collected sales data for the same 50 stores. The marketing team hypothesizes that the new marketing strategy has led to an increase in sales. To test this hypothesis, they decide to use a two-sample right-tailed t-test.
You will perform the two-sample right-tailed t-test to determine if the mean sales after the implementation of the new marketing strategy are significantly higher than the mean sales before the strategy.
Step 1: State the Hypotheses
- H₀:
 (mean sales after the implementation of the new marketing strategy are equal to the mean sales before the implementation)
- H₁:
 (mean sales after the implementation of the new marketing strategy are greater than the mean sales before the implementation)
Step 2: Gather the Data
Sales data was randomly sampled from 50 stores for three months before and three months after implementing the new marketing strategy. The data is in the Excel file named
sales_before_after_marketing_strategy.xlsx.
Step 3: Choose a Significance Level
Use a level of significance,
 Step 4: Check for Equal Variances
You test the following in Excel.
- H₀:
 (variance in the sales data before and after the implementation of the new marketing strategy are equal)
- H₁:
 (variances of the sales data before and after the implementation of the new marketing strategy are not equal)
To perform the equality of variances test in Excel using the
sales_before_after_marketing_strategy.xlsx file, perform the following.
1. Select
F-Test Two Sample for Variances in the
XL Miner Analysis Toolpak. The dialog box opens.
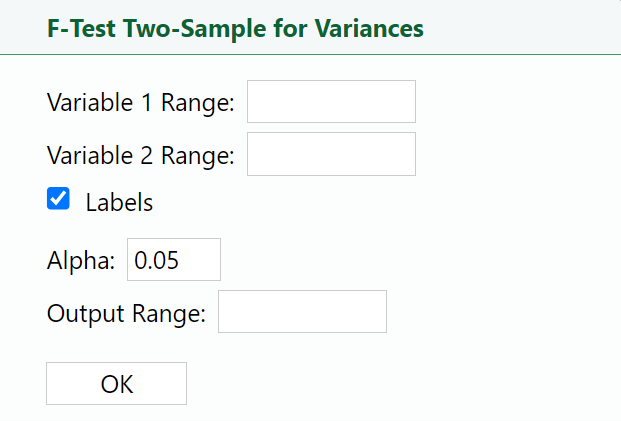
2. Place your cursor in the
Variable 1 Range: box and select the data in column B.
3. Place your cursor in the
Variable 2 Range: box and select the data in column C.
4. Place your cursor in the
Output Range: box, select cell D2 in the Excel worksheet, and select
OK.

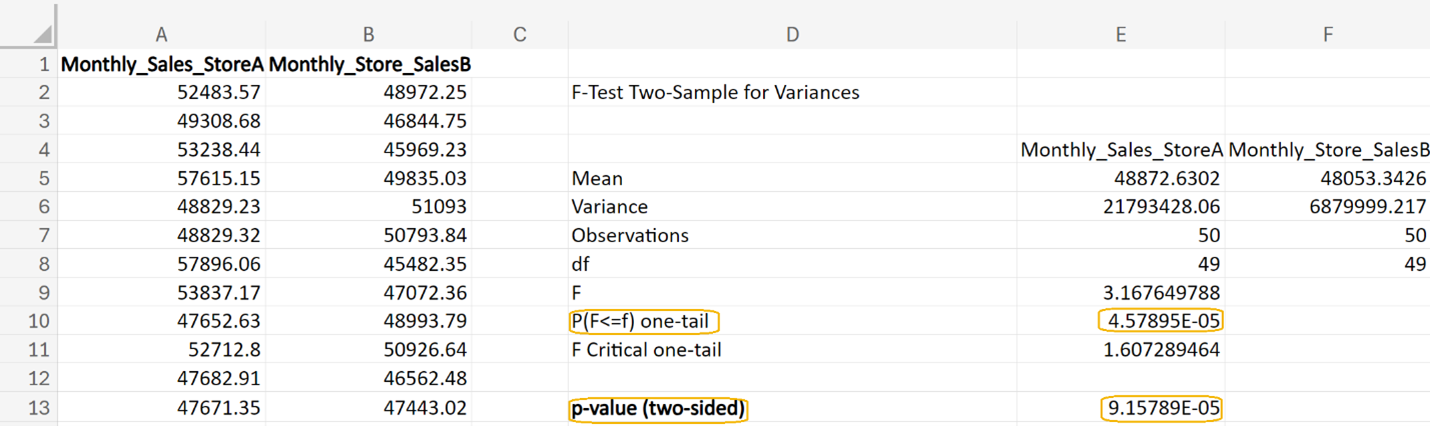
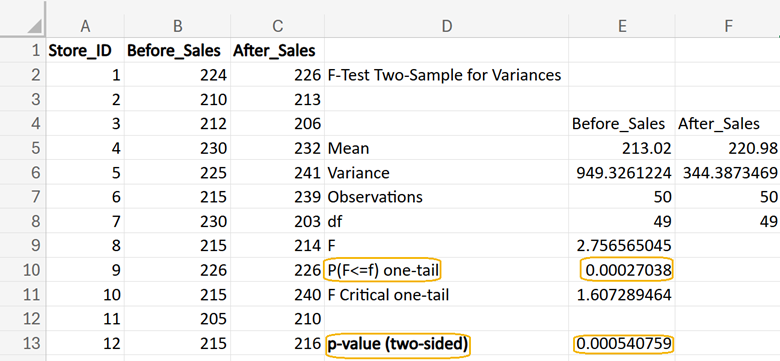
From Excel, you obtain the following output. In cell E13, you can enter =2*E10 to obtain the 2-sided p-value for this test. This p-value (0.0005) is less than the level of significance of 0.05, so you can reject the null hypothesis and conclude that the variances among store sales before and after the implementation of the new marketing strategy are not equal.
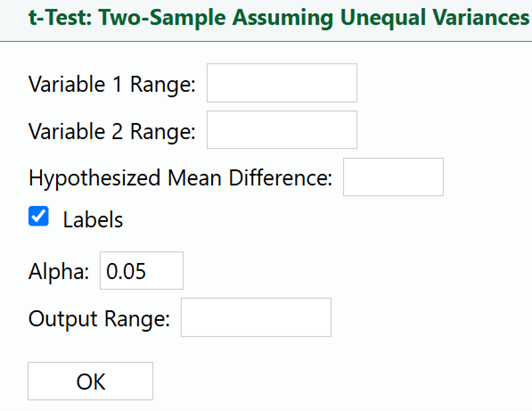
For the two-sample hypothesis test, you will select the
t-Test: Two-Sample Assuming Unequal Variances option in
XL Miner.
Step 5: Perform a Statistical Test
Using the data in the
sales_before_after_marketing_strategy.xlsx Excel file, you will now use the
XL Miner Analysis Toolpak to find the p-value for this two-sample hypothesis test (right-tailed).
1. Select
t-Test: Two-Sample Assuming Unequal Variance in the
XL Miner Analysis Toolpak. The dialog box opens.
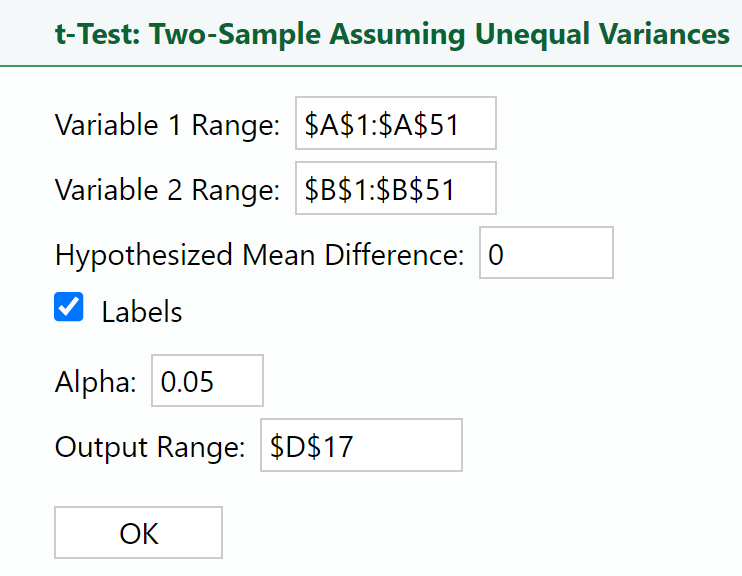
2. Place your cursor in the
Variable 1 Range: box and select the data in column C.
3. Place your cursor in the
Variable 2 Range: box and select the data in column B.
4. Enter 0 in the
Hypothesized Mean Difference: box.
5. Place your cursor in the
Output Range: box, select cell D16 in the Excel worksheet, and select
OK.

Notice in the dialog box above that the column in the
Variable 1 Range specifies the data related to the sales after the marketing strategy was implemented,
After_Sales. The options you select for the
Variable 1 and
Variable 2 boxes in the t-test dialog box are crucial, because they directly determine the direction of your hypothesis test using the directional math operator in your alternative hypothesis.
The alternative hypothesis is:
H₁:
To set this alternative hypothesis up correctly in the t-test dialog box, perform the following:
-
Variable 1 Range: Select the range for After_Sales (cells C2:C51).
-
Variable 2 Range: Select the range for Before_Sales (cells B2:B51).
By correctly setting the Variable 1 and Variable 2 ranges, you ensure that the test is aligned with your alternative hypothesis and that the results will accurately reflect whether the sales after the marketing implementation are significantly greater than the sales before (Wright, n.d.).
The key here is to make sure that whatever group is on the left-hand side of the mathematical operator in the alternative hypothesis is the group that is specified in the
Variable 1 Range box.
The
Hypothesized Mean Difference: option is usually set to 0. This option directly relates to the null hypothesis.
The null hypothesis is:
H₀:
It means we start by assuming there is no difference between the sales before and after the marketing implementation. Another way to specify this is to say that the difference between the means of the two groups is zero. Subtract

from both sides of the equation to obtain H₀:

which we test against the alternative hypothesis that the sales after the marketing implementation are greater than the sales before.
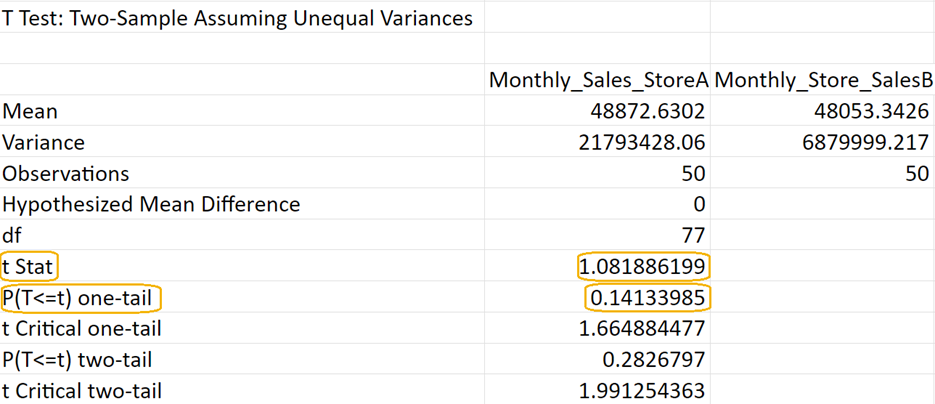
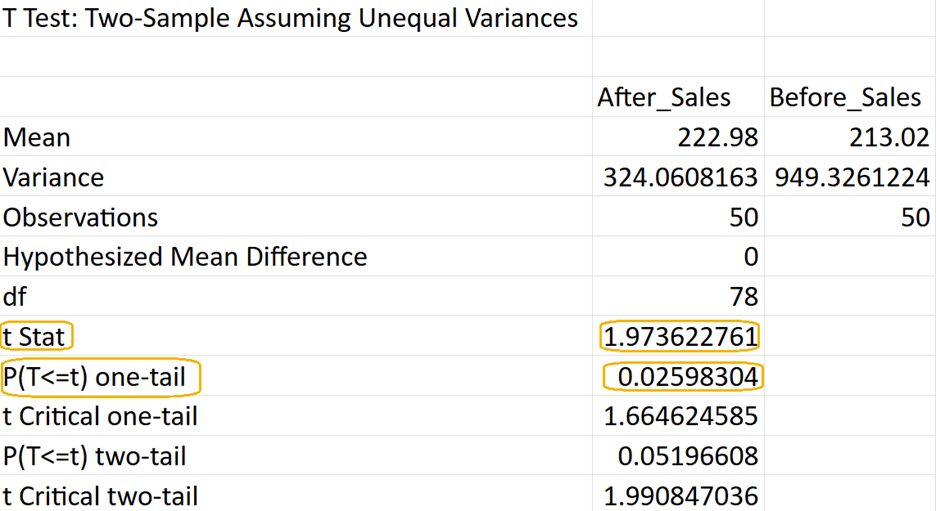
You will obtain the following output in your Excel worksheet. If the test statistic (row labeled
t Stat) is positive, then the row labeled
P(T<=T) one-tail is the right-tailed p-value. The p-value for this two-sample hypothesis test is 0.0259.
Below is a table to help you calculate the p-value for a right-tailed test based on the sign of the test statistic using the
P(T <= t) one-tail output from the
XL Miner Analysis ToolPak (Wright, n.d.):
|
Test Statistic
|
P(T<=t) one tail
|
Right-Tailed p-value Calculation
|
|
Positive
|
p
|
p
|
|
Negative
|
p
|
1-p
|
-
Positive Test Statistic: If the test statistic is positive, the P(T <= t) one-tail value is already the p-value for the right-tailed test.
-
Negative Test Statistic: If the test statistic is negative, you need to subtract the P(T <= t) one-tail value from 1 to get the right-tailed p-value.
Step 6: Make a Decision
Since the p-value

(level of significance), you reject the null hypothesis.
Step 7: Interpret the Results
Since the p-value (0.0259) is less than the significance level (0.05), you reject the null hypothesis. This means that there is sufficient evidence to conclude that the sales after the marketing implementation are significantly greater than the sales before the implementation.
The significant increase in sales after the implementation of the new marketing strategy validates its effectiveness. This suggests that the marketing strategy has positively impacted consumer behavior and sales performance. The marketing team at BrightFutures can be confident in their approach and consider it a successful initiative worth continuing or expanding to all stores.
Demonstrating a successful marketing strategy can strengthen BrightFuture’s position in the market, potentially attracting more customers and increasing market share. Effective marketing can enhance the brand image, making it more appealing to consumers and differentiating it from competitors.
 (mean monthly sales of Store A are equal to the mean monthly sales of Store B)
 (mean monthly sales of Store A are greater than or equal to the mean monthly sales of Store B)
 (variance in monthly sales of Store A is equal to the variance in monthly sales of Store B)
 (variance in monthly sales of Store A is not equal to the variance in monthly sales of Store B)
 so you can reject the null hypothesis and conclude that the variances among the monthly stores of both stores are not equal.