Table of Contents |
Consider the function 
Notice that  is undefined when
  However, we still may want to analyze the behavior of around The mathematical tool used to do this sort of analysis is called a limit.
 means “the limit of as x gets closer to a is equal to L”. In other words, as x gets closer to a, the value of gets closer to L. We call L the limit of the function
To see how this works graphically, shown below is the graph of
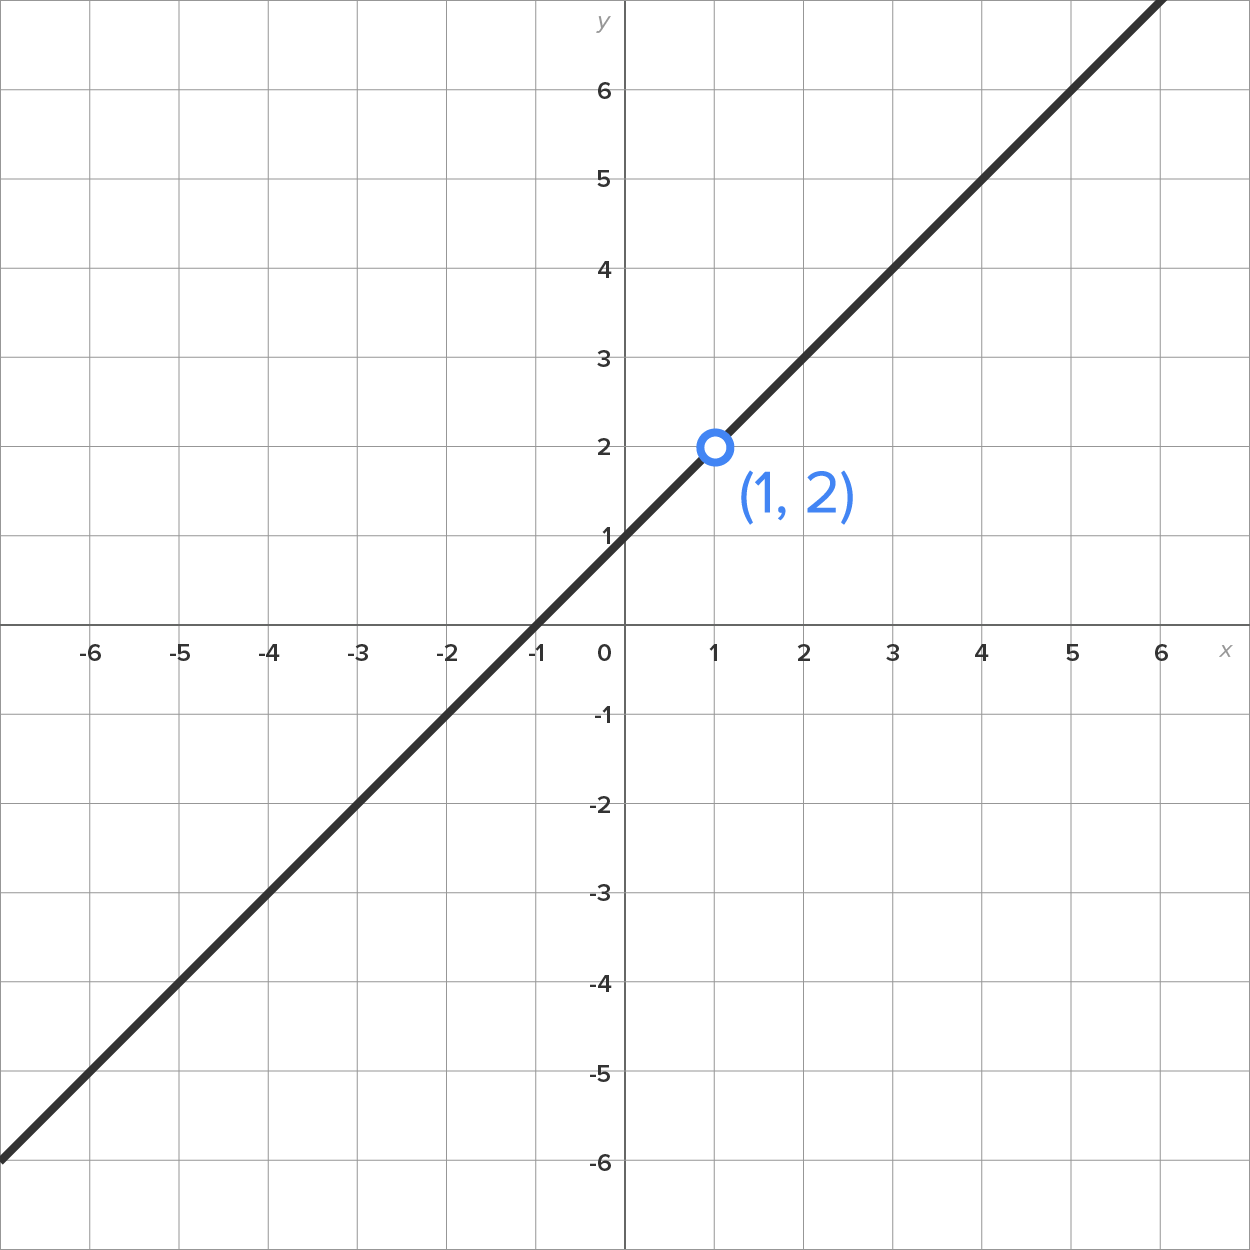
Notice that there is a hole in the graph at the point  indicating that the graph of is a line, but excludes the point
Since is undefined when  we analyze the behavior of by using limits.
That is, we want to evaluate  or more specifically,
By examining the graph, it appears that as x gets closer and closer to 1, gets closer and closer to 2. Thus, we can write 
approaches as x gets closer to a specified number.We can use the information from a graph to evaluate a limit.
EXAMPLE
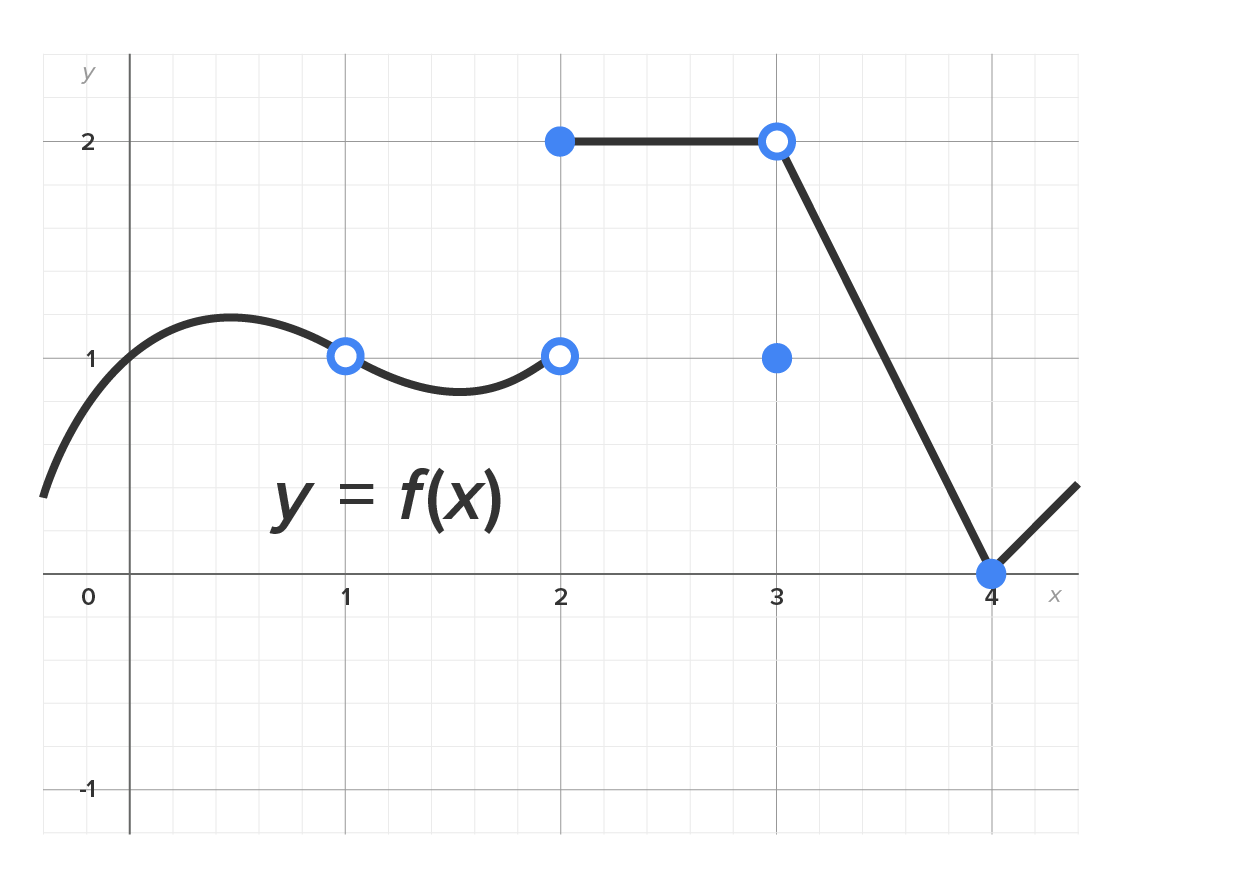
Consider the graph of some function
| Statement | Description |
|---|---|

|
As x gets closer to 0, gets closer to 1.
|

|
As x gets closer to 1, gets closer to 1.
|
 does not exist. does not exist.
|
As x gets closer to 2 from the left (values smaller than 2), gets closer to 1. However, as x gets closer to 2 from the right (values larger than 2), gets closer to 2.
Since approaches two different values, as x approaches 2, we say the limit does not exist.
|

|
As x gets closer to 3, gets closer to 2. Note that the actual value of  is 1 (closed dot at is 1 (closed dot at  ), but the limit tells us what is happening as we get closer and closer to 3, not what is happening right at 3. ), but the limit tells us what is happening as we get closer and closer to 3, not what is happening right at 3.
|

|
As x gets closer to 4, gets closer to 0.
|
approaches as x gets closer to some value. You also learned that you can use the information from a graph to evaluate a limit.
Source: THIS TUTORIAL HAS BEEN ADAPTED FROM CHAPTER 1 OF "CONTEMPORARY CALCULUS" BY DALE HOFFMAN. ACCESS FOR FREE AT WWW.CONTEMPORARYCALCULUS.COM. LICENSE: CREATIVE COMMONS ATTRIBUTION 3.0 UNITED STATES.
The value that a function  approaches as x gets closer to a specified number.


 does not exist