Use Sophia to knock out your gen-ed requirements quickly and affordably. Learn more
×

The Four Types of Analytics

Author: Sophia

what's covered
This tutorial will discuss the four types of analytics by contrasting the following types of analytics:

Table of Contents

before you start
There are four main types of analytics that businesses use to gain insights from data. They range from simple analyses like creating reports to building and using recommendation systems (suggesting the best course of action based on a selection of outcomes). The four types of analytics are paired with the types of questions a business can ask using their data. The figure below illustrates the four types of analytics along with the questions asked at each level.

pyramid with descriptive analytics on the bottom, followed by diagnostic, predictive, and prescriptive analytics at the top. Each level is paired with an example question corresponding to that level.

The four types of analytics are represented in a pyramid to illustrate their relationship to a business’s analytical maturity. The pyramid structure highlights how each level builds upon the one below it. Most businesses begin at the foundational level, using basic analytics to improve data-driven decision-making. As they become more proficient, they can progress to higher levels by asking more complex questions. However, advancing through the pyramid requires a solid foundation—each level must be implemented before moving to the next.

As a business progresses to higher levels of analytics, lower-level methods provide the foundation for more advanced analysis. For example, descriptive analytics, such as calculating an average, often serves as a prerequisite for diagnostic analytics, which seeks to understand why certain patterns or trends occur. Each level builds upon the previous one, ensuring that more complex insights are supported by fundamental analytical techniques.

term to know
Analytical Maturity
A measure of a business's ability to use data effectively.

1. Descriptive Analytics

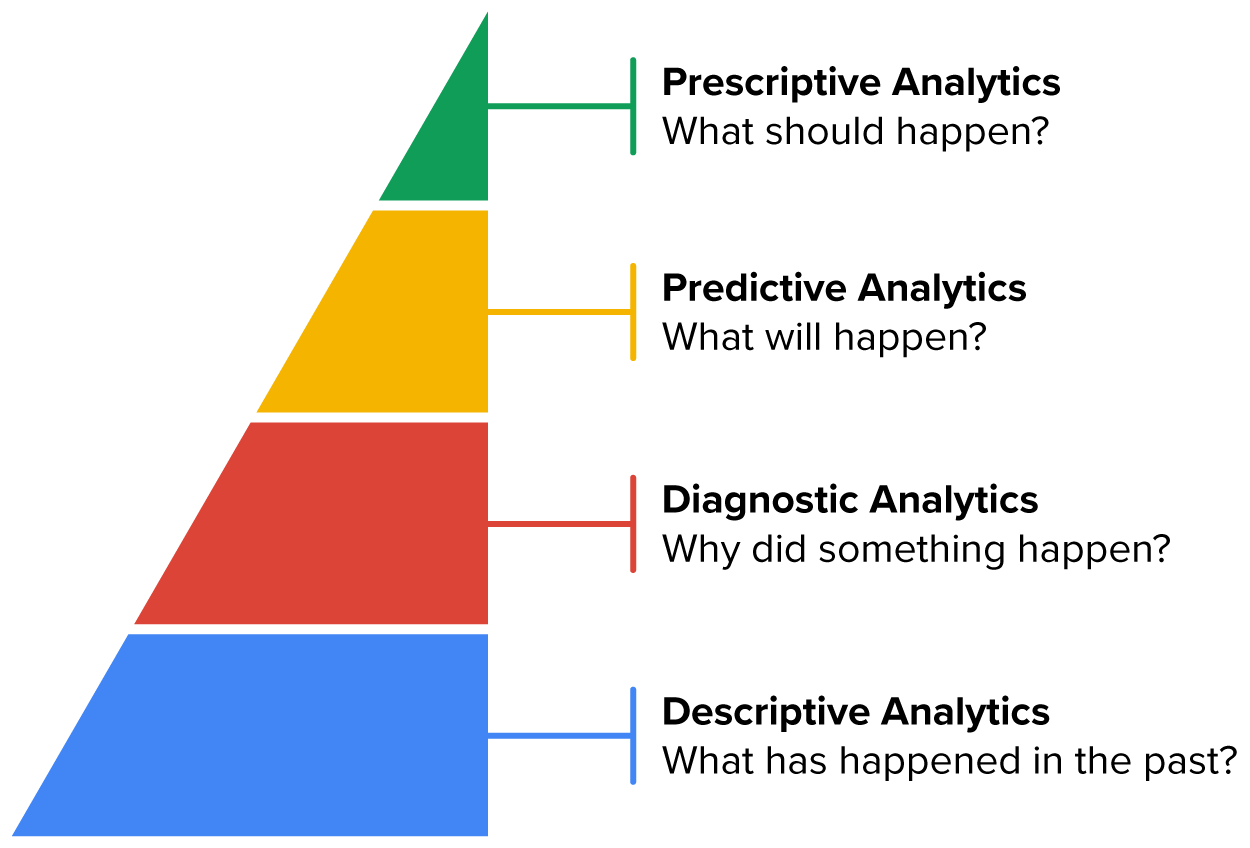
Descriptive analytics focuses on using analytical methods to describe historical data and asks the question, “What has happened in the past?” Businesses use descriptive analytics to understand the story their data is telling them using summary information and visualizations.

Descriptive analytics helps businesses gain insights into patterns, trends, and characteristics of a given data set. Below are some key aspects of descriptive analytics:

Data Exploration:

  • Descriptive analytics begins with exploring the data. This is like detective work for your data, where you uncover the data’s characteristics, patterns, and potential problems.
Measures of Central Tendency:

  • Mean (Average): A health insurance company may calculate the mean age of insured individuals to understand the average age of their customers.
  • Median: A business data analyst determines the median healthcare spending per year to assess insurance needs.
  • Mode: Identifying the most common age group helps tailor health insurance offerings.
Measures of Dispersion (Variability):

  • Range: The range represents the difference between the maximum and minimum values. For health insurance, understanding the range of individual health costs helps assess the potential financial risk. For example, if the costs for treating diabetes range from $30,000 to $500,000, the range informs insurers about the extreme possibilities.
  • Variance: A measure of how much the data points deviate from the mean.
  • Standard Deviation: The square root of the variance, providing a more interpretable measure of spread. Assume the mean cost of treating diabetes is $120,000. If the standard deviation of the cost of treating diabetes is $325,000, which is much higher than the mean, insurers recognize the significant variability.
Data Visualization:

  • Visual analysis helps you see trends, patterns, and outliers. Sometimes large data sets are hard to understand with numbers alone, so creating visual representations like graphs, charts, and plots gives you the bigger picture of your data.
Summary Measures:

  • Examples of these measures would be the minimum and maximum value. Percentiles are also a summary measure. A percentile measures the relative position of a data value within a dataset.

EXAMPLE

Suppose you are working as a business data analyst in a company based in La Crosse, Wisconsin. Your annual salary is $93,000 per year. Your Human Resources Department has conducted a market research salary analysis, and they tell you that your salary is in the 90th percentile for individuals living in La Crosse. This summary measure tells you that you earn more than 90% of individuals in La Crosse. Only 10% of the population in La Crosse has a salary greater than yours. It pays to be a business data analyst!

term to know
Descriptive Analytics
Summarizing and visualizing data to make it easier to understand.


2. Diagnostic Analytics

Diagnostic analytics is the next type of analytics that naturally follows descriptive analytics. Whereas descriptive analytics asks the question, “What has happened in the past?” diagnostic analytics asks the question, “Why did this happen?” Diagnostic analytics focuses on understanding the reasons behind the observed patterns or events. It’s like peeling back the layers to uncover the “why” behind data patterns. Businesses can make data-driven decisions and take corrective actions by asking questions such as “Why did the stock price increase?” or “What caused the sudden decrease in new customers?” Below are some key aspects of diagnostic analysis:

  • Hypothesis Testing: A statistical process that is used to determine why something has happened or might happen under certain circumstances.
IN CONTEXT
Scenario: Is a new GPS feature increasing sales?

A telecommunications company wants to determine whether launching a new GPS feature in customers' smartphones has led to increased sales. The company collects sales data from before and after the new feature launch. A hypothesis test will compare the mean sales before and after the feature launch and inform the company whether the new GPS feature had an impact on increased sales or not. By conducting a hypothesis test, the telecommunications company can make an informed decision about whether to invest more resources in promoting the new GPS feature.

  • Correlation Analysis: A methodology to determine if two (or more) variables are related to each other. Correlation analysis examines if changes in one variable are associated with changes in another.
IN CONTEXT
Scenario: Identifying Relationships

You are a business data analyst for a large outdoor retail company. You periodically perform correlation analyses for the sales of different products. The correlation analysis shows there is a strong positive correlation between tents and camping gear. A positive correlation means that when the sales of tents are increasing so are the sales of camping gear (and vice versa). The manager of the store applies the results of your correlation analysis by offering customers a “camping starter kit.” This kit includes a tent and a sleeping bag. A portable stove is bundled into the kit free of charge.

Correlation does not imply causation. You cannot interpret the results of the correlation analysis to claim that the increase in tent sales is causing the increase in camping gear (or vice versa). The correlation analysis shows an association between the sales of the two items.

term to know
Diagnostic Analytics
Identifying patterns and relationships within the data to explain why certain events occurred.


3. Predictive Analytics

Once a business has applied descriptive and diagnostic analytics to address the “what” and “why” of some phenomena occurring, the next step is to ask, “What will happen in the future?” Using analytical methods to predict outcomes, trends, or events using historical data is the focus of predictive analytics. Historical data provides the foundation for predicting future events. Historical data is data that the business has collected in the past. A healthcare organization can examine past patient usage of healthcare clinic services to predict future staffing needs for the clinic.

The main analytical tool used in predictive analytics is a predictive model. A predictive model is the means that data analysts use to quantify the relationship between the variables in a historical data set. The model is used to develop the predicted future outcomes or events.

Below are some application areas of predictive analytics:

  • Retail: By analyzing past purchasing patterns of customers, retailers can predict demand for certain products, the amount of inventory needed, and recommend products that customers are likely to buy. The predictions of what customers will buy allow retailers to target their dollars to specific product marketing campaigns.
  • Insurance: Insurance companies predict who will crash a car or hurt themselves in some way (ski accident, boating incident, slip and fall mishap, etc...). Predicting the types of claims customers will file is crucial for an insurance company. The claim predictions allow the insurers to allocate sufficient funds to cover expected payouts.
  • Banking: Predictive models identify fraudulent activity and suspicious transactions. Banks use predictive models to determine which customers should receive a financial loan or not. Predictive analytics enables banks to anticipate customer needs and identify upselling opportunities based on past product usage.
  • Human Resources: Many companies use predictive analytics to predict if an employee is going to quit, enabling proactive measures to be put in place and retain valuable employees. Data collected on past employee satisfaction surveys, performance reviews, and tenure all assist in predicting employee attrition.
  • Healthcare: Hospitals can use predictive analytics to predict hospital admissions. These predictions can assist the hospital in planning effective resource allocation such as the number of beds needed, efficiently scheduling surgeries, and ensuring all necessary equipment is available.
  • Supply Chain: Companies like FedEx and UPS use predictive analytics to make their supply chain operations more efficient. For example, data from real-time traffic updates, information on road closures, and past package delivery times can be used to predict the shortest delivery driver routes, thus decreasing the package delivery time for the customer.
terms to know
Predictive Analytics
The process of analyzing past data with statistical and machine learning techniques to identify patterns and make informed predictions about future outcomes.
Predictive Model
A concise representation of the relationship among the variables in a historical data set.
Upselling
A sales technique in which encouragement is provided to customers who are buying a certain product to upgrade the product.
Employee Attrition
The loss of an employee due to retirement, termination, a life event, elimination of a position, or voluntary resignation.


4. Prescriptive Analytics

Prescriptive analytics asks the question, “What should happen?” While the purpose of descriptive, diagnostic, and predictive analytics is to tell you what happened, why it happened, and what may happen in the future, the purpose of prescriptive analytics is to tell you what should happen. Given a set of outcomes from different scenarios, prescriptive analytics provides a recommendation to the business as to which scenario is the best one. These scenarios could predict future performance generated by the methods of predictive analytics. Prescriptive analytics provides an optimal course of action to be selected.

In practice, prescriptive analytics can continually and automatically process new data to improve the accuracy of predictions and provide better decision options. All that data being amassed by businesses can be used to predict what’s going to happen next, and most importantly, prescribe the proper course of action a business should take to ensure success.

IN CONTEXT
Scenario: Healthcare Prescriptions

You work as a data analyst for a large healthcare system. The organization is considering purchasing a product known as Sydney. Sydney is a healthcare recommender system. A healthcare recommender system is a type of prescriptive analytics method that makes personalized healthcare recommendations to patients. Sydney is going to cost several million dollars, so the healthcare organization wants you to assist them in vetting the product and producing a report on your findings.

Sydney works by the doctor and patient providing symptoms using their natural way of speaking and writing. Sydney uses the data entered and begins to work! Sydney starts churning through the patient’s medical history, current and past medication information, results of past medical procedures, nurses' and doctors' notes, treatment guidelines, clinical studies, and published research. Sydney then takes this mountain of data and formulates hypotheses about certain diagnoses. Sydney predicts which diagnoses are most likely suitable for the patient, and then returns a suggestion for potential diagnoses, with test and treatment options. For each suggestion, a certainty measure is provided. That is, how confident Sydney is about each suggested diagnosis.


You will be part of a pilot team that will be evaluating Sydney. There will be a trial period in which doctors and nurses will use Sydney in their clinical practice and report on how Sydney performs. During this trial period, data will be collected from the patients, doctors, nurses, and other related hospital staff regarding their experience using Sydney. Some example data points collected will be: the amount of time Sydney saved the medical professional; did Sydney return a diagnosis the doctor or nurse did not consider; was the recommendation from Sydney an accurate and correct diagnosis; were alternate treatment plans carried out due to Sydney’s recommendations.

Healthcare administration and management individuals will also be part of the pilot team so that budgets and resources can be considered as a part of the decision.

Once the trial period is over, you will use the data collected from patients and medical professionals during the trial period to generate a report for the Director of Analytics including the following:
  • Cost-Benefit Considerations: Evaluate the return on investment (ROI) by providing an analysis of improved patient care and outcomes, time saved for the medical professionals, and a reduction in trial-and-error treatment approaches realized. The healthcare system will incur a substantial multi-million-dollar cost for Sydney. Your job is to use the data collected from the trial period to inform management if the benefits of Sydney will outweigh the costs or not.
  • Challenges and Considerations: Provide a suggestion for how well you think Sydney will integrate into the healthcare system’s current data collection and management systems. The success of Sydney depends not only on its technical capabilities but also on its seamless integration into the healthcare workflow.
  • Transparency Recommendation: Is the methodology incorporated into Sydney transparent? That is, do you understand how Sydney’s algorithms are working, and do they align with medical best practices?
  • Patient Privacy Concerns: Can the healthcare system keep patient data private and secure if Sydney is purchased?

terms to know
Prescriptive Analytics
Uses advanced models, algorithms, and optimization techniques to recommend the best course of action among various options, enabling data-driven decision-making.
Recommender Systems
A prescriptive analytical technique that provides product recommendations to users based on their history and preferences.

summary
In this lesson, you learned about the four types of analytics and the questions asked by each. Descriptive analytics summarizes historical data to understand what has happened. Building on this, diagnostic analytics investigates why certain events or patterns occurred. Predictive analytics then uses this historical data to forecast future events. Finally, Prescriptive analytics recommends actions based on predictive models to achieve desired outcomes. Together, these types of analytics provide a comprehensive approach to understanding and leveraging data.

Source: THIS TUTORIAL WAS AUTHORED BY SOPHIA LEARNING. PLEASE SEE OUR TERMS OF USE.

Terms to Know
Analytical Maturity

A measure of a business's ability to use data effectively.

Descriptive Analytics

Summarizing and visualizing data to make it easier to understand.

Diagnostic Analytics

Identifying patterns and relationships within the data to explain why certain events occurred.

Employee Attrition

The loss of an employee due to retirement, termination, a life event, elimination of a position, or voluntary resignation.

Predictive Analytics

The process of analyzing past data with statistical and machine learning techniques to identify patterns and make informed predictions about future outcomes.

Predictive Model

A concise representation of the relationship among the variables in a historical data set.

Prescriptive Analytics

Uses advanced models, algorithms, and optimization techniques to recommend the best course of action among various options, enabling data-driven decision-making.

Recommender Systems

A prescriptive analytical technique that provides product recommendations to users based on their history and preferences.

Upselling

A sales technique in which encouragement is provided to customers who are buying a certain product to upgrade the product.