Table of Contents |
The Canvas element is an HTML element that allows us to use JavaScript to draw graphics onto the canvas itself. While the canvas element is placed using HTML, we strictly use JavaScript to get a handle on the canvas, access the canvas drawing methods, and create graphic elements.
At first glance, it may appear like Canvas and SVG elements are the same. However, they are indeed very different, not just in their implementation but also in how they perform. SVGs provide ease of use over Canvas, as they use HTML tags to create the graphic elements. Canvas requires the use of JavaScript.
Canvas, however, provides finer controls over the graphic elements, as well as better performance when it comes to complex objects. The trade-off with canvas, aside from requiring JavaScript programming skills, is that canvas objects do not perform well with larger resolutions but do perform better with complex objects containing a lot of individual graphic elements. Also, canvas graphic elements cannot be manipulated individually without redrawing the entire canvas. Finally, canvas elements are not stand-alone and must be rendered within a browser that supports JavaScript. SVG images can be extracted as code and saved as individual .svg files.
EXAMPLE
To get started with a canvas element, you need to first create a <canvas> element on the page, give it an id attribute and value, and set its height and width.<canvas id="myCanvas" width="300" height="150"
style="border:1px solid gray"></canvas>
EXAMPLE
Then, using JavaScript, we get a handle to the canvas using the following:const myCanvas = document.getElementById("myCanvas");
const ctx = myCanvas.getContext("2d");
At this point, the ctx object is the context object that we need to begin issuing commands to the canvas.
Canvas Element
An HTML element that uses JavaScript to draw graphics onto the canvas itself.
When using JavaScript to draw graphic elements onto a canvas, the same coordinate system applies for positioning. However, when it comes to configuring an individual element’s properties, such as fill color, stroke color, and stroke thickness, these changes are applied to the canvas context object itself before drawing the element to the screen.
EXAMPLE
Before we draw any shape and after we have received a context object from the canvas element, we need to call the beginPath() function. This function clears out any settings and paths from previous commands and prepares the context object to draw a completely new shape or path.<canvas id="myCanvas" width="300" height="150" style="border:1px solid gray"></canvas>
<script>
const myCanvas = document.getElementById("myCanvas");
const ctx = myCanvas.getContext("2d");
ctx.beginPath(); //Prepare ctx to draw a new path.
</script>
Now, if we wanted to draw a rectangle, we could use three context functions:
fillRect(x, y, width, height) strokeRect(x, y, width, height) clearRect(x, y, width, height) One thing to keep in mind about a stroke’s thickness is that the thickness of the stroke is centered on the path of the shape. Thus, if your stroke is 6 pixels wide, 3 pixels will be outside of the shape, and 3 pixels will be inside (or 3 on the left and 3 on the right). Furthermore, by changing the order of the calls to fill() and stroke(), you can actually place the fill on top of the stroke, thus only leaving the outer 3 pixels of the stroke.
EXAMPLE
Let us draw a red rectangle with a 6-pixel-wide yellow stroke:
<body>
<canvas height="200" width="300" id="canvas" style="border: 1px solid black;"></canvas>

<script>
  const canvas = document.getElementById("canvas");
  const ctx = canvas.getContext("2d");

    ctx.beginPath();  //Prepare ctx to draw a new path.
    ctx.fillStyle = "red";
    ctx.strokeStyle = "yellow";
    ctx.lineWidth = 6;
    ctx.fillRect(10, 10, 100, 100);
    ctx.strokeRect(10, 10, 100, 100);
</script>

</body>
We would first set the context’s fillStyle attribute with a color value of red. Then, we can call fillRect(x, y, width, height) to draw the red rectangle on the canvas. To draw an outline of the rectangle, we would set the context’s strokeStyle attribute with a color and then call the strokeRect(x, y, width, height) function. Since we wanted a filled, stroked rectangle, we needed to prepare and call both fillRect() and strokeRect().
Rectangles use the above process and are fairly straightforward. However, other types of graphic elements can be created using what is called a path. Paths are lines that are defined using coordinates and mathematical methods to draw lines, arcs, and Bezier curves.
First, let us talk about the manipulation of a path to draw lines, paths, or other shapes on the canvas. Think of drawing paths as specifying the tip of an ink pen. Before we begin drawing, we need to position the pen somewhere on the canvas as a starting point. We do this using the moveTo(x, y) function. Next, we can tell JavaScript to begin drawing a line from the starting point to the endpoint of the line. To make a straight line, we will use lineTo(x, y) and provide the x and y coordinates of where the end of the line should be. The pen, now touching the canvas, is moving and drawing a line.
To make a curved line, we have a couple of options. If the curve is to be a perfect curve (as in, part of a circle or a full circle), we will use the arcTo() function. An arc is drawn using the context’s arc(x1, y1, x2, y2, radius) function. x1 and y1 are the starting point coordinates of the arc, and if these do not match the previous location of the pen, that is, the moveTo() function, then the arc will be connected to the path with a single straight line.
Circles can be drawn on their own using the context’s arc(x, y, radius, startingAngle, endAngle, clockwise) function. For unusually shaped curves, we would need to use a Bezier or quadratic curve. Quadratic curves use the quadraticCurveTo(cp1x, cp1y, x, y) function, which takes the x and y coordinates of where the end of the curve will be and the two control points, cp1x and cp1y. The control point is the mechanism that manipulates the curve. Bezier curves can be created using the bezierCurveTo(cp1x, cp1y, cp2x, cp2y, x, y) function. In this case, we have the same endpoint x and y coordinates, but now we have two control points. As you can see from the illustration below, you can create different curves by manipulating the location of the control points in relation to the start and endpoints of the path.

Keep in mind that paths do not create visible content themselves. Instead, the path is configured to the desired shape using the context’s methods, and then the path can be stroked using the stroke() function. Now we can see the arc. Paths can also be filled using the fill() function, which will close any gap in the path using a straight line, and everything within the boundary of the path will be filled with the fillStyle color.
Path
A line that is defined using coordinates and mathematical methods to draw straight lines, arcs, and Bezier curves.
Gradients are a method of coloring an element on the screen wherein the fill actually changes from one color to another. Gradients can be linear, like the sky during a sunset; radial, like looking at a bright light in the fog; or conical, like staring down at a pyramid during a sunset. Gradients use a minimum of two colors but can include multiple colors. We can even change the opacity of each color.
The first step in applying a gradient color is to create a CanvasGradient object using one of the following methods:
createLinearGradient( x0, y0, x1, y1 ) createRadialGradient( x0, y0, r0, x1, y1, r1 ) createConicGradient( startAngle, x, y )Once we have the CanvasGradient object, we can add color stops to the object to define the colors and their positions in the gradient lineup. A color stop is a point in the gradient where we assign a specific color. To do this, we use the CanvasGradient’s addColorStop(offset, color) function. The offset is the color’s position in the gradient and is a value between 0 and 1, 0 being the beginning, 1 being the end, and any decimal in between. So, if you wanted to add a color in the middle of the gradient, you would give it an offset of 0.5. The color argument can be any valid CSS color value, including eight- and 10-digit hex, rgb(), and rgba().
After adding the colors to the CanvasGradient object, it can then be applied to the context’s fillStyle or strokeStyle attributes.
EXAMPLE
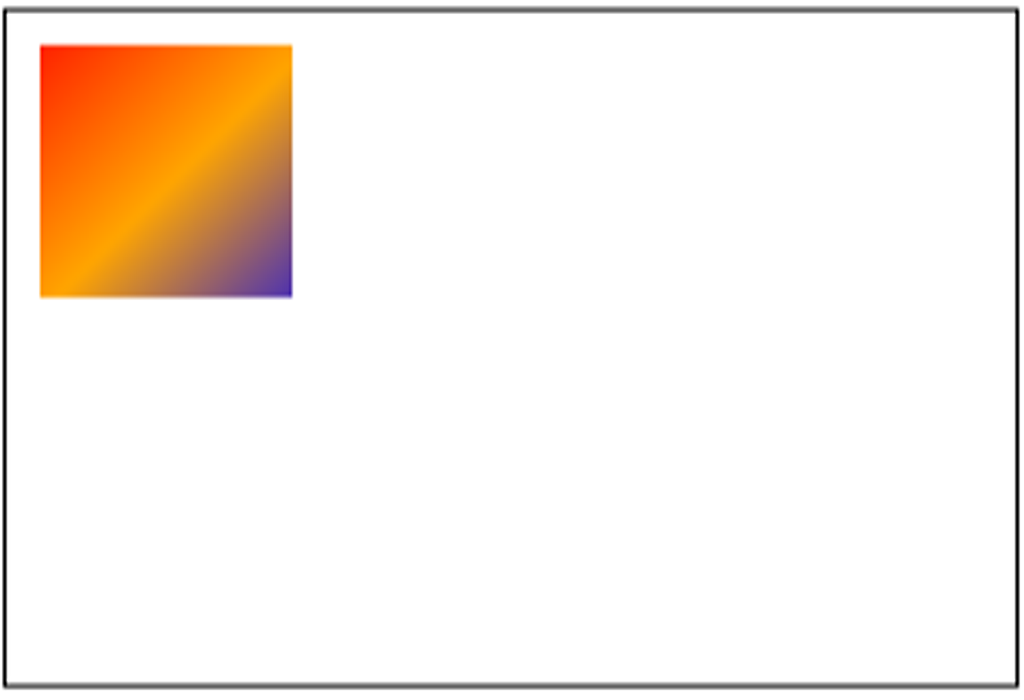
Let us create a linear gradient with three color stops and position its coordinates so that the gradient transitions at a 45° angle. We will then apply it to the fillStyle and draw a rectangle.
<canvas id="myCanvas" width="300" height="150"></canvas>

<script>
const myCanvas = document.getElementById("myCanvas");
const ctx = myCanvas.getContext("2d");

let gradient = ctx.createLinearGradient( 0, 0, 100, 100 );
gradient.addColorStop( 0, "red" );
gradient.addColorStop( 0.5, "orange" );
gradient.addColorStop( 1, "blue" );
ctx.fillStyle = gradient;
ctx.fillRect( 10, 10, 75, 75 );
</script>
As a result, we get something like the sample image below:
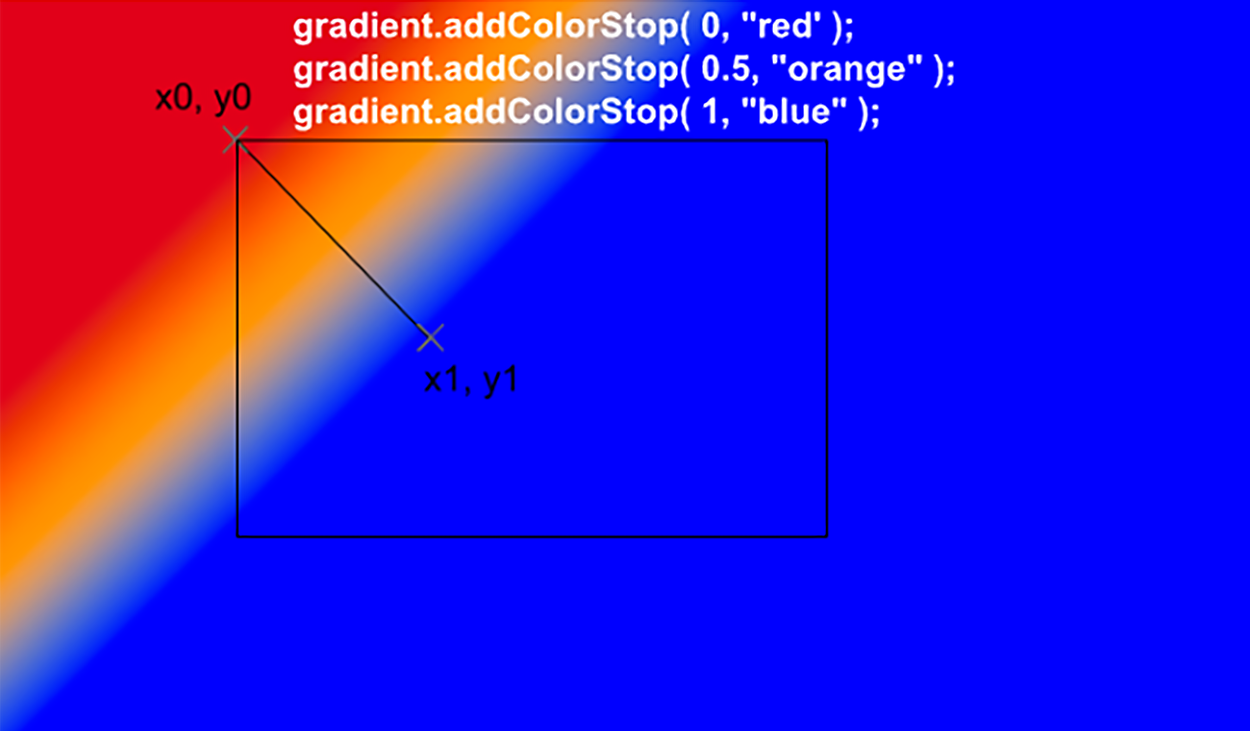
Let us take a closer look to see exactly what is happening. First, we created a linear CanvasGradient object and set the coordinates to the top-left corner and angled the end down and to the right by 100 pixels. You can see the defined coordinates in the illustration below (this is just a conceptual illustration; nothing would be visible at this point):

Then, we added the color stops to the gradient object. Note that the following image shows conceptually what is happening. While nothing is visible at this point, the following image represents what the gradient represents in the memory and what color a shape would be given if the shape were positioned in different places.
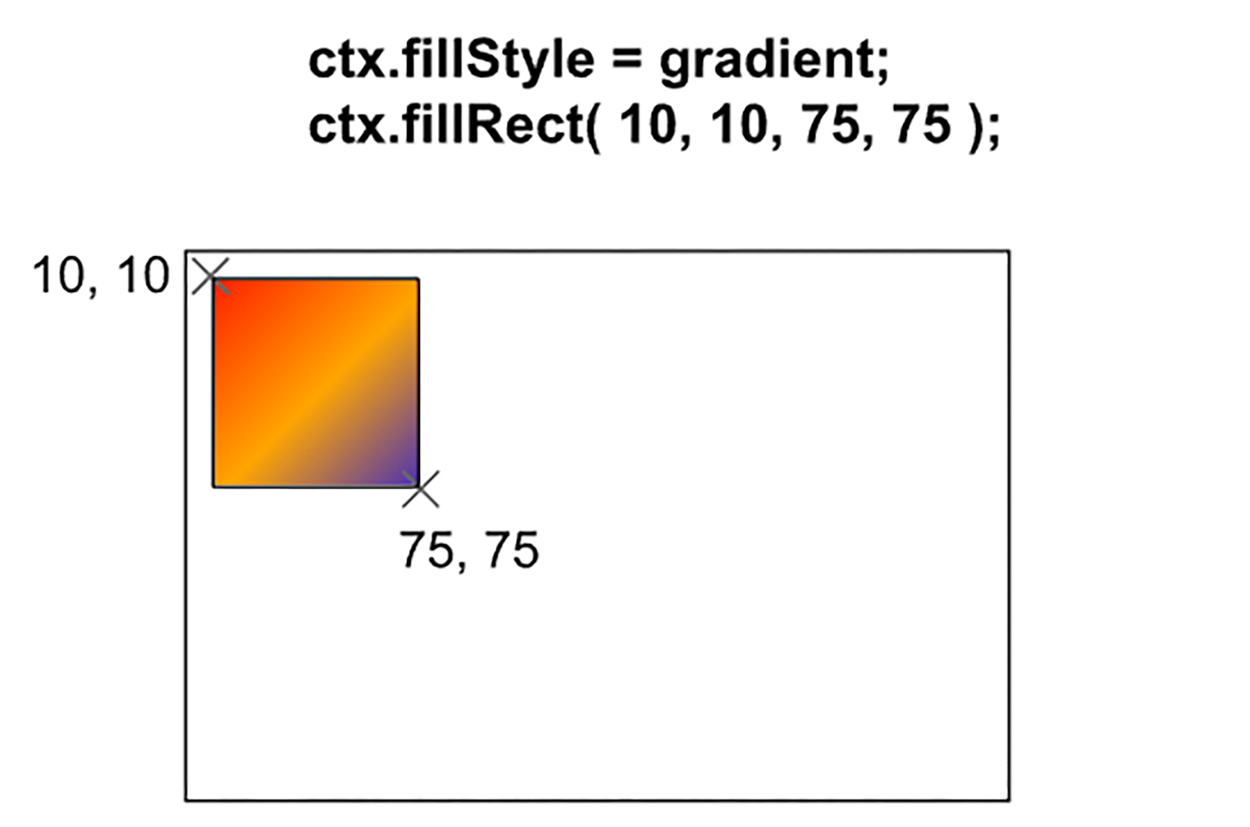
Next, after defining the color stops, we are ready to apply the gradient as the fillStyle and draw our rectangle. We assigned the gradient object to the fillStyle attribute and draw the filled rectangle:
Gradient
A method of coloring an element on the screen wherein the fill changes from one color to another.
Color Stop
A defined color for a color gradient that also specifies the location of the color in the gradient as a value between 0.0 and 1.0.
Source: This Tutorial has been adapted from "The Missing Link: An Introduction to Web Development and Programming " by Michael Mendez. Access for free at https://open.umn.edu/opentextbooks/textbooks/the-missing-link-an-introduction-to-web-development-and-programming. License: Creative Commons attribution: CC BY-NC-SA.