Table of Contents |
A system of nonlinear equations contains at least one equation that is not linear.
For example, the system  is a system of nonlinear equations since the equation
  is not linear.
The key methods used to solve a system of nonlinear equations are substitution or elimination.
EXAMPLE
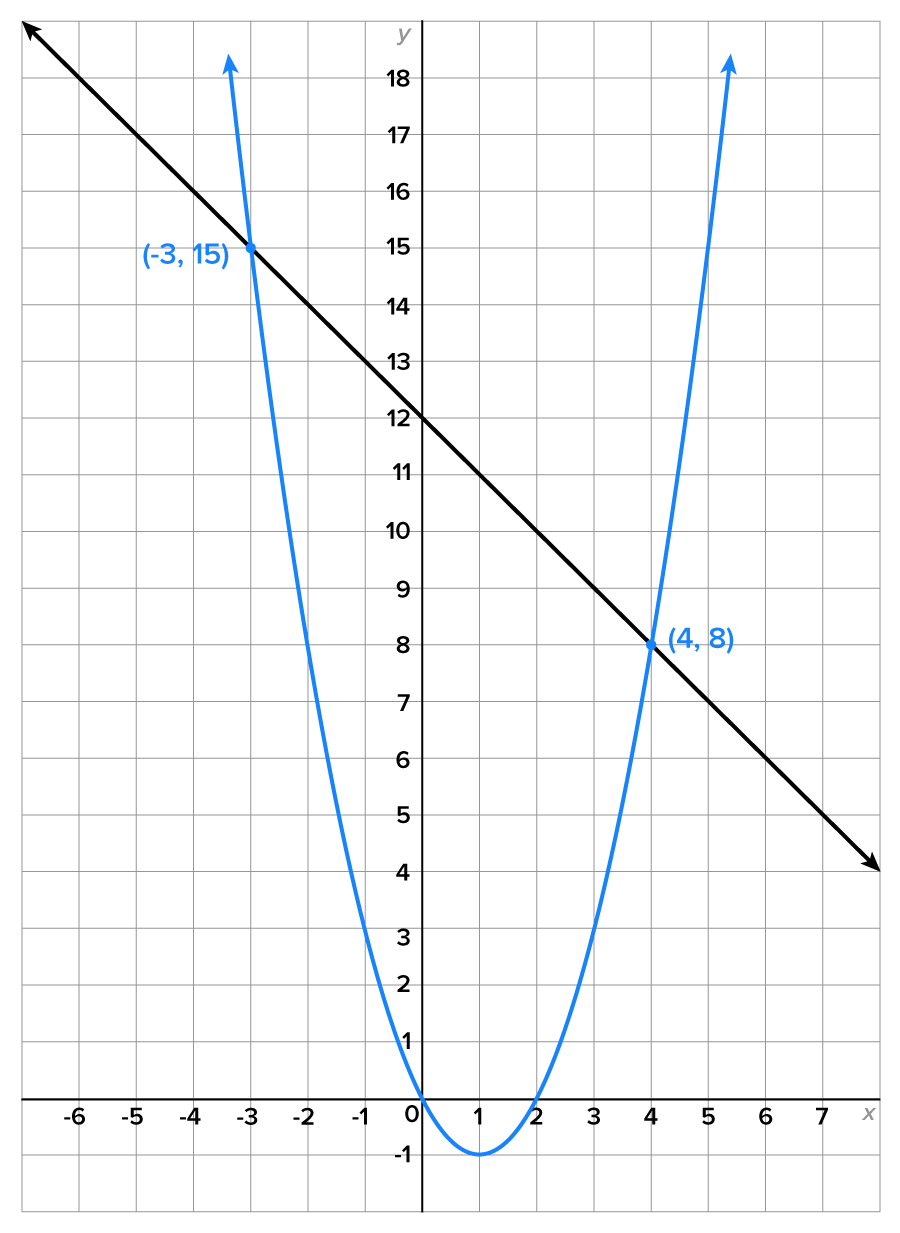
Consider this system:
|
|
This is the system we wish to solve. |

|
Replace y with  in the first equation, which results in an equation with one variable. in the first equation, which results in an equation with one variable.
|

|
Combine like terms on the left side. |

|
Subtract 12 from both sides. |

|
Factor. |

|
Set each factor equal to 0 and solve. |
  
|
Choose an equation containing both x and y, substitute  then solve for y. This means that then solve for y. This means that  is one solution. is one solution.
|
 
|
Choose an equation containing both x and y, substitute  then solve for y. This means that then solve for y. This means that  is another solution. is another solution.
|
and 
 and the graph of the parabola is


|
Substitute  into the second equation. into the second equation.
|

|
This is a quadratic equation, so rewrite so that one side is 0. |

|
Factor the quadratic expression. |

|
Set each factor equal to 0 and solve. |

 then
then  This means one solution is
 then
then  This means the other solution is
 and
and
EXAMPLE
Consider the system:

|
|
This is the system we wish to solve. |

|
Substitute
|

|
Expand the square of the binomial. |

|
Distribute on the left side. |

|
Simplify the left side. |

|
Subtract 19 from both sides. |

|
Factoring looks difficult, so use the quadratic formula, 
|

|
Simplify each term. |

|
Simplify the radical. |

|
This is the solution when the second term is added. |

|
This is the solution when the second term is subtracted. |

 One solution is

 This means the other solution is
 and
and
 and the ellipse
  intersect by solving a system of equations.

 or
or  This system can be solved using elimination.

|
Multiply the second equation by -2. |

|
Add the equations together. |

|
Solve for x by applying the square root principle. |
 is simpler, we’ll use this one.


 and
and 


 and
and 


 and
and
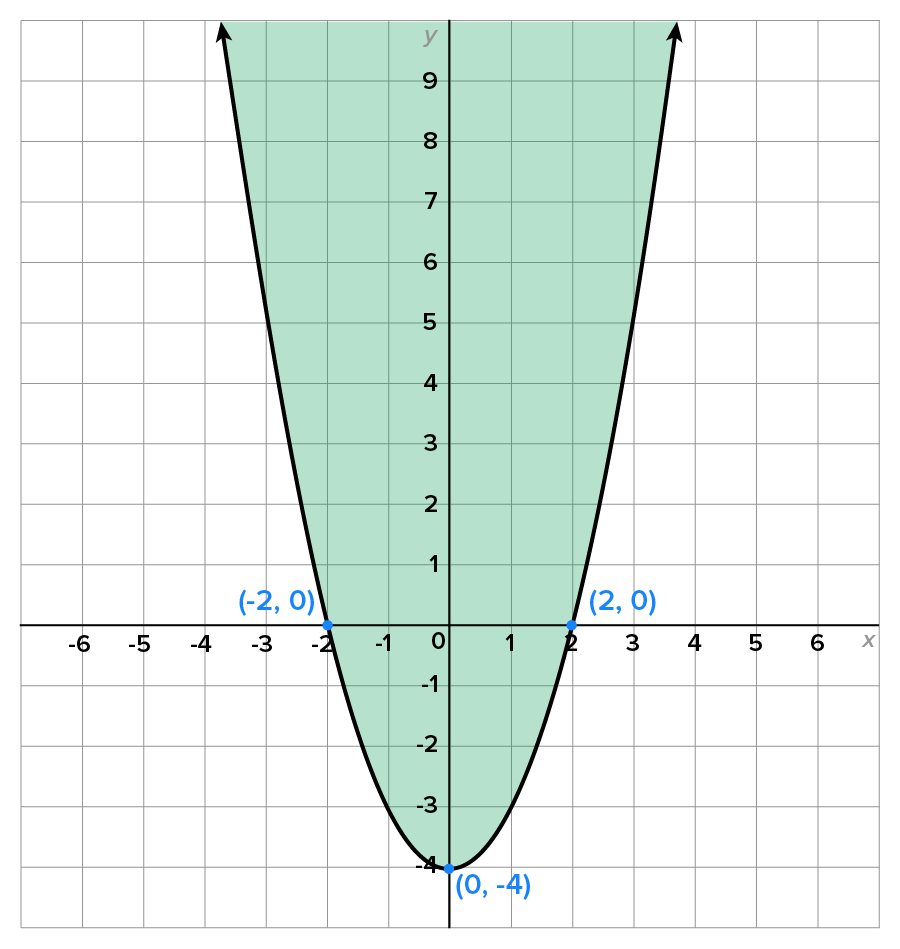
Consider the equation  whose graph is shown below.
Remember that the graph of the equation is the visual representation of all solutions to the equation.
Using this idea, how would we represent the solutions to the inequality 
To start, we use the equation  as a reference.
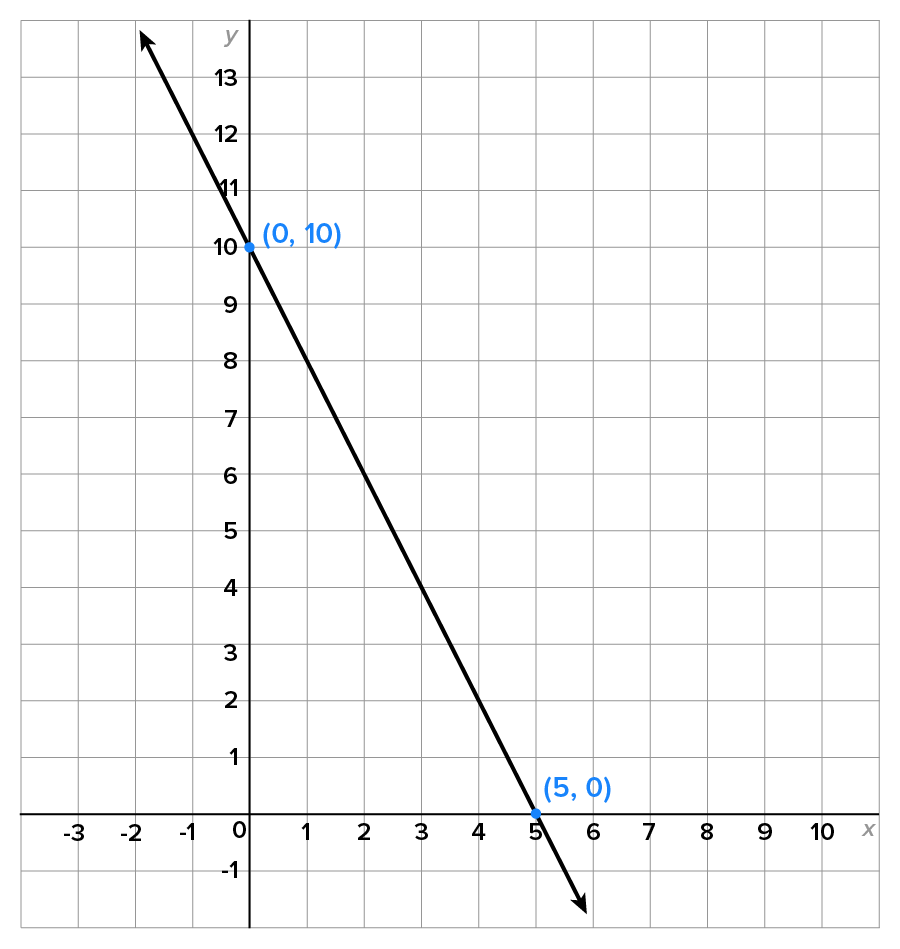
Consider the point  which is on the line
Now, consider the points  and
and  Are they solutions to
| Point |
Substitute Into 
|
Solution? |
|---|---|---|
|
|
 
|
Yes |

|
 
|
No |
 and the fact that the point
  is on the line.
 does not satisfy the inequality.
 does satisfy the inequality.
Based on these results, it stands to reason that any point on or below the line is a solution to the inequality 
To express the solution set, the portion of the plane that satisfies the inequality is shaded, much like we shade a number line to describe the solution set for an inequality with one variable.
The solution to  is shown below, with some solution and non-solution points shown.
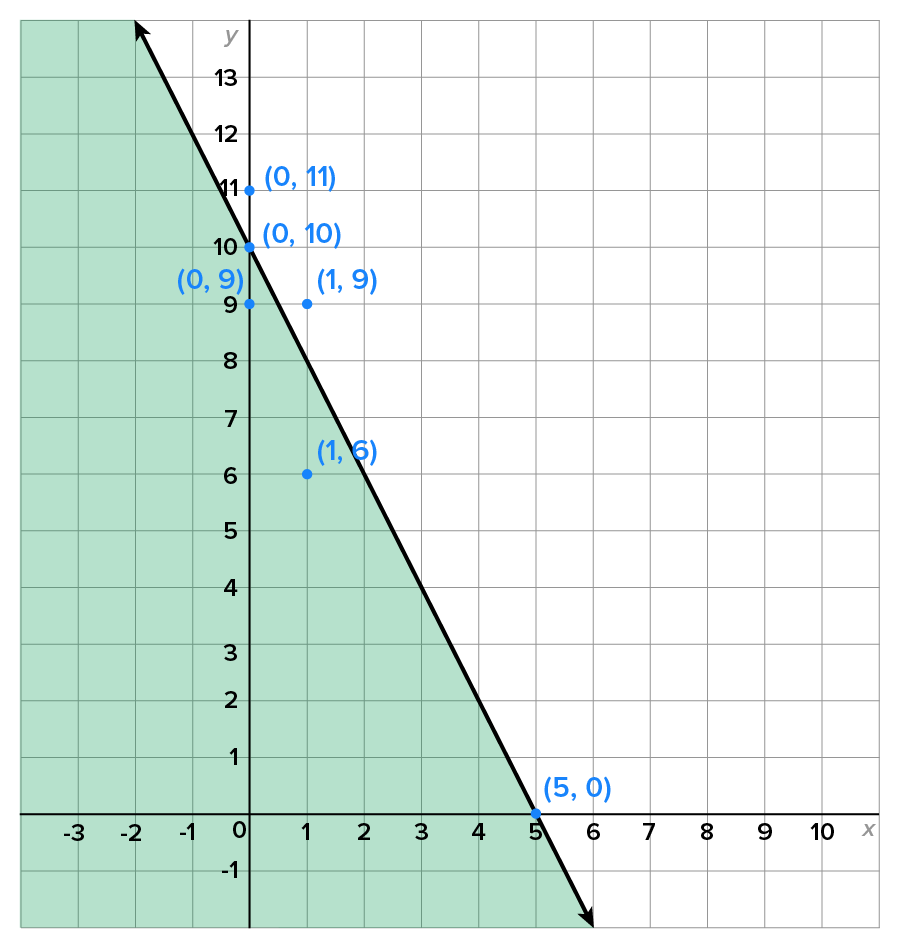
The line is solid since the points on the line are also solutions. When the points on the graph are not solutions, the line would be represented by a dashed line rather than a solid line.
In general, the solution set to an inequality depends on the direction of the inequality and whether or not equality is allowed. Given a function  we have the following:
| Inequality | Description of Solution Set |
|---|---|

|
All points below or on the graph of  The graph of  is expressed by a solid line or curve. is expressed by a solid line or curve.
|

|
All points below the graph of The graph of is expressed by a dashed line or curve.
|

|
All points above or on the graph of The graph of is expressed by a solid line or curve.
|

|
All points above the graph of The graph of is expressed by a dashed line or curve.
|
EXAMPLE
Consider the inequality

|
This is the original inequality. |

|
Subtract  from both sides. from both sides.
|

|
Divide both sides by 3. |

|
Write each term with a denominator of 3, then simplify. |
 which has slope
  and y-intercept at
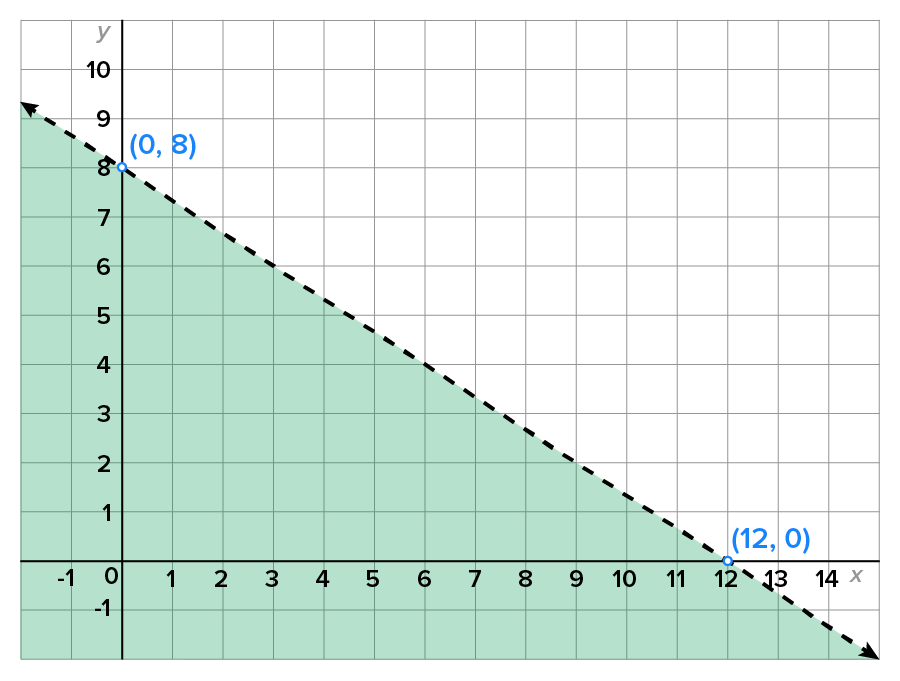

 graph
graph  Then, the solution is the shaded region above the graph, as shown below.
When the inequality is not convenient to solve for y, there are other techniques that can be used.
EXAMPLE
Sketch the solution to the inequality
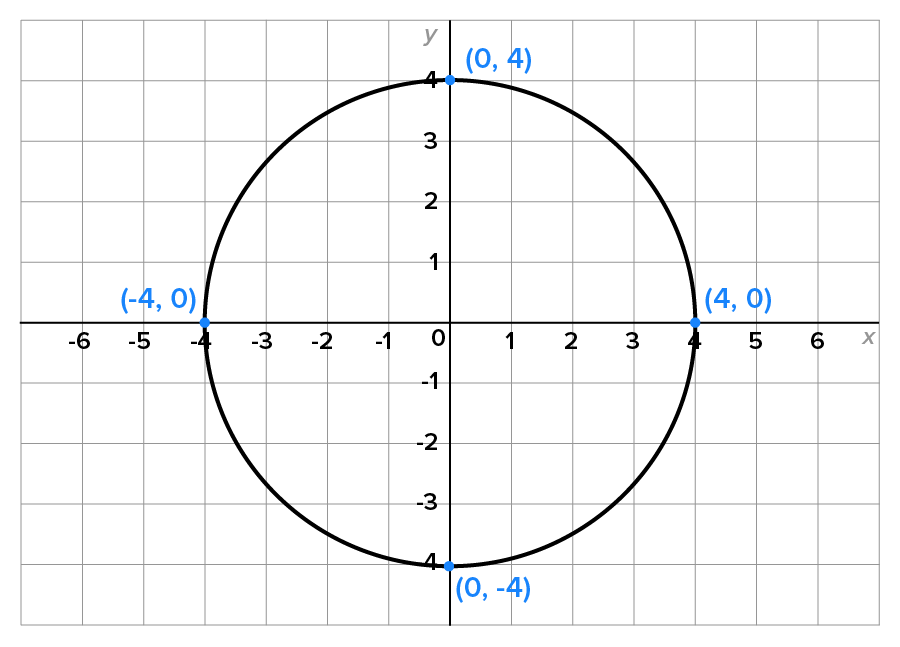
 is used as a reference. Recall that this is a circle with radius 4 with its center at the origin. It is graphed below.
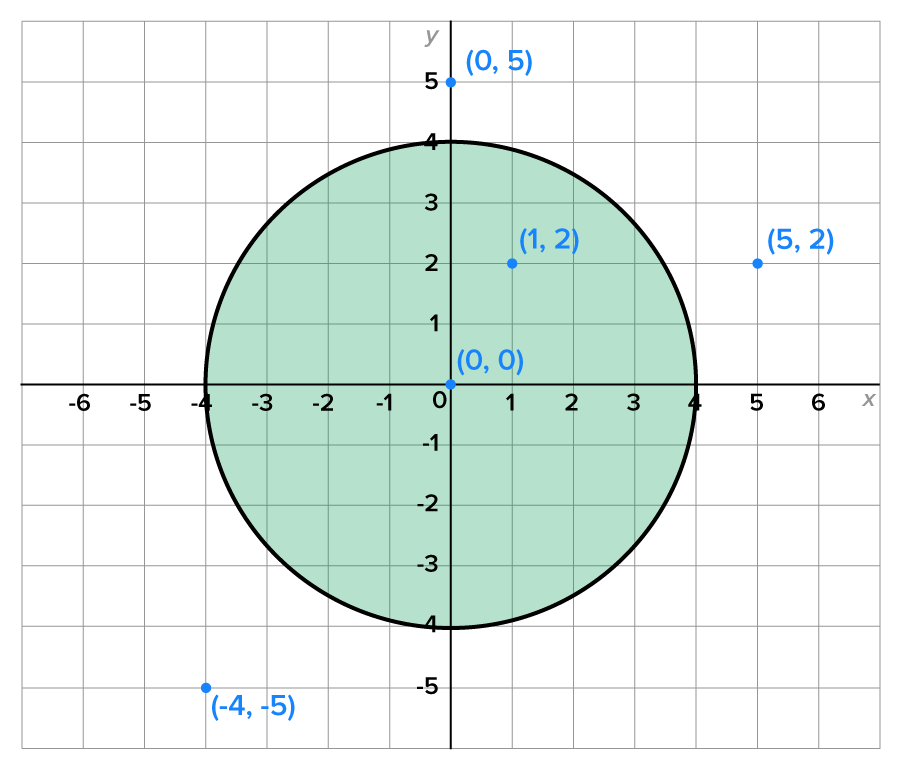
| Point |
Substitute Into 
|
Solution? |
|---|---|---|
 (Outside) |
 
|
No |
 (Inside) |
 
|
Yes |
 (Inside) |
 
|
Yes |
 (Outside) |
 
|
No |
 (Outside) |
 
|
No |

 with radius 5, not including the circle.
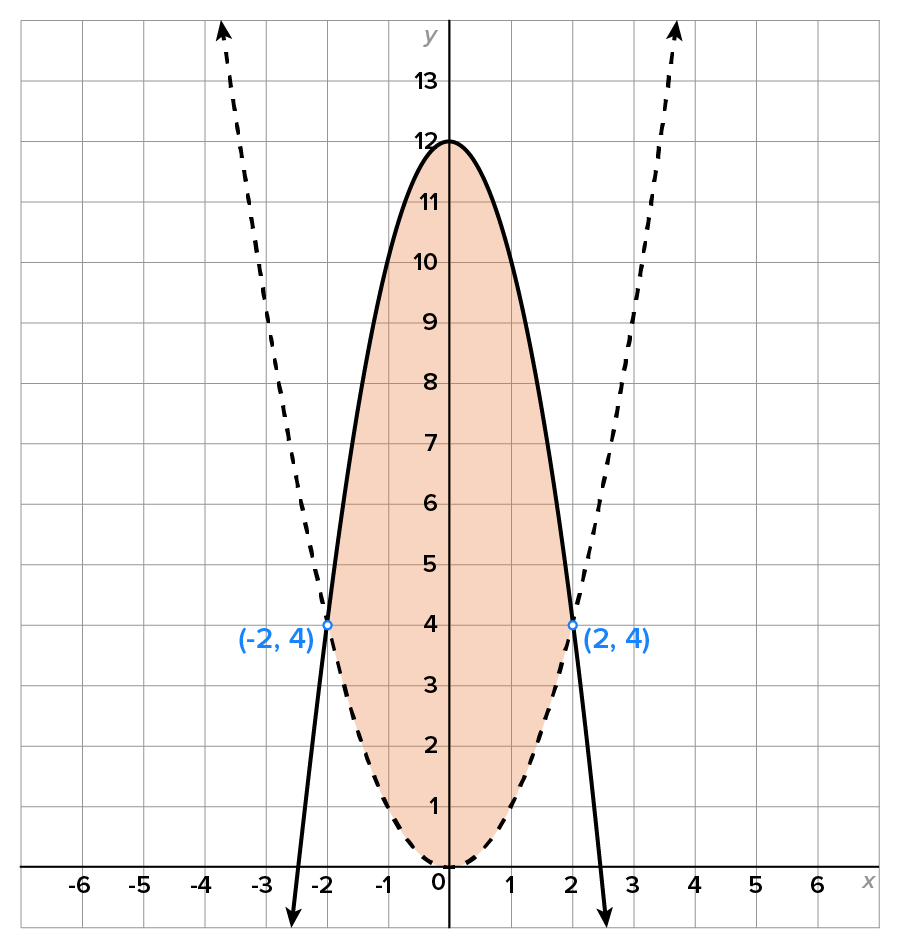
When solving a system of inequalities, we are looking at the common solution set to both inequalities.


 includes all points that are below the graph of
  or are on the graph.
 includes all points that are above the graph of
and the solid curve is
includes all points that are above the graph of
and the solid curve is 
SOURCE: THIS TUTORIAL HAS BEEN ADAPTED FROM OPENSTAX "PRECALCULUS” BY JAY ABRAMSON. ACCESS FOR FREE AT OPENSTAX.ORG/DETAILS/BOOKS/PRECALCULUS-2E. LICENSE: CREATIVE COMMONS ATTRIBUTION 4.0 INTERNATIONAL.
