Table of Contents |
Let’s begin by discussing why we measure GDP. We know that if real GDP (RGDP) rises from one year to the next, we can be confident that the economy is more productive than the year before or is growing.
If GDP falls, it is an indication that the economy is slowing.
Remember, RGDP is GDP adjusted for inflation. It shows real growth between periods, holding price levels constant.
Economic growth is defined as the measure of the change in RGDP over periods of time. It is a percentage change in the value of the sum of all goods and services produced within a country’s natural borders over a specified time interval.
Now, there are many ways in which an economy can produce more. However, producing or consuming more does not necessarily mean long-term economic growth. It is important to keep this in mind throughout this lesson.
We need to distinguish between the short-run aggregate supply curve and the long-run aggregate supply curve.
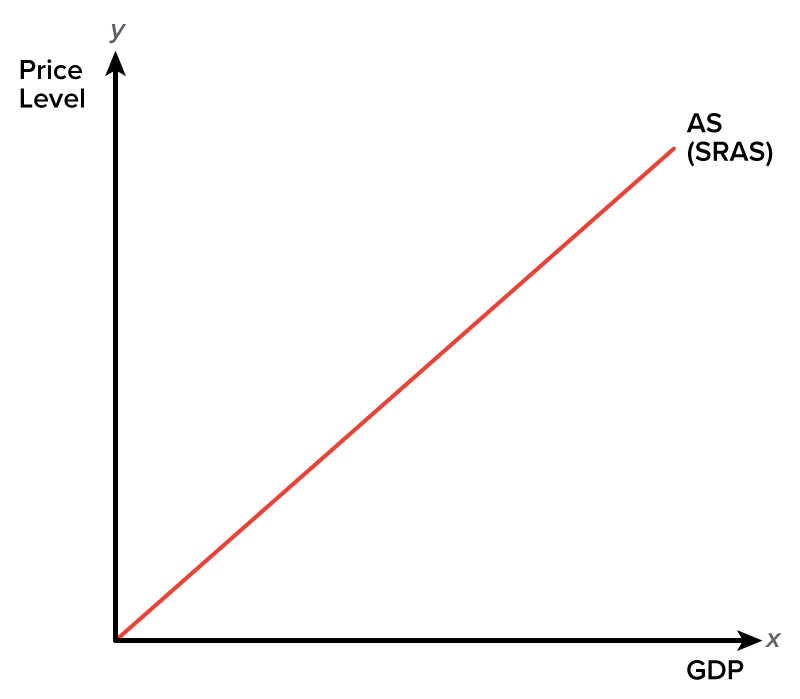
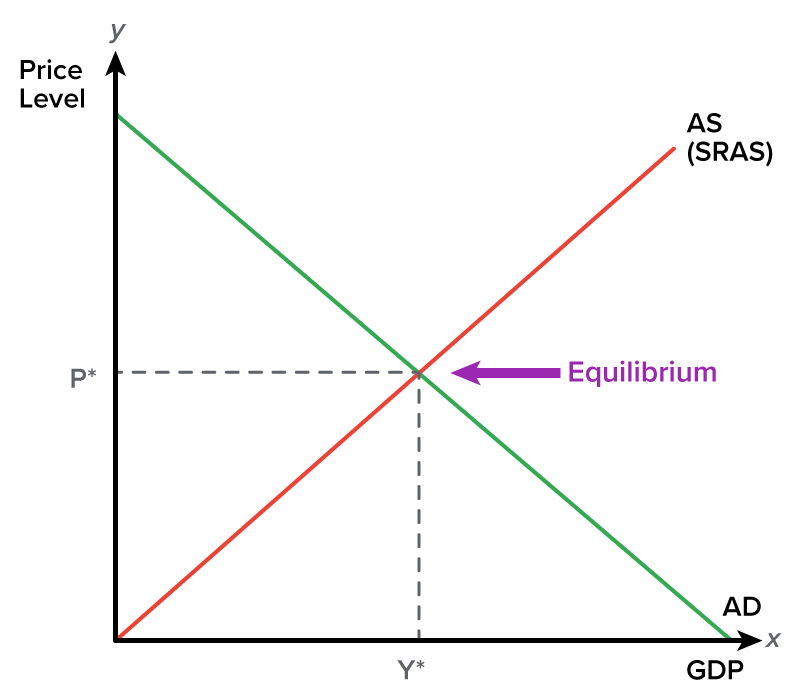
In review, this is the short-run aggregate supply curve (SRAS), which can vary in the short run with the price level.
In the short run, businesses tend to produce more as prices go up because they will not have to pay their workers more immediately as prices rise, and they can use their existing inventories.
This is why it is possible for aggregate supply to slope upward in the short run.
EXAMPLE
Suppose you pull an all-nighter to study for an exam. If you stay up all night, you will likely accomplish more than you usually would in 24 hours. However, this level of activity is not sustainable night after night indefinitely.Long-run aggregate supply, or LRAS, then, is assumed to be constant in the long run since resources are assumed to be used optimally, leaving no potential for increasing capacity.
The LRAS curve is a vertical line, and it shows our economy’s full potential in terms of production, given the current resources.
It is the amount of production possible when resources are fully employed and there is zero cyclical unemployment.
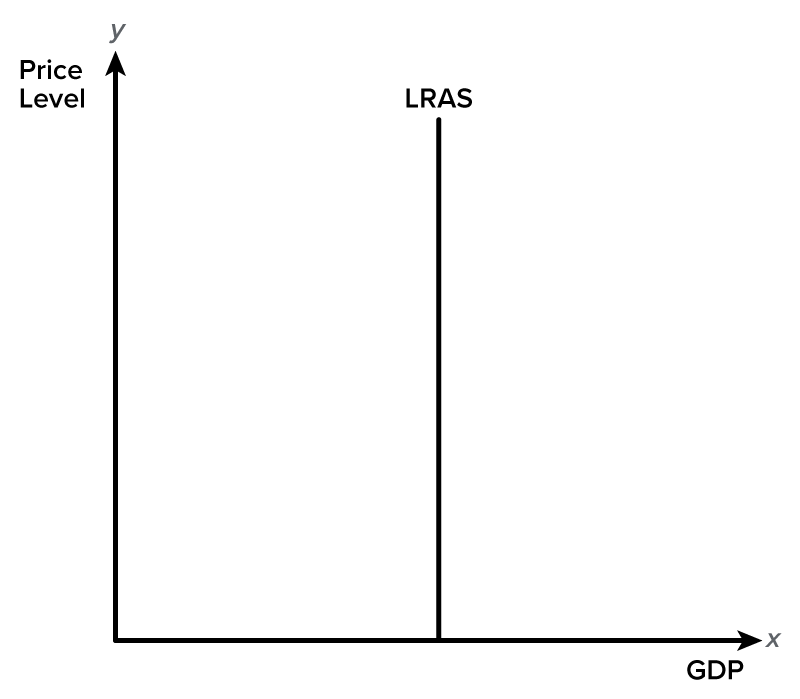
So, our production capacity is essentially fixed unless something changes to increase our ability to produce more.
Ramping up our production in the short run can only get us so far because, again, we have limited resources like materials and workers.
So, the amount of production that producers can sustain is fixed, which is the essence of the concept of sustainability. It is the ability to utilize resources in the current time frame without sacrificing the opportunity for future use and without disturbance to the ecosystem.
EXAMPLE
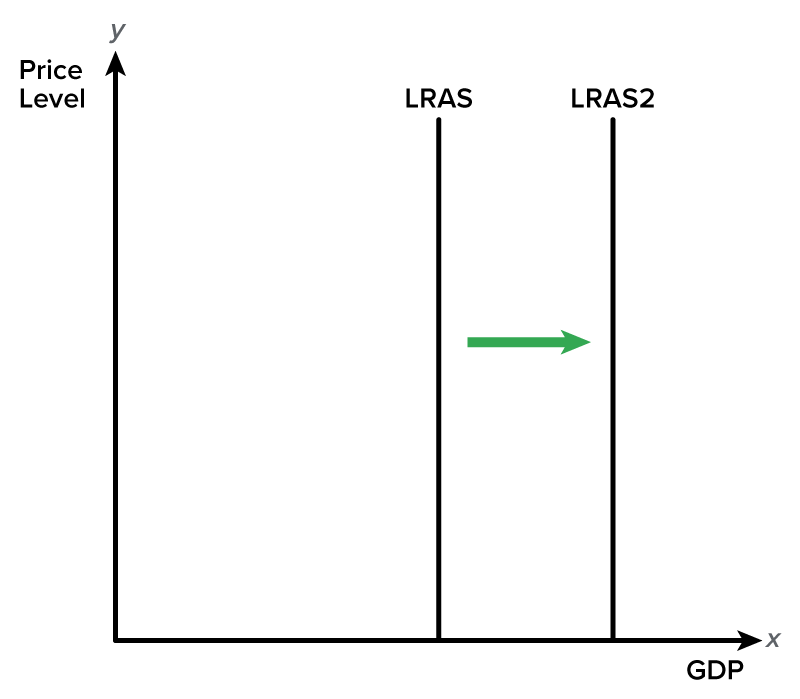
If many producers use our resources like timber faster than these resources are being replaced, this rate of growth will be unsustainable.How, then, does our economy actually grow over time and not just simply produce more in the short run? Well, we have to figure out a way for our LRAS curve to move, which is possible.
One way is finding more land, labor, or capital. The following are the possibilities:
Let’s look at sustainable versus unsustainable economic growth.
Sustainable economic growth involves the use of resources to foster growth and development that doesn’t deplete future resources needed for economic growth and development.
Unsustainable economic growth focuses mainly on short-term economic growth and development— that is, resources to promote growth are used at the expense of resources needed for future growth and development.
The following table compares both types of growth:
| Sustainable | Unsustainable | |
|---|---|---|
| Example | Use of computers | Tax breaks/stimulus programs |
| Effect | Businesses can hire the same (if not fewer) workers today and accomplish much more in less time | Expansionary policies temporarily encourage consumption or production |
| Economic Impact | Shifts long-run aggregate supply | Shifts aggregate demand or SRAS; no impact on LRAS |
| Definition | Growth that meets current needs to promote economic growth and development without harming future generation resource needs | Growth that depletes current resources available for growth and development while harming future generation resource needs |
| Resource Usage | Efficient resource usage | Inefficient resource usage |
| Environmental Impact | Low carbon emissions and more environmentally friendly | High carbon emissions and less environmentally friendly |
| Social Impact | More inclusive growth with social equity | Less inclusive and unequal distribution of resources |
| Goal | Long-term stability and incremental growth and development | Short-term growth, which leads to artificial economic booms and busts |
| Future Viability | Maintains current resources with opportunities for future generation | Depletes current resources with fewer opportunities for future generation |
| Economic Indicators | Balanced trade, moderate growth in GDP, low inflation (not more than 2%), and sustainable employment | A spike in GDP growth, high inflation, and high unemployment |
| Energy Usage | Greater reliance on renewable energy sources | Greater reliance on fossil fuels |
If we are in a recession, as shown in the following graph, these policies actually may be sustainable. This is because we are not at our full potential, and the policies encourage the use of currently unutilized resources.
They can also help the economy get to full employment.
However, economists unfortunately debate the exact location of the LRAS curve.
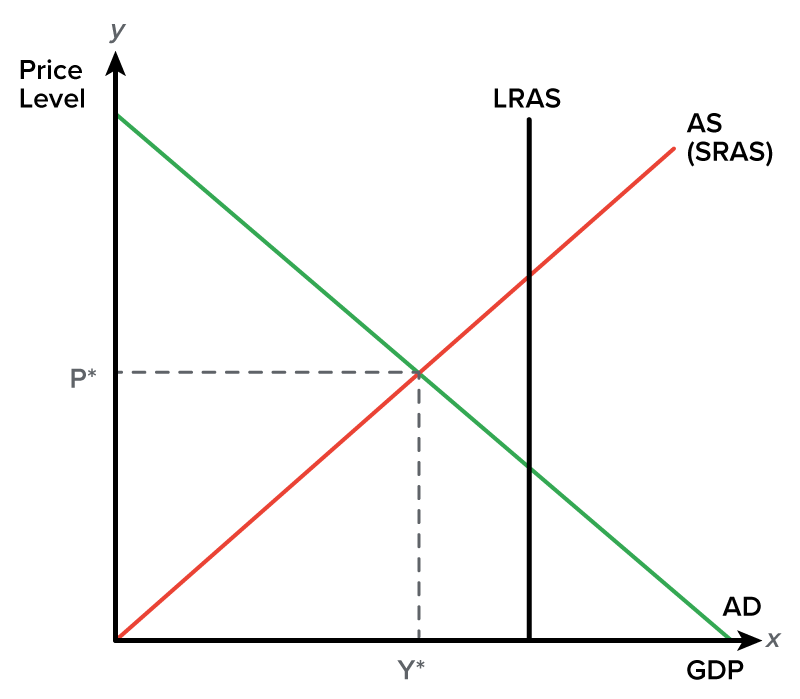
Assume we are already at equilibrium, as shown below, and we continue to stimulate aggregate demand through expansionary policies. Any time we push the short-run equilibrium output beyond the potential long-run output, it becomes unsustainable.
It will cause prices to go up, and then aggregate supply will shift to the left again. This is why the LRAS curve is where it is, because it represents our potential today, given the resources that we have.
If we are already at full employment, enacting those expansionary policies is not going to cause long-term economic growth that is sustainable. It will merely increase output in the short term.
The debate over sustainability can lead to some difficult decisions. Let’s walk through the example of nonrenewable sources of energy, which illustrates why there is so much debate—and no easy answer.
Now, we know that coal and oil are technically considered nonrenewable. So, why do we use them if they are not renewable?
Well, the economic answer is that the opportunity cost today of using them is lower than adopting new methods.
However, we know that will not always be the case. There will eventually come a time when it is actually more expensive to find what is left than what we get out of it.
EXAMPLE
At some point, we will use more energy to find the remaining coal underneath the earth’s surface than the energy we will get out of it. If we are talking about oil, it will get to the point when it will cost more to extract the oil than what we can get from the well—either because it is so far beneath the earth’s surface or because we have to find new sources of it.Some argue that we should stop relying on these unsustainable energy sources knowing that we will need to change eventually.
However, switching now would still be more expensive and would cause prices to rise. Therefore, while it would be good for future generations to do this sooner rather than later, it would be bad for older individuals today, who are living on fixed incomes.
It is impossible to say absolutely what is right because the costs and benefits vary for different groups of people. However, we can look at these costs and benefits and have discussions about various policies.
Source: THIS TUTORIAL WAS AUTHORED BY KATE ESKRA FOR SOPHIA LEARNING. PLEASE SEE OUR TERMS OF USE.