Table of Contents |
You may have learned in previous business classes that a high demand raises a product’s price, but in the last lesson, we learned that over time, a high demand lowers costs by increasing competition and innovation. Which is true? The answer is that demand with limited supply raises prices, but over time, the increased demand will lead to increased supply, which in turn lowers cost. The demand curve on the graph below shows that prices eventually drop as demand increases, because demand spurs production, which lead to increased supply.
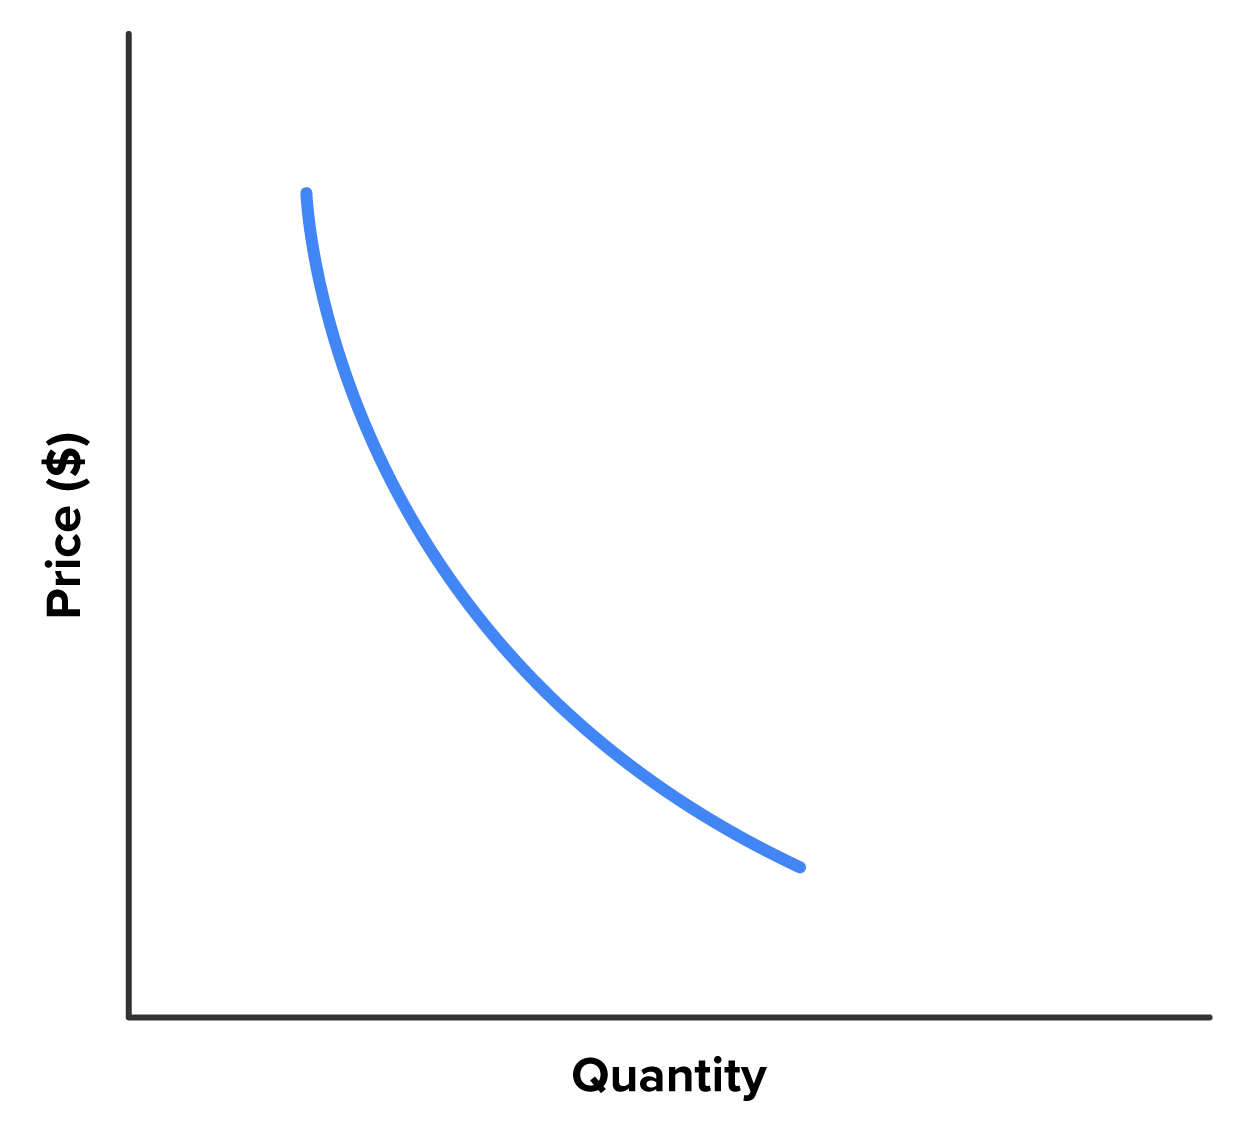
Recall that the demand curve is a fundamental tool in economic analysis, visually representing the inverse relationship between price and quantity demanded for a good or service. It shows how price changes influence consumer purchasing behavior within a specific timeframe. Plotted on a graph with price on the vertical axis and quantity demanded on the horizontal axis, the demand curve typically slopes downward from left to right. This reflects the law of demand, which states that, all other factors being equal, an increase in price will lead to a decrease in the quantity demanded by consumers. This can be attributed to factors such as price sensitivity, substitution effects, and income effects.
Understanding the demand curve is crucial for businesses to make informed pricing decisions. By analyzing the price elasticity of demand, which measures the responsiveness of quantity demanded to price changes, businesses can determine optimal pricing strategies to maximize revenue or market share. The demand curve also serves as a foundation for market forecasting, allowing businesses to predict consumer behavior under various pricing scenarios.
EXAMPLE
If Mexican food is popular in a city, the high demand attracts entrepreneurs who open more Mexican restaurants. They want to compete for our dollars by supplying Mexican food at a lower price, of better quality, or with specialized menus for differentiation (such as authentic cuisine from a specific region of Mexico). The original restaurants then must lower prices to maintain the customer base.Eventually, the price will reach a level where the supply and demand are at least temporarily balanced, which economists describe as equilibrium. While market forces will make any price reach equilibrium, most companies try to determine where that optimal price is in advance. Predicting demand is difficult even for the largest corporations, and particularly for small businesses.

From an operations management view, supply and demand is about being able to have the supply to meet the demand, but not overproducing. The operations manager must also monitor all supplies and labor needed to provide a good or service and further monitor other businesses that tap the same resources.

Several months have passed since Gordon built and tested a prototype and finalized the design. Gordon has found the facility to make the bicycles and has even added a few dozen to his inventory. He’s also found vendors locally who will carry the bicycle. Now comes the all-important task of deciding how many bikes to make. He doesn’t want to have customers place an order for a bicycle and receive it several months later, nor does he want to have hundreds of bikes in inventory—he doesn’t have the space for storage, and while bicycles don’t have as short a shelf life as other products, he knows that changes in technology might make the bikes obsolete before they’re sold.
One way to control demand is to set a price—a higher price will slow demand if Gordon finds he’s unable to keep up. A lower price will increase demand if he needs to clear out his inventory.
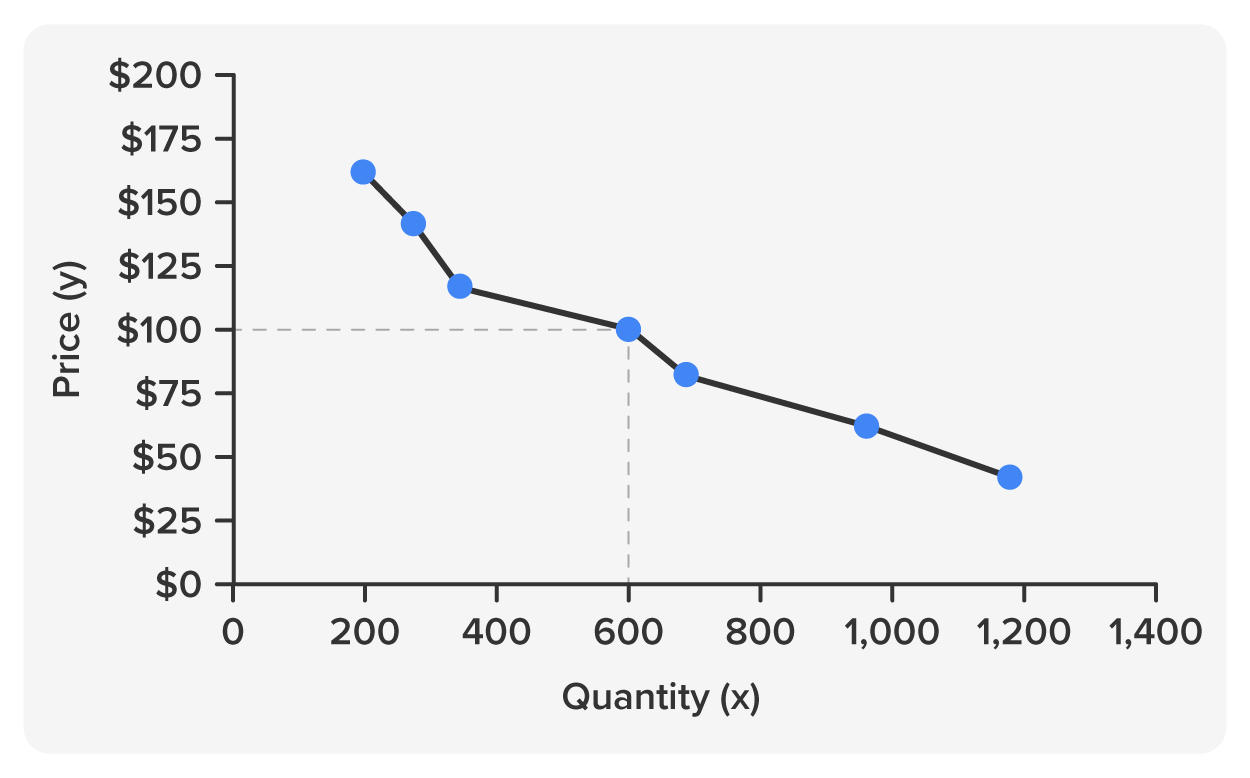
In the graph, the demand curve slopes downward and to the right because as the price falls, more people will buy the bicycle. The lowest price is the break-even point, where Gordon is only paying for the materials and manufacturing of the bicycle. Gordon will try to find a price that matches his own capacity to make the bikes, and which maximizes profits, which he can reinvest in the company to increase production.
We must also look at the quantity of a good or service that businesses will make available at various prices. If customers are willing to pay higher prices, businesses will produce more of the product or service. The supply curve is thus the opposite of the demand curve; in this case, a higher price corresponds to higher production. The supply curve depicts the relationship between production output and the corresponding total cost of producing those units. Typically illustrated as an upward slope, it reflects the principle of diminishing returns. As production volume increases, operational inefficiencies arise, necessitating additional resources and driving up costs per unit. Analyzing the supply curve empowers operations managers to optimize production levels. By identifying the point where cost efficiency plateaus, they can establish ideal output targets that balance production goals with cost control.

As you can see, there are two forces in tension with each other. As prices drop, demand increases because more people can afford the product, but as demand increases, prices go up again, at least until supply catches up.
EXAMPLE
If Gordon finds people willing to pay a higher price for his bikes, he is energized to make more bikes at a faster pace and has money to invest in the business to raise capacity. But as he introduces a lot more bikes, prices will eventually fall again.Where and when will prices and production stabilize? To answer this question, we need to look at what happens when demand and supply interact. By plotting both the demand curve and the supply curve on the same graph, we see that they cross at a certain quantity and price. At that point, labeled E, the quantity demanded equals the quantity supplied. This is the point of equilibrium. At that point, there is a balance between the quantity consumers will buy and the quantity suppliers will make available.

For a bigger company, finding this price would fall outside of operations, since finance sets goals and predicts revenue. However, just as operations works closely with marketing in product development, they must work closely with finance in finding an optimal price that matches their capacity, keeps products moving, and covers the operations costs (and hopefully returns a profit).
Modern business environments are characterized by dynamic consumer preferences and ever-evolving market trends. This translates to constant fluctuations in demand for goods and services. The ability of a company's supply chain to adapt to these changes is a critical determinant of its success. Sudden increases in demand can overwhelm existing production capacities and strain inventory management. This can lead to stockouts, delayed deliveries, and ultimately, dissatisfied customers. Conversely, unexpected dips in demand can result in excess inventory, wasted resources, and potential obsolescence of perishable goods.
From his experience in the auto industry, Gordon knows that many things can increase or decrease demand, especially for costlier goods. There are factors that are unknown and impossible to control. If gas prices go up, more people might decide to buy a bicycle for their daily commute. If the highway adds a lane that relieves congestion during rush hour, people who were considering a bicycle commute might decide against it.
Another factor that can shift demand is expectations about future prices. People on the fence about buying a new bicycle might wait if they suspect prices will drop or buy the bike sooner if they expect prices to go up. Demographic changes can also contribute to an increase or decrease in demand. In Gordon’s case, if the demographics of his hometown skew young, there are likely to be more bicycle commuters, while an older population would be less inclined to change their habits.
There may be changes that aren’t correlated to an overall demand for bicycles, but for his specific bicycle. Perhaps they will catch on and become a trend, or new competition will make it harder to distinguish his own products in the marketplace. These changes are harder to predict, but it would be unusual for demand to remain the same over time. The only constant is change.
All businesses have to deal with circumstances that are hard to predict and impossible to control. To mitigate these challenges, businesses are increasingly adopting agile supply chain practices. These involve implementing robust demand forecasting models, utilizing flexible manufacturing processes, and fostering closer collaboration with suppliers and distributors. Additionally, leveraging data analytics allows for real-time monitoring of inventory levels and customer buying patterns, enabling proactive adjustments to production schedules and logistics strategies. Embracing a proactive approach to managing demand fluctuations can help businesses ensure a smooth flow of goods and services, minimize disruptions, and maintain a competitive edge in today's dynamic market landscape.
The global supply chain operates on a delicate balance between supply and demand. However, changes in supply can have a significant impact on this equilibrium, causing disruptions that ripple throughout the entire network. These changes can be internal, such as fluctuations in raw material availability or production capacity, or external, driven by factors like natural disasters, political instability, or trade wars.
An increase in supply—for example, through technological advancements or the entry of new competitors—can lead to a decrease in prices and potentially higher inventory levels for downstream businesses. Conversely, a decrease in supply, caused by disruptions or resource scarcity, can result in price hikes, stock shortages, and production delays.
These disruptions can have a cascading effect, impacting everything from manufacturing schedules to delivery timelines. Companies are increasingly focusing on supply chain agility to mitigate these risks. This includes diversifying their supplier base, implementing robust forecasting models, and leveraging technology to improve visibility and communication across the entire network. Businesses can ensure a more resilient and efficient supply chain, ultimately safeguarding their bottom line and customer satisfaction, by anticipating and managing supply fluctuations.
Other factors influence the supply side of the picture. For example, if the price of carbon fiber goes up (which is used to make bicycle frames), the price of bicycles will go up regardless of demand. Prices may drop if more efficient methods of production are discovered. Businesses can use recent trends and core knowledge to forecast these changes, such as knowing that labor costs will go up and technological innovations will lower overall operating costs. Taxes and other governmental action can also affect supply. For example, a trade war with another country might lead to higher taxes on essential supplies. Cigarettes have risen steadily in price at a rate much higher than inflation due to increased state and federal taxes meant to discourage smoking and generate revenue to mitigate the impact of smoking on health.
A partial list of influences on supply and demand are in the table below. While most (but not all) factors that raise the product price decrease demand, not all are obvious, such as the prices of different products that use the same materials.
| Increases Demand | Decreases Demand | Rationale |
|---|---|---|
| Customers' incomes increase. | Customers' incomes decrease. | If customers' incomes increase, they have more money to spend, so demand increases; conversely, if incomes decrease, they have less money to spend. |
| Product is in fashion. | Product falls out of fashion. | Demand increases when a product is in style and decreases as it falls out of fashion. |
| People expect prices to rise in the future. | People expect prices to fall in the future. | Demand increases when prices are expected to rise, called “anticipatory buying.” But if people expect prices to fall, there will be less demand currently, as people will wait to purchase. |
| People see others using the product. | People do not see others using the product. | Demand increases if people see their friends or family using a product. If they don’t see others using the product, demand decreases. |
| Technology lowers cost of production. | Technology raises cost of production. | When technology allows prices to be lower, demand increases (because the price is lower). If technology is expensive and prices rise as a result, demand is decreased because people don’t want to pay the higher price. |
| Seasonal need is high. | Seasonal need is low. | If a product is in season, such as snow shovels in November, demand increases. Demand for snow shovels will decrease when seasonal need is low, such as in March. |
| Costs of production decrease. | Costs of production increase. | If raw materials, labor, or costs to make a product decrease, the demand will be higher because the product is cheaper. If the costs of production increase, the price usually increases, which lowers demand for a product. |
| Number of suppliers increase. | Number of suppliers decrease. | The number of suppliers increasing usually means prices for raw materials decrease, thereby making the price decrease. So, the number of suppliers increasing usually means a lower price, which increases demand. Conversely, the number of suppliers decreasing usually means more expensive raw materials, and therefore more expensive prices, which results in high prices and less demand. |
| Taxes on products decrease. | Taxes on product increase. | Taxes on some products, such as cigarettes, become the biggest factor in the end price. |
SOURCE: THIS TUTORIAL HAS BEEN ADAPTED FROM (1) SAYLOR ACADEMY AND NSCC “OPERATIONS MANAGEMENT”. ACCESS FOR FREE AT PRESSBOOKS.NSCC.CA/OPERATIONSMANAGEMENT2/. (2) OPENSTAX “INTRODUCTION TO BUSINESS”. ACCESS FOR FREE AT OPENSTAX.ORG/BOOKS/INTRODUCTION-BUSINESS/PAGES/1-INTRODUCTION. LICENSING (1 & 2): CREATIVE COMMONS ATTRIBUTION 4.0 INTERNATIONAL.