Table of Contents |
Data cleaning is essential for preparing the data for analysis. Below are several steps that can be taken to ensure you obtain clean data.
One of the most straightforward ways to identify missing data is to scan the data and look for missing values like blank cells or blank values in textual responses. You can also perform a count match to detect missing values. That is, compare the count of values in a column compared to the total number of rows in the data. If there is a mismatch, you have identified a column with missing values.
Once you have identified the missing values, you must determine what to do with them. Your decision on how to handle missing values will be guided by whether you can determine a reason for the missingness. There may be situations in which the missing values are legitimate and contribute meaningfully to the context of the business problem. For example, it may be completely legitimate that unemployed individuals have a missing value for income. Missing data can reflect privacy concerns like when a patient refuses to answer sensitive questions related to their mental health. Missing data could also reflect genuine preferences like a customer satisfaction survey where a customer can choose not to answer certain questions. In these situations, you want to leave the missing values as-is.
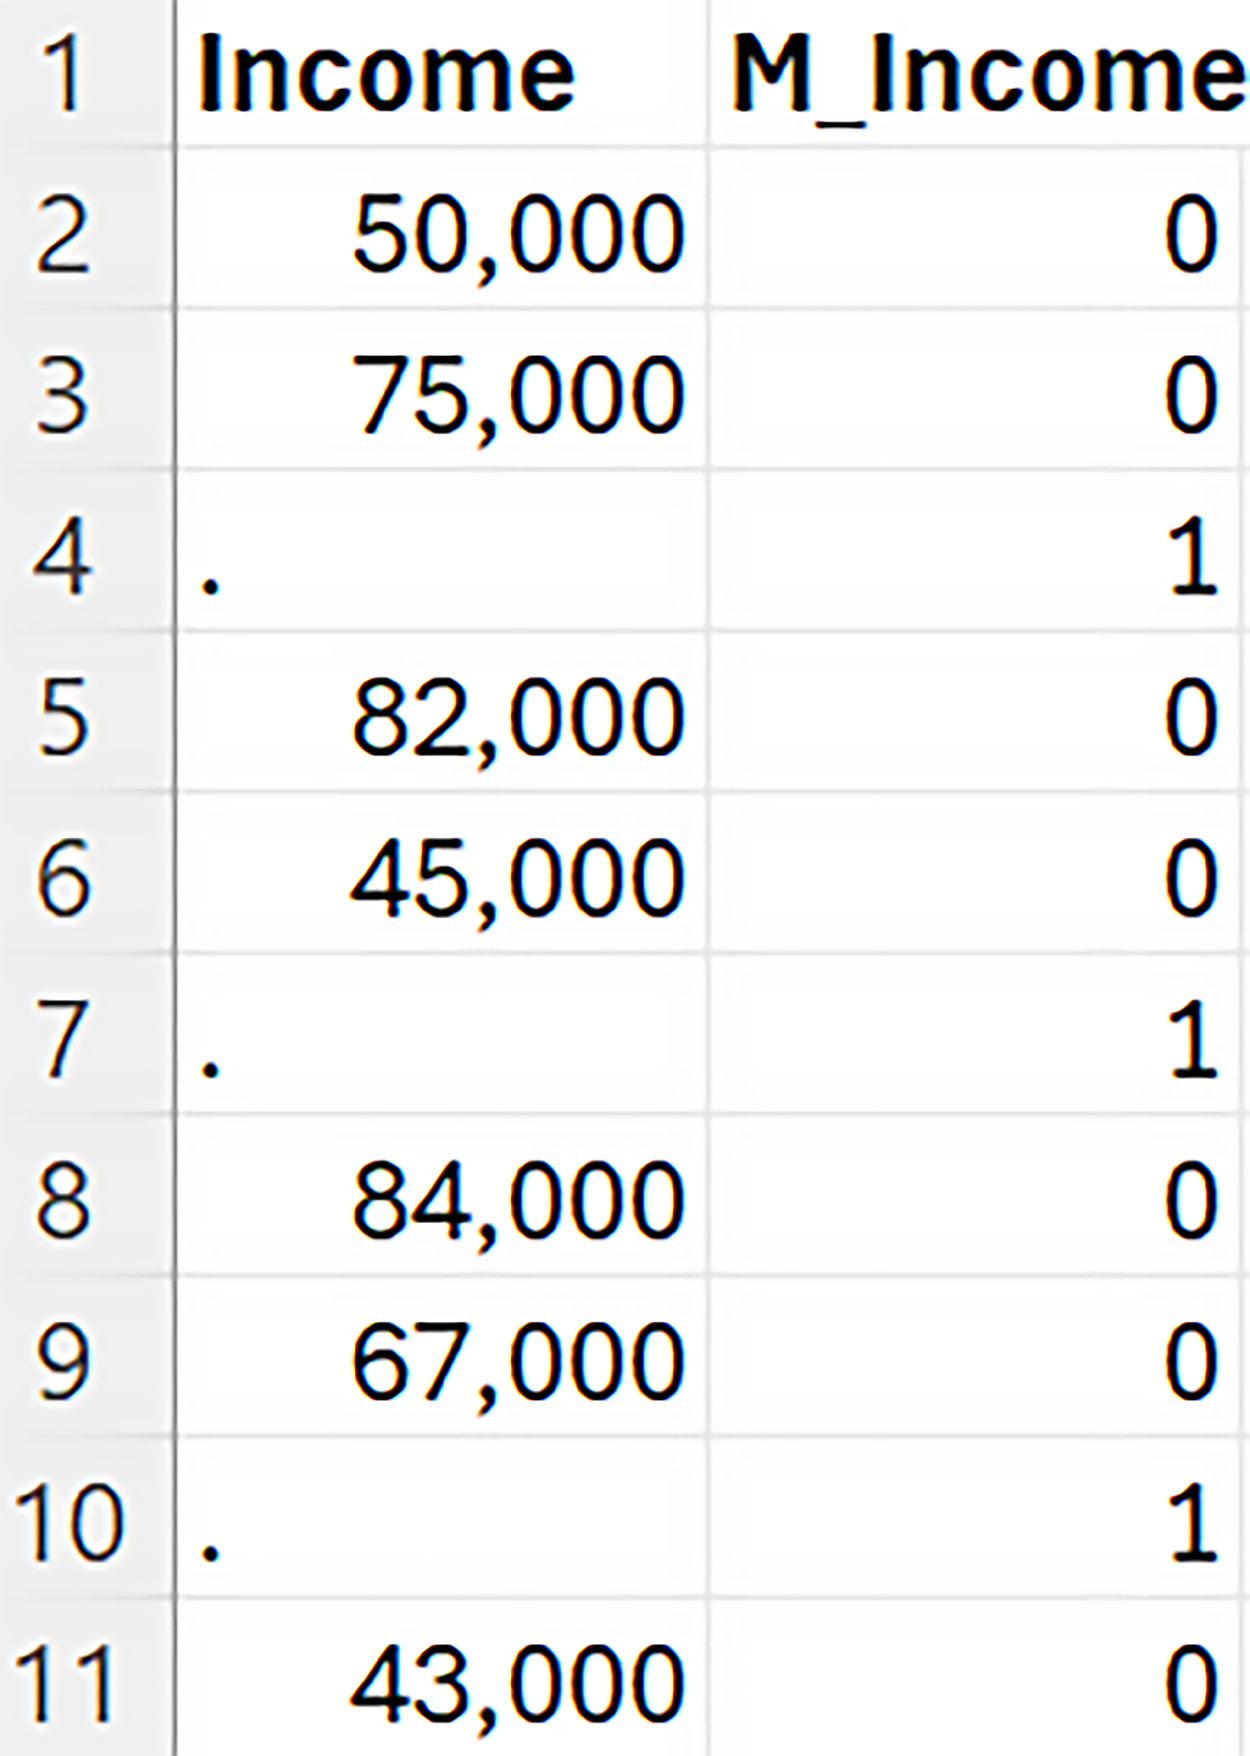 If you encounter a situation where the missingness carries meaning in the context of the business problem, an effective technique is to create an indicator variable, sometimes referred to as a dummy variable. A missing indicator variable is a binary variable that takes on the value “1” if the observation is missing and a value of “0” if the observation is not missing. The figure below shows a missing indicator variable. The column M_Income is the missing indicator variable. The prefix of M_ followed by the name of the column is the naming convention to denote the missing indicator variable. When Income is not missing, M_Income is 0 and when Income is missing, M_Income is 1.
You can use the missing indicator variable in the analysis or in a downstream process. For example, when calculating an average, consider excluding rows where the indicator value is 1 (missing data). You can also use the missing indicator variables in predictive models, and the results can provide you with additional information about the problem. If the missing indicator variable turns out to be important in a predictive model, this information can inform you of an insight that might not be obvious without the missing data being present. For example, customers who did not provide their income also tend to pay their bills late.
Another way of handling missing values is to impute the missing values. Missing value imputation is the process of estimating or filling in missing data values in a data set. There are several imputation techniques. Let’s explore a few of these.
| Imputation Method | Scenario | Appropriate Use |
|---|---|---|
| Mean | You have a data set of supply chain costs (total cost associated with delivering goods). Some of the costs are missing. There are no outliers, and the distribution of the costs is symmetric. | Mean imputation is suitable to replace missing values when no outliers are present, and the distribution is approximately symmetric. |
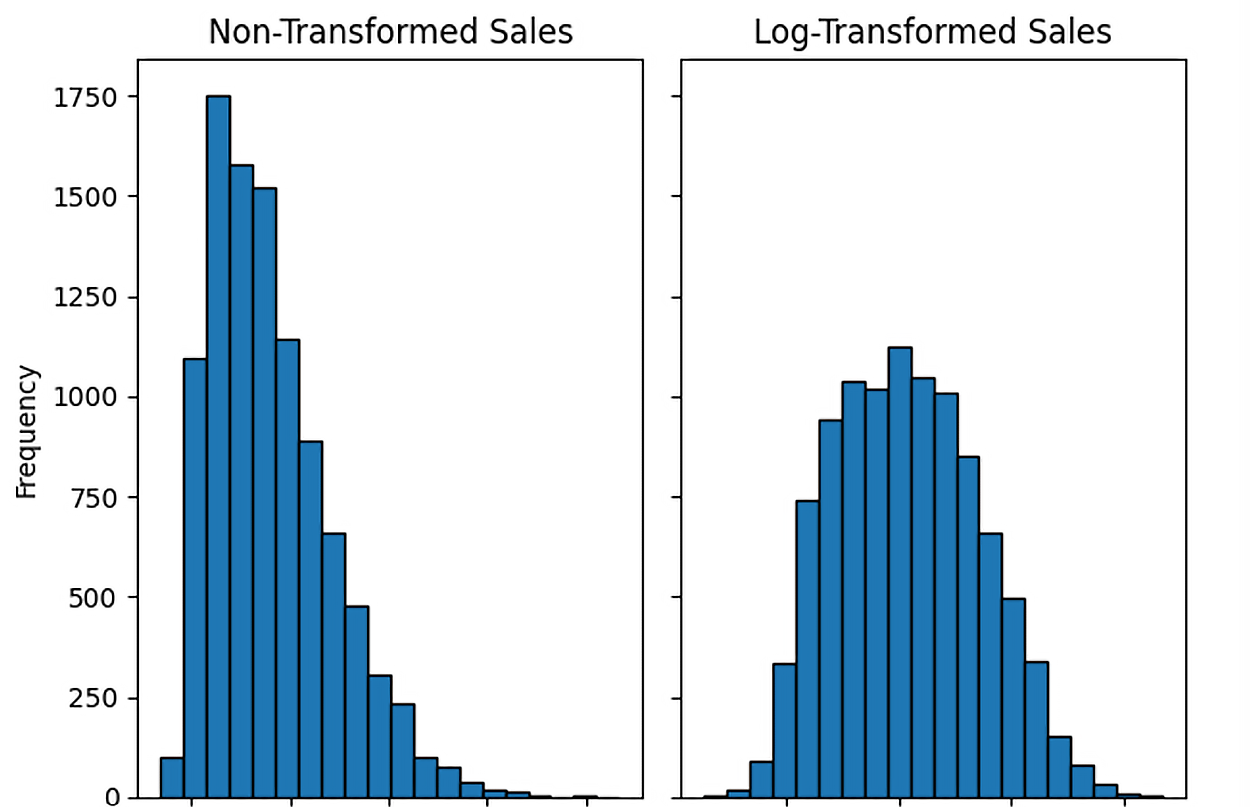
| Median | You have a data set that consists of household incomes with several outlying observations. Some of the income values are missing. When you examine the distribution, you observe a long tail in the right or left direction. | Median imputation is suitable to replace missing values when outliers are present. The median is not influenced by outliers. |
| Mode | You have a data set that describes the customer payment method (credit card, debit card, and cash). Several of the payment methods are missing. | Mode imputation is suitable for categorical data where you replace missing values with the most frequent category. This method is straightforward and preserves the mode of the data set. |
| Model Imputation | You have a data set of patient health records with missing values in several variables, and you want to predict the missing values using other available data. | Model imputation, such as using regression or machine learning models, is appropriate when you have multiple variables and can leverage the relationships between them to predict missing values. This method requires more expertise on the part of the data analyst. |
| Domain-Specific | You are analyzing daily sales data from a retail chain to understand seasonal trends and optimize inventory management. The dataset includes daily sales figures, product categories, store locations, and promotional activities. However, some sales data is missing due to system outages or data entry errors. | Use historical sales patterns and promotional activity data to impute the missing sales values. Leveraging historical sales data and promotional activity provides a more accurate estimate than simple mean or median imputation. This method considers the specific characteristics of retail sales data, such as seasonal trends and promotional impacts. Incorporating domain-specific knowledge ensures that the imputed values are realistic and consistent with known sales behaviors. |
In a previous tutorial, you learned how to detect outliers using frequency distributions, histograms, and boxplots. Once you have detected that a data value(s) may be a potential outlier, you must decide what to do about the outlier(s). There are several strategies for dealing with outliers as outlined below.
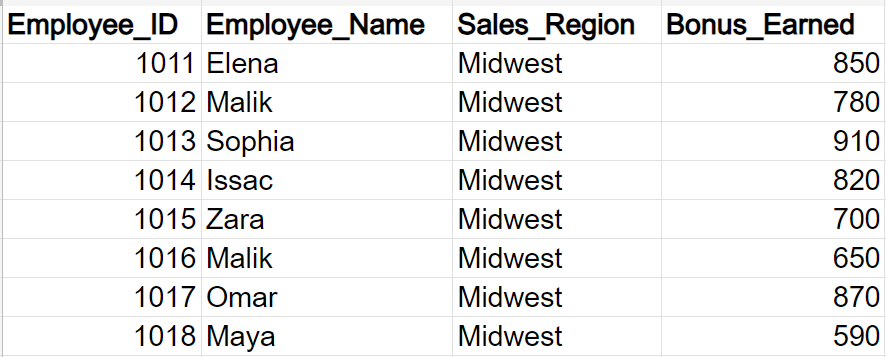
Duplicate data can appear in data sets for various reasons. The same data can be represented in multiple ways. Variations in addresses (123 Main St. Vs. 123 Main Street) or product descriptions (Manatee Inflatable Kayak vs. Mantee Inf Kay) can appear multiple times. The duplicate data can be a product of combining data from multiple places like CRMs and ERPs. Standardizing data can help with reducing duplicate data.
EXAMPLE
The figure below shows some employee bonus data from a company that sells solar heating panels.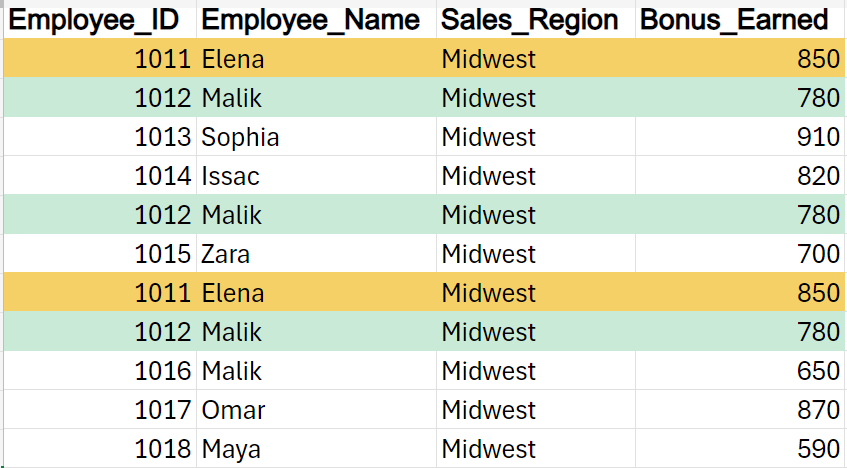
Filtering data means removing part of the data. Filtering the data as part of the data cleaning process serves several essential purposes as outlined below.
The last tutorial emphasized the reasons why data needed to be standardized. Data standardization is a step in the data cleaning process. When you standardize the data, you are ensuring that the data adheres to a certain consistent format. This consistency allows the computer systems that process and move the data to be more efficient and make fewer mistakes. For example, a column used to indicate the country of origin could have the categories “US” and “United States.” Both these categories will show up in the data, but they should be analyzed as one category. You will have to standardize the country names to something consistent like “US.”
You will need to explore your data and determine if there are any data errors. Data errors can occur due to typos, mislabeling of categories, or incorrect symbols being inserted into the data. There could be data values in a particular column that do not belong there. For example, personal names may be in a column used to designate a country.
Source: THIS TUTORIAL WAS AUTHORED BY SOPHIA LEARNING. PLEASE SEE OUR TERMS OF USE.