Table of Contents |
Recall that statistical process control (SPC) is a quality control method using statistical measurements and analysis. Since Six Sigma is largely about measurement and data-based decision making, statistical process controls are a key component, and many companies use it as part of their Six Sigma adoption. However, the concept is older than Six Sigma and may be used independently or in conjunction with other efficiency programs.
Monitoring and controlling a process ensures that it operates at its full potential with a minimum (if not an elimination) of waste such as flawed goods that must be reworked or discarded. SPC can be applied to any process where the performance output can be measured in meaningful ways. Key tools used in SPC include control charts; a focus on continuous improvement; and the design of experiments.
SPC must be practiced in two phases. The first phase is the initial establishment of what can be measured and collected. This phase includes installation and integration of measurements, standardization of processes, and collection and analysis of baseline data. The second phase is experimentation, which we will discuss later in this tutorial.
Historically, the factors being measured were organized into the “4 Ms of Operations Management” for materials, man, machines, and methods. More recent versions of SPC include environment, as well as using a more inclusive “people” to refer to staff.
| Operational Factor | Goal | Examples of Measurements |
|---|---|---|
| Materials | Materials are of sufficient quality and optimized inventory to avoid work slowdowns or flaws in products. |
Quantity of materials each morning. Quantity of materials that are discarded due to problems. |
| People | All staff are trained, motivated, and prepared to provide sustained efficient labor. | Number of staff present or absent. Percentage of time on task. Number of human errors. |
| Machines | Machines are well maintained and optimized to avoid inefficiencies or errors. | Number of tasks performed by machines. Amount of downtime due to repairs or maintenance. |
| Methods | Processes have been (and continue to be) studied and standardized for smooth workflow. | Variations in tasks performed using different configurations of staff and machinery. |
| Environment | The temperature, air quality, noise, and other factors are all controlled to avoid undue effects on people or equipment. | Temperature, noise level, absenteeism due to ergonomic or environmental issues; lost productivity time due to environmental factors. |
A crucial part of data collection is to establish controls over basic factors so that the data being collected is a good representation of normal operations. For example, initial data collection shouldn’t happen if the company is unusually short-staffed, if machines are malfunctioning, or other factors that are not normally present will skew the baseline data.

Gordon is interested in statistical process control as a way to make continuous improvement to the production process at his bicycle company. He establishes a set of measures including the exact number of each component of the bicycle before assembly, the time taken for each part of the assembly process, the quality of the finished product based on visual inspection, and the stress on the machinery using a set of strain gauges. He also measures air quality because there have been comments from workers. For a couple of weeks, he simply collects data for all of the measures. He ensures that during these two weeks, there are not mitigating factors beyond the usual and predictable variations.
Recall that in Six Sigma, variability is the key indicator of inefficiency and waste. However, no two products or characteristics are the same because any process contains many sources of variability. In manufacturing, traditionally, the quality of a finished article was ensured by post-manufacturing inspection of the product. Each article (or a sample of articles from a production lot) would be accepted or rejected according to how well it met its specifications. In contrast, SPC uses statistical tools to observe the performance of the production process in order to detect significant variations before they result in significant production of defective goods.
Any source of variation at any point in time in a process will fall into one of two classes:
Common causes are normal sources of variation. This refers to many sources of variation that consistently act on process, such as trivial size differences for machine-cut materials, natural flaws in organic materials, or human differences that lead to slight variations in hand-assembled items, etc. These types of causes produce a stable and repeatable distribution over time.
Special causes refer to any factor causing variation that affects only some of the process output. They are often intermittent and unpredictable.
Most processes have many sources of variation; most of them are minor and may be ignored. If the dominant sources of variation are identified, however, resources for change can be focused on them. If the dominant assignable sources of variation are detected, potentially they can be identified and removed. Once removed, the process is said to be stable. When a process is stable, its variation should remain within a known set of limits.
EXAMPLE
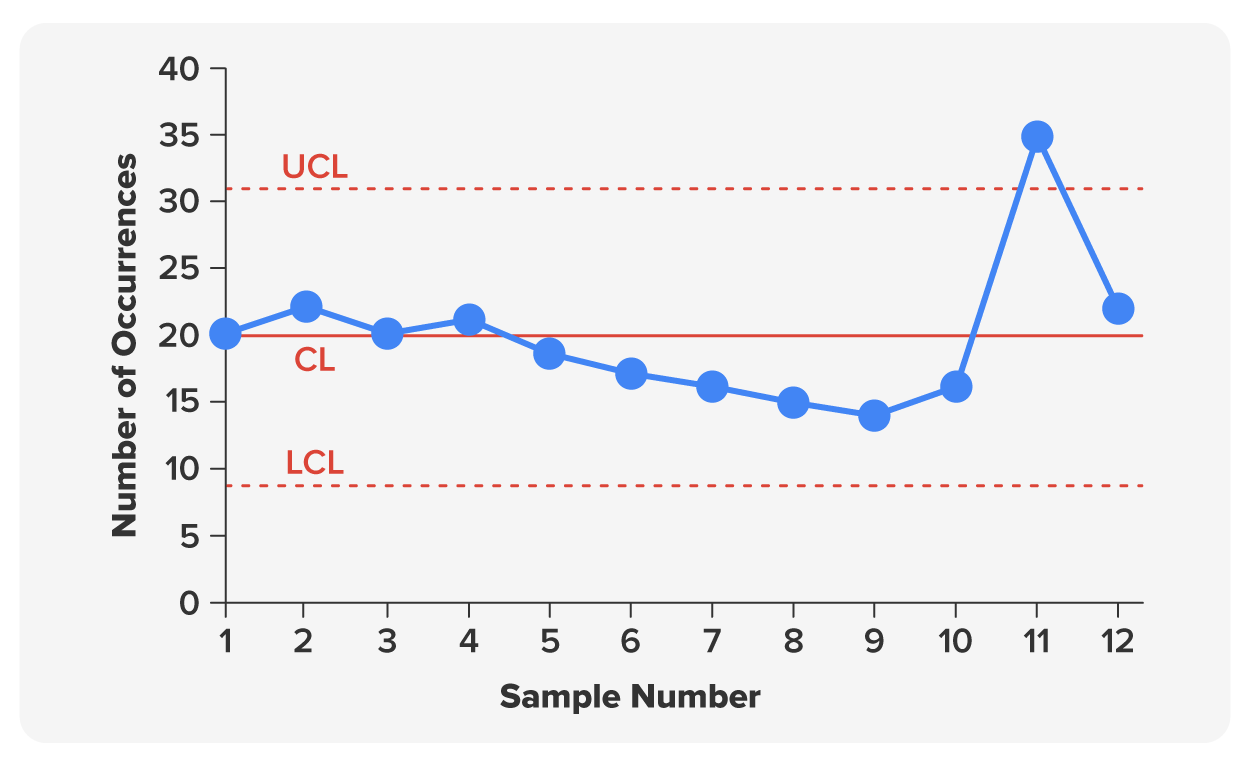
A breakfast cereal packaging line may be designed to fill each cereal box with 500 grams of cereal. A common cause of variation is that a precise weight of 500 grams is hard to achieve with the machinery used. Some boxes will have slightly more than 500 grams, and some will have slightly less. When the package weights are measured, the data will demonstrate a distribution of net weights within 5 grams. The difference would be so slight that customers will not notice. However, if some boxes fell outside of normal variation, such as being off by 50 grams, customers would notice. The operations manager would be concerned and find the source of the issue.The data from measurements is often monitored using control charts. Control charts give a visual display of variation where it is easy to note special causes of variation outside the norm, which is established in data collection. When variability falls inside a normal range, the system is stable. Variability outside the range is excessive variation. In modern manufacturing, this data may be collected by SPC software. The operations manager can view all of the charts on one dashboard; wide variation may even trigger an alert to be sent to the operations manager for their attention based on established detection rules, the algorithms that determine if special action is needed. In software, this may be an alert sent by email or text to the operations manager.
When the process triggers any of the control chart detection rules, the first goal is to identify the source of the excessive variation. Methods of eliminating a source of variation might include repairing or replacing machine parts; changes to the environment; development of standards; staff training; and changes to the process itself or its inputs.
If the source of the variation is not obvious, a common process for brainstorming possibilities is the fishbone diagram we described in the last tutorial.
The brainstorming session includes everyone familiar with the problem. A facilitator uses a whiteboard or pad to track progress. They begin with a horizontal arrow that represents the problem. They then draw diagonal lines for every major area that might impact the problem, such as the “4Ms” previously discussed (materials, methods, machines, and men/people), plus the environment. A fifth “M” introduced by SPC itself is measurement, since a possibility for the variability is that the measurement itself is in error, such as a malfunctioning monitor. For each line, the group then suggests possible reasons within that domain that might be responsible for the problem. The facilitator should be thorough in prompting the group for possible problems in each of the areas. Once these are identified, each item can be checked, adjusted, or removed (if possible) until the source is identified and the process can be stabilized.
The second phase of SPC is experimentation. As with continuous improvement, this relies on a tolerance (even enthusiasm) by all staff for trying new things, seeing if they work, and accepting momentary setbacks or failures.
Experimentation begins with design of experiments (DOE), also called experimental design. The key to a designed experiment is to have two groups of measurement: the control group and the experimental group. In operations, the baseline data already collected and analyzed serves as the control. The organization can then perform an experiment by changing any aspect of the production process, collecting data, and comparing the results to the first series of data. It’s important for experimental design to control for as many variables as possible, meaning that the two terms of research (control and experiment) are as alike as possible in every way except the aspect under investigation.
IN CONTEXT: GORDON’S BICYCLE COMPANY
Say that Gordon has determined that the time needed to assemble a bicycle has the most variability, and he wants to figure out why. From baseline data, he notices that the time gets longer towards the end of each shift. He thus decides on an experimental design with shorter shifts of four hours instead of eight, offering workers double shifts with long breaks in between. As he runs this test, he would want to ensure that other aspects of the process are the same, such as the same number of staff, with the same amount of experience. Some of this may be outside of his control. For example, if the experimental time falls during hot weather that negatively affects the work environment, it is likely to skew the experiment. For the best experimental design, Gordon would wait to do the experiment when the conditions are the same as they were when he collected baseline data.
Design of experiments is also part of continuous improvement. There need not be a specific problem that needs to be solved, but rather areas targeted for improvement, such as more energy efficiency or improved safety for workers. The role SPC plays is in guiding operations managers to the areas most in need of improvement and providing evidence that a proposed solution does or does not bring improvement.
Statistical process control is also used in the service industry, and while many aspects of the process are the same in terms of collecting data, setting ranges of normal variability, and detecting excessive variability, there are a number of complicating factors in both knowing what to measure and knowing how to measure it. For example, while visual inspection and measurements can determine if a product is functional or unacceptable, determining if a customer had a good experience is more subjective.
One instrument that is commonly used is SERVQUAL (for service quality). The acronym RATER is used as a mnemonic for the five key areas being measured. In the table below, an agent is any customer-facing individual representing the company, whether a sales representative, customer service associate, cashier, technical support, wait staff, etc.
| Area Being Measured | Description |
|---|---|
| Reliability | The agent performs the service promptly and accurately. |
| Assurance | The agent instills trust and confidence, both through verbal assurances and through nonverbal cues. |
| Tangibles | In on-location sites like restaurants, this would be the cleanliness and appearance of the facilities. While less obvious in telephone or internet service, usability and functionality are important. |
| Empathy | Particularly important to customer service for returns, damaged goods, or help using a product, this is the agent's ability to show that they care about the customer, understand the problem, and want to find a solution that will satisfy them. |
| Responsiveness | This refers to promptness of service and includes wait times the customer experiences before reaching an agent. |
Some of these (like wait time) can be objectively measured, but others are reliant on customer surveys to collect and analyze data. These present problems: Although everybody is invited to complete a survey, only a small percentage of customers usually do, and this may be a self-selecting group (say, people who are very dissatisfied and want to be heard). Moreover, with the movement toward collecting and analyzing data, virtually all businesses now issue surveys, which leads to survey fatigue for respondents, or the lack of interest in completing surveys or giving them meaningful attention. Many organizations might wonder whether it’s worth it to try and collect data that is subjective and incomplete. Is it better than doing data at all?
Source: This tutorial has been adapted from Saylor Academy and NSCC “Operations Management”. Access for free at https://pressbooks.nscc.ca/operationsmanagement2/. License: Creative Commons Attribution 4.0 International.