Table of Contents |
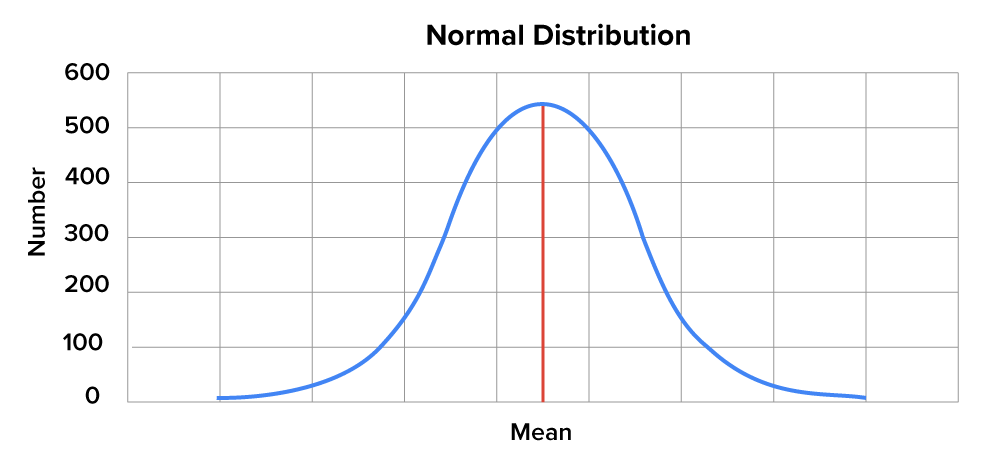
Recall from previous lessons that normal distributions have a bell-shaped curve in which the mean is the center point, and the standard deviation indicates how spread out the distribution is. One of the goals of using normal distributions is to find the probability under the normal distribution curve that an event will occur.
Since you are often concerned with finding a probability under the normal distribution curve and because normal distribution curves differ for the data you are considering, there is a need to create a standard normal distribution. This is because doing so will allow you to quickly determine the probabilities related to any normal distribution.
How do you change things from a normal distribution to a standard normal distribution? This is done by simply changing the points of the standard deviations. You do what is called “standardizing” them. You can change a normal distribution into a standard distribution by applying a formula to each value in the normal distribution. By converting a normal distribution into a standard normal distribution, each value is changed from the normal distribution into what are referred to as z-scores, by using the following formula:

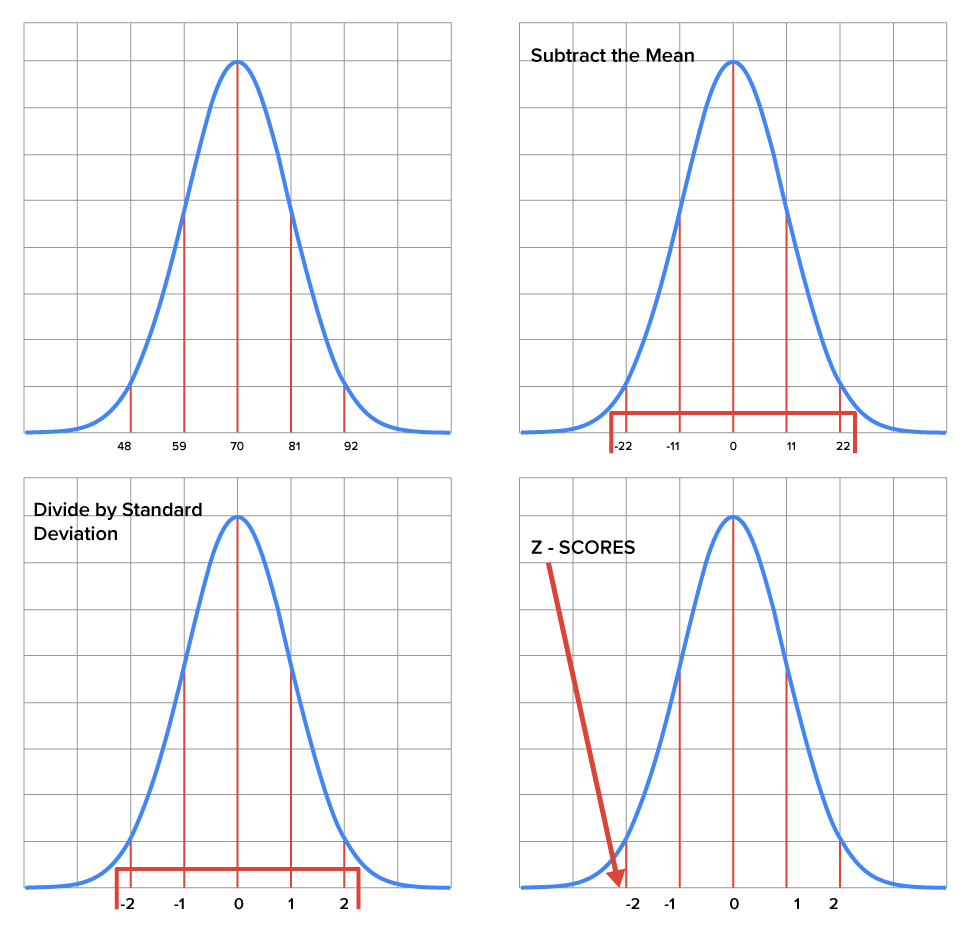
Z-distributions are used to define the position of a value in terms of the mean and the standard deviation, where the mean has a z-score equal to 0 due to its being a location along the horizontal axis. This axis is the one that provides us with the location of any z-score.
What is interesting about a z-distribution is that its shape contains what are called “turning points.” These fall on the curve at the point where a z-score is equal to either -1 or 1. The left turning point has a z-score of -1, which indicates its location on the horizontal axis, whereas the right turning point has a z-score of 1 since that is where it is located on the horizontal axis.
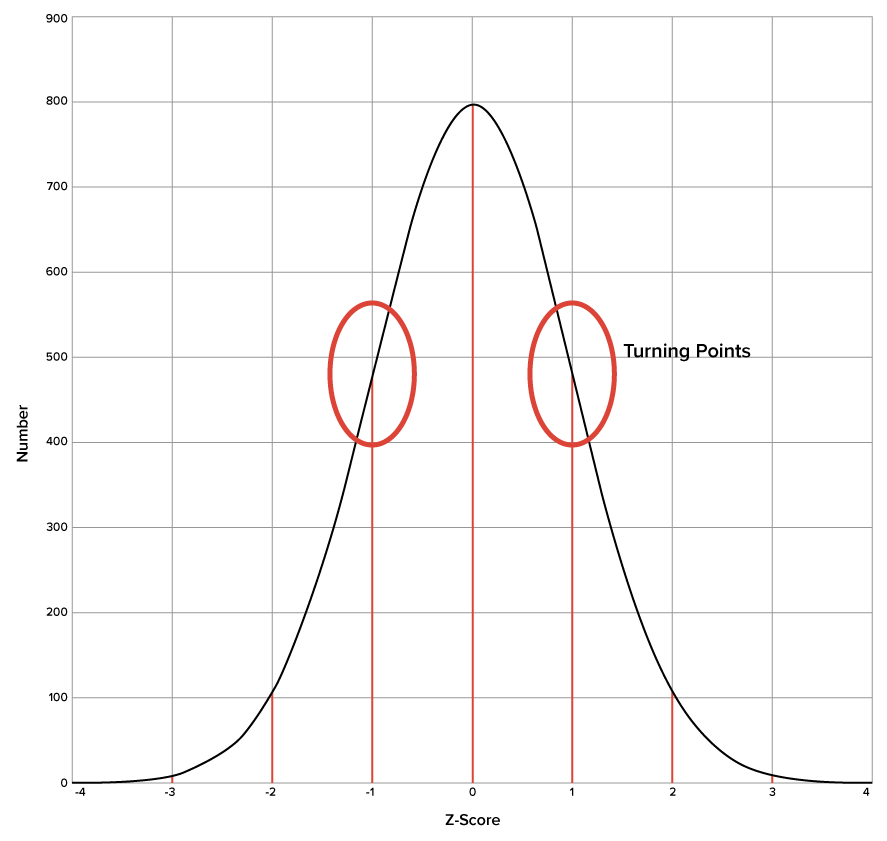
Additionally, there are typically values of -3, -2, 2, and 3 on the z-distribution. What is especially useful about the z-distribution graph is that the areas between different z-scores are known, which makes it relatively easy to determine the probability that a specific event will occur.
| Z-Score Values | Description | Area |
|---|---|---|
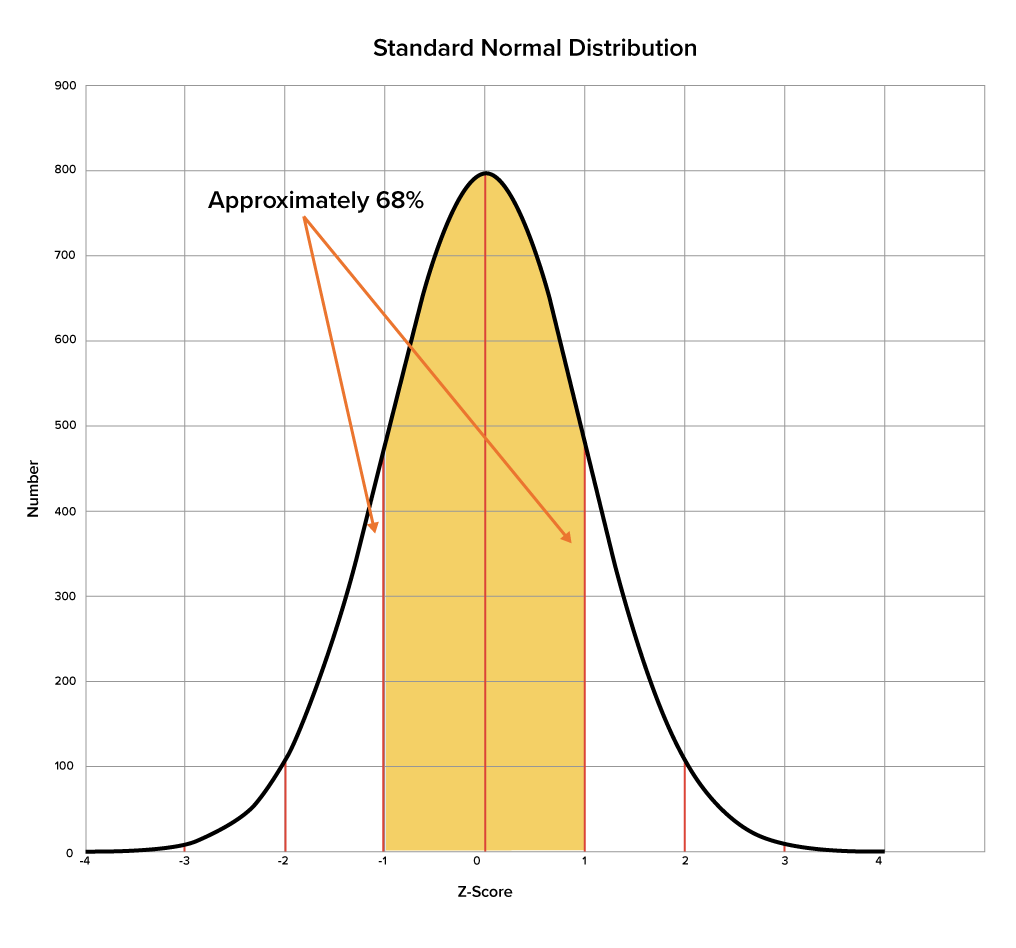
| Z-score values of -1 and 1 | Roughly 68% of the area under the z-distribution curve falls between the z-score values of -1 and 1. |
|
| Z-score values of -2 and 2 | Approximately 95% of the area under the z-distribution curve falls between the z-scores of -2 and 2. |
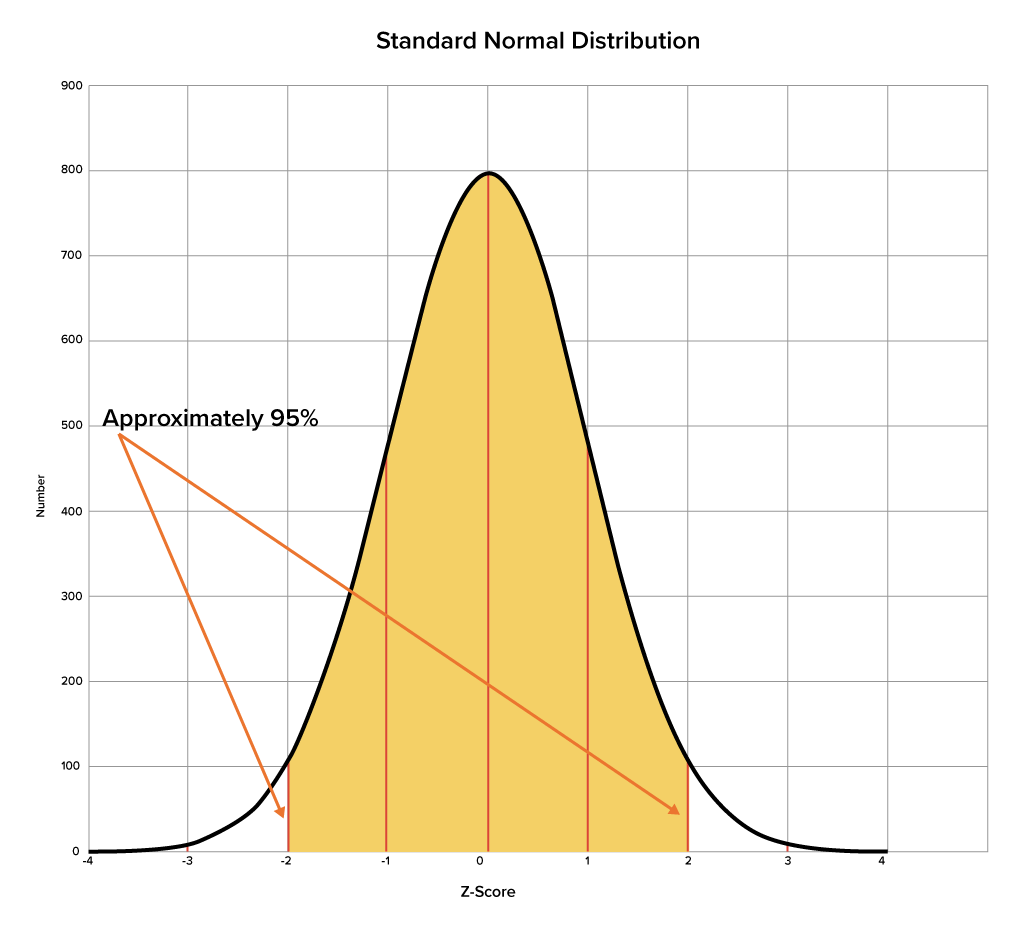
|
| Z-score values of -3 and 3 | Approximately 99.7% of the area under the z-distribution curve falls between the z-score values of -3 and 3. |
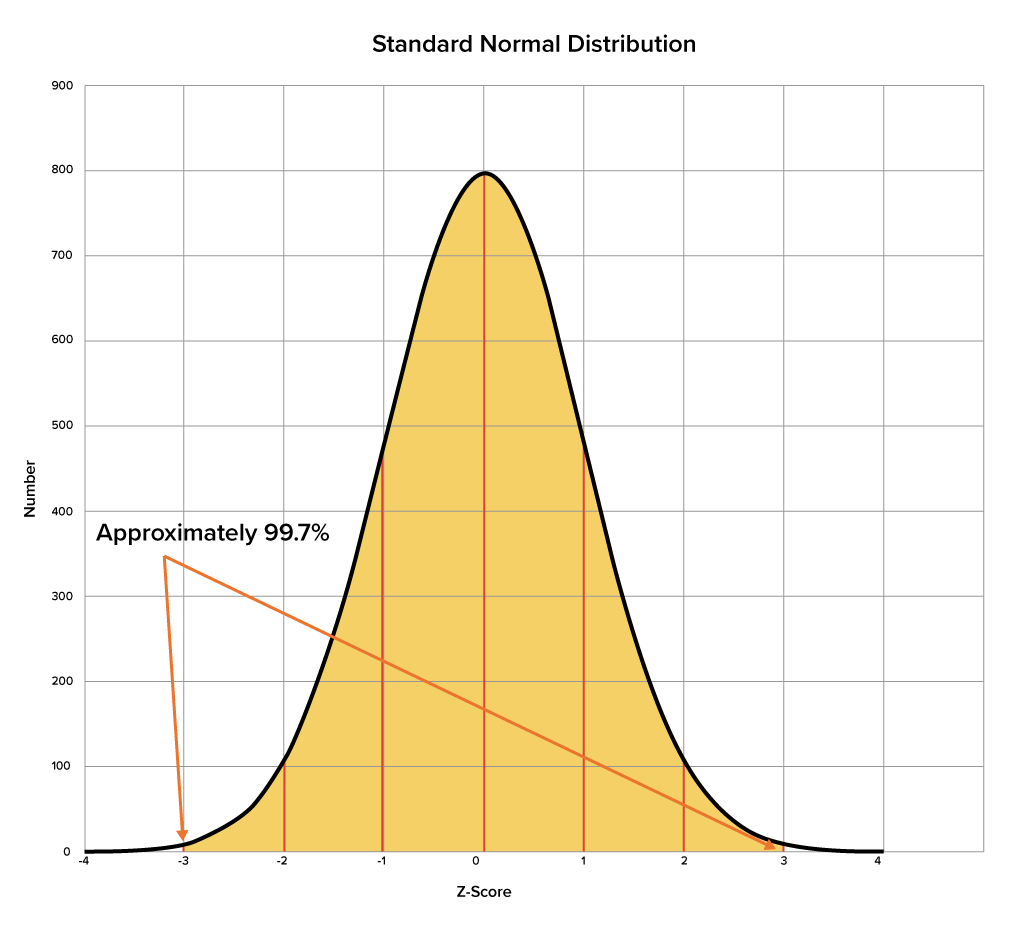
|
| Z-score values less than -3 and greater than 3 | A z-score less than -3 and greater than 3 account for the remaining 0.3% of the area under the z-distribution curve. |
 |
Each one of these percentage values is related to a probability value that explains the chance of an event occurring if it happens to fall between two specific z-scores.
Source: THIS TUTORIAL WAS AUTHORED BY DAN LAUB FOR SOPHIA LEARNING. PLEASE SEE OUR TERMS OF USE.
