Table of Contents |
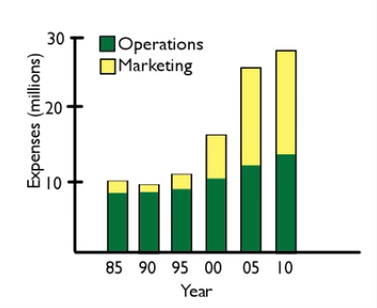
Stack plots are plots that stack one on top of each other so that you can see how they relate to the totals. Stack plots allow you to break down bar graphs or line charts into component pieces to see the components more clearly. The problem with stack plots is that sometimes they can be hard to interpret.
EXAMPLE
Suppose that a company spent a certain number of millions of dollars over these 5-year intervals, as shown in the graph below. So, in 1985, they spent $10 million. In 1990, they spent a little bit less, and so forth. It looks like their spending increased significantly in the last 10 years or so.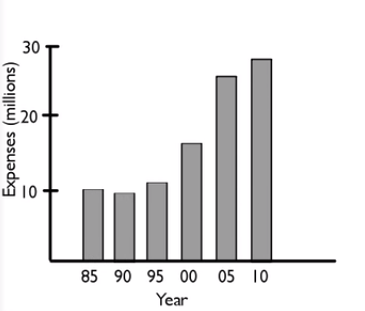
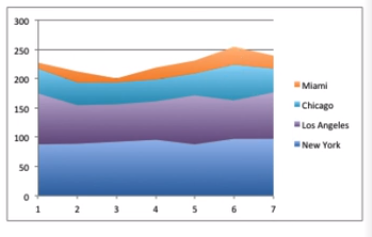
A stack line chart can be problematic because they are often very hard to read. It is difficult to tell whether the values are cumulative or individual.
EXAMPLE
Suppose there are four different boutique stores in different locations that a company owns. They want to know how the business is doing in each of these four markets.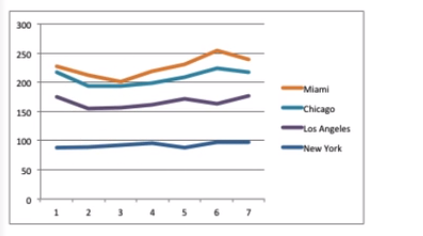
Source: THIS TUTORIAL WAS AUTHORED BY JONATHAN OSTERS FOR SOPHIA LEARNING. PLEASE SEE OUR TERMS OF USE.