In this lesson, you will learn how to sort and filter data. Specifically, this lesson will cover:
1. Sorting Data
Sorting is the process of arranging data into a meaningful order to make it easier to understand, analyze, or visualize. Sorting helps create a structured format that reveals patterns and insights.
We can use the Netflix data to illustrate different ways to sort data.
1a. Sorting for Detecting Data Errors
Sorting can assist you in several data cleaning steps. One application is in identifying data errors. The country column indicates the country where the film or show was produced. You might want to explore the distribution of films and TV shows that are produced in each country to see which countries produce the most content. You must ensure that the country column only contains the country's values and there is no messy data that must be addressed in the country column to complete the content availability analysis.
Beyond detecting data errors, sorting is the first step toward organizing the data for the intended analysis. Sorting rearranges the rows of the data based on the values in the columns. By sorting the countries in the country column, the next step would be to group the countries and calculate summary measures such as the total number of movies or TV shows produced in each country.
Let’s sort the Netflix data by the country column and see what can be uncovered.
-
EXAMPLE
Sort the Netflix data by the
country column.

Notice that there are some commas in the first two rows of the data that probably should not be there. These commas will need to be removed. In addition, you will notice that some rows have more than one country. The
country column indicates the country where the film or show was produced, so it may make sense that multiple countries could be included in this column. In an upcoming tutorial, you will learn how to address these issues in the
country column by separating the multiple values of country into separate columns in Excel.
-
Sort the
country column.
- Open netflix.xlsx and select the country column.
- Under the Home tab on the ribbon, select the dropdown arrow to the right of the Sort and Filter tool. Select the Sort Ascending option. This option arranges the data in ascending order (smallest to largest). Since the values of country are textual values, the values will be arranged in alphabetical order starting with the letter A.

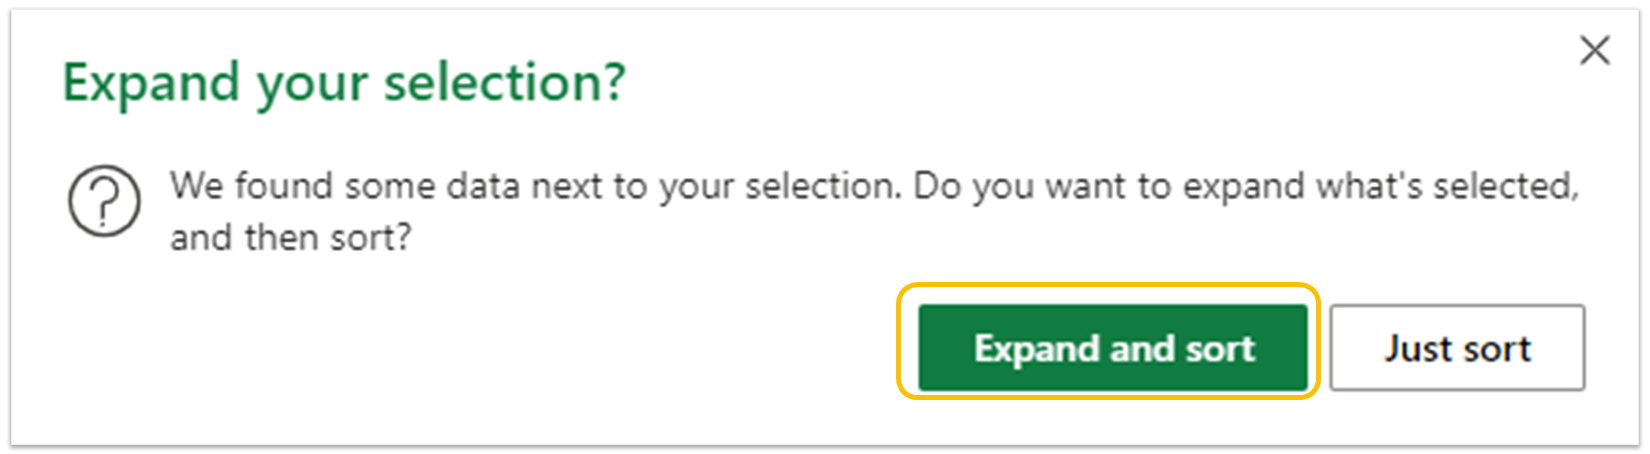
- You will receive a message asking if you would like to expand the section. If you choose Expand and sort, Excel expands the sorting procedure to include related data in other columns while keeping the rows together. This ensures data integrity is preserved throughout the soring process. Unless you have a very specific reason that you do not need the rows to stay together, you should always select this option. If you choose Just sort, only that column will be sorted. Click on Expand and sort to keep the data intact.
- Check your work by comparing your formatted country column to the one in the example above.
1b. Sorting Data for Identifying Outliers and Simple Queries
Sorting data can also help you identify and evaluate whether a quantitative observation is an outlier. In addition, the sort can assist you in answering simple queries. Perhaps you need to know which Netflix film or show was the most expensive to produce. That is, it had the largest budget.
-
EXAMPLE
Sort the
budget column to find the title that had the largest budget using the Netflix data.

There are some very large budgets at the top of our sorted column. These budgets may have to be investigated to see if they qualify as outliers in the data.
-
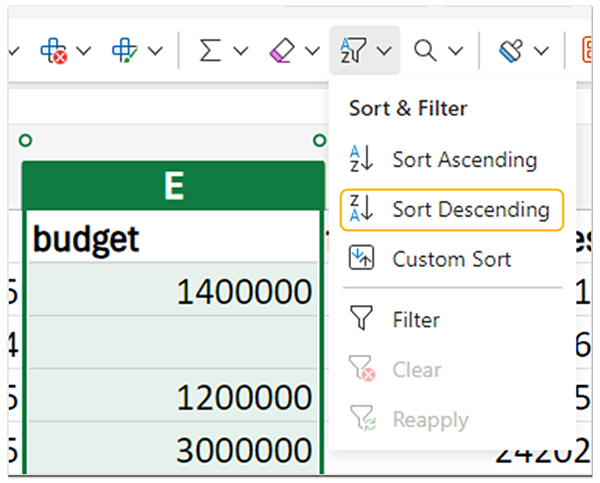
Sort the
budget column.
- Open netflix.xlsx, select the budget column.
- Under the Home tab, select the dropdown arrow to the right of the Sort and Filter tool. Select the Sort Descending option. This option arranges the data in descending order (largest to smallest).
- Once again you will get a message asking you if you would like to expand the section. Select Expand and sort to keep the data intact.
- Check your work by comparing your sorted budget column to the one in the example.
2. Filtering Data
Filtering data in Excel allows you to quickly isolate and display only the relevant rows based on specific conditions. Filtering can save you time because it helps you focus on a smaller and more relevant data set so that you can simplify the analysis process. Filtering is also known as subsetting the data.
-
Filter the
average rating column for all shows that have an average rating of 5.
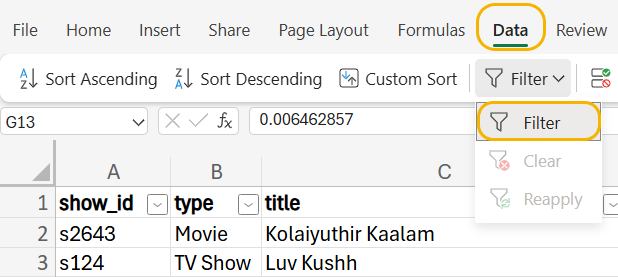
- Under the Data tab on the ribbon, select Filter. This will allow you to filter using any of the columns on your sheet. A dropdown box will appear at the right side of each column header cell.
- Click on the drop-down arrow on the right of the average rating column. Choose Select All to remove all checks from the checkboxes, then choose the check box next to 5. Then, click on the Apply button.
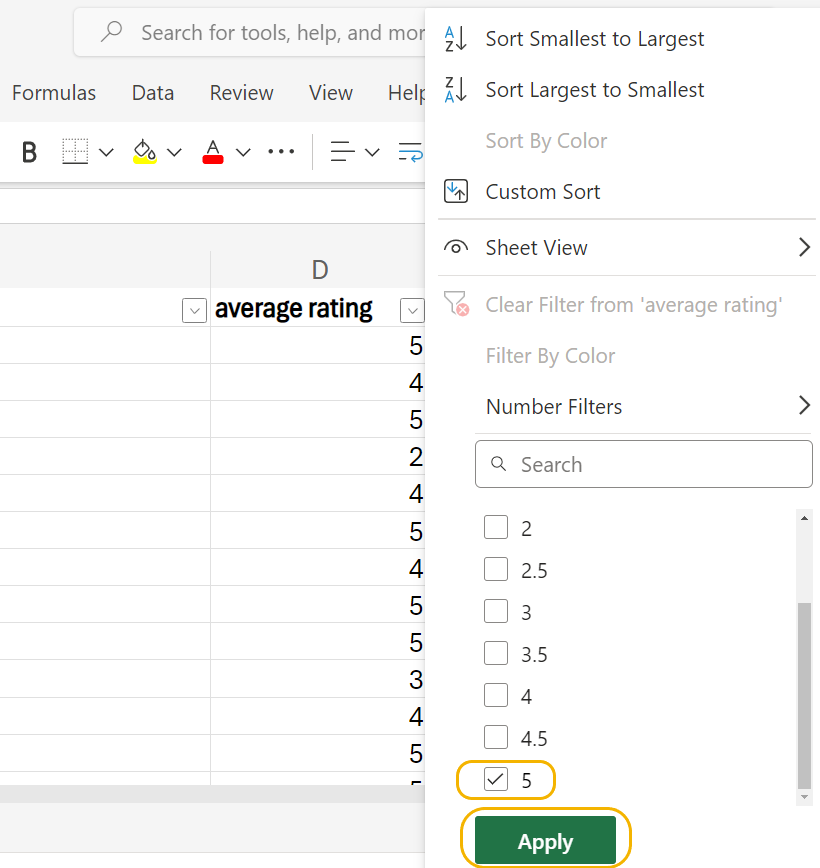
- The data in the average rating column should look like this. Note the filter icon to the right of the column name, which indicates a column with an active filter. In this case, average rating has an active filter, but budget does not.

- Only shows with average ratings of 5 are shown.
-
When you filter data in Excel 365, the worksheet that you filter in will update to show the filtered rows. The unfiltered rows will be hidden in the worksheet. This is important to know because if you apply an aggregate Excel function like AVERAGE() to the filtered worksheet, all the rows will be considered in the function, not just the filtered rows. You will learn how to apply summary functions to only the filtered rows in Excel in an upcoming tutorial.
-
- Subsetting
- Selecting a specific portion of the data set based on specified criteria.
2a. Filtering Data for a Specific Analysis Purpose
Suppose you want to perform analysis using only documentaries. Perhaps you want to see which country documentaries were produced in the most. You could use filtering to assist you in finding this subset of data.
-
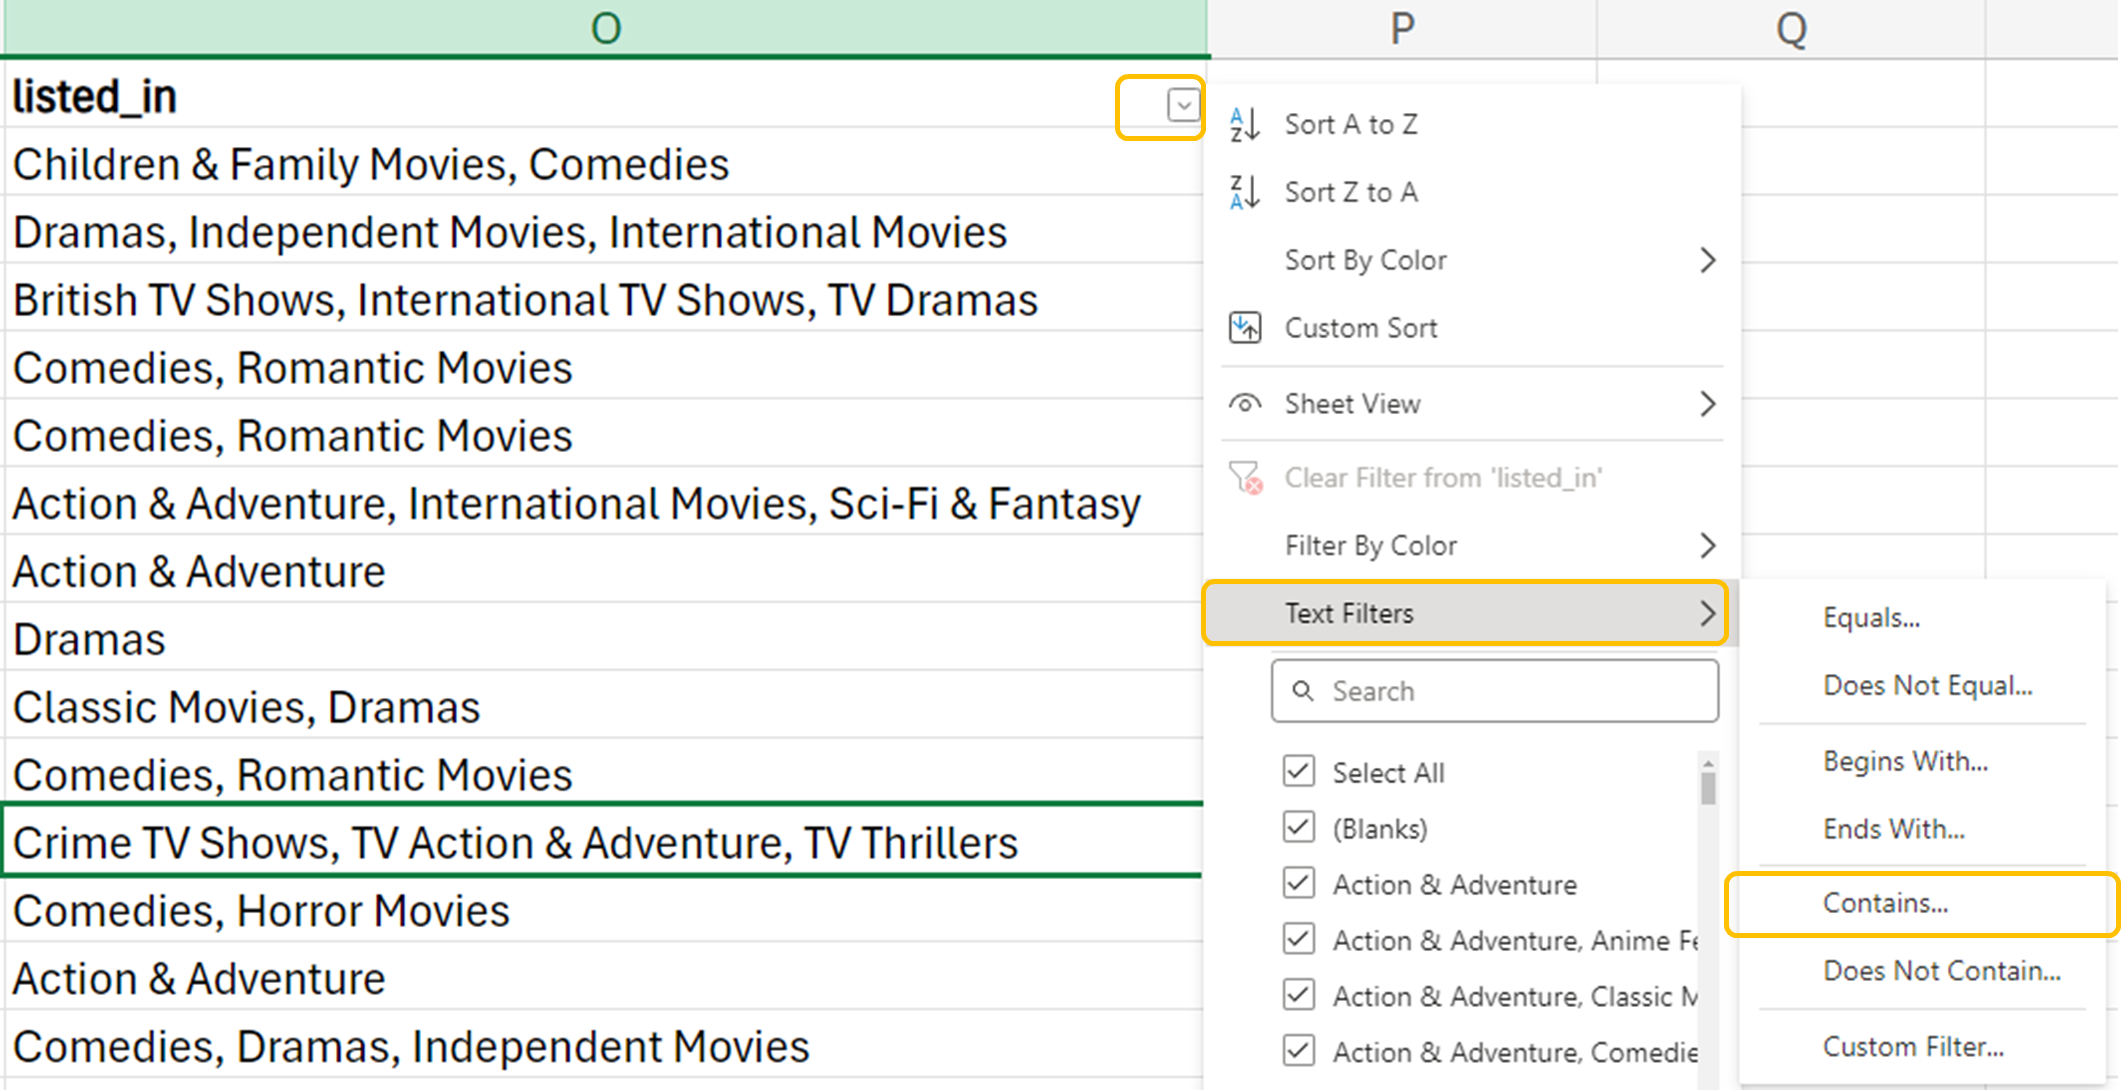
To focus an analysis on only documentaries, you can filter the values of the
listed_in column.
- Select the entire worksheet by clicking the Select All button on the top left corner of your sheet.
- Under the Data tab, select Filter. If you still have filtered data from the last step, select Clear to remove all active filters. If you opened a new netflix.xlsx workbook, be sure the Filter option is selected. This option will cause a drop-down arrow to appear at the right of each column heading.
- Navigate to the listed_in column and click on drop-down arrow to the right of the column. Hover your cursor over Text Filters, then click on Contains...
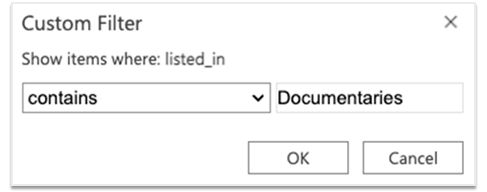
- You should now see the Custom Filter dialog box. Type the word Documentaries into the text box, then click the OK button.
- The data in the listed_in column should show a total of 9 results.
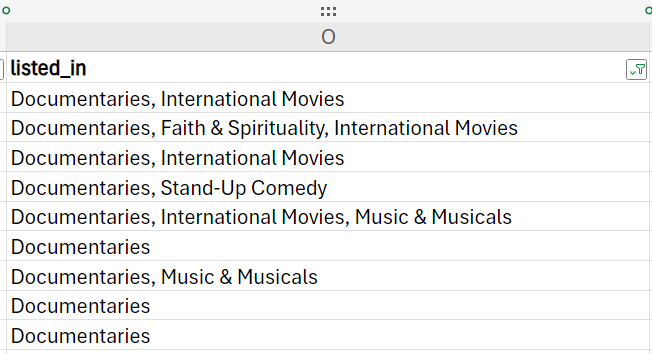
- Only these 9 entries containing the word Documentaries have been filtered from the data.
2b. Filtering Data for Simple Queries
When working with data, you may find occasion to want to filter your data, then sort the filtered data. For example, in the Netflix dataset, you may want to filter all documentaries, then sort by budget in ascending order.
To do this you would follow the steps to filter the data in the listed_in column, then follow the steps to sort the data using the budget column. The results would show all documentaries in order of their budget (largest to smallest).
Conversely, you can sort your data, then apply a filter.
-
You work for a marketing agency specializing in promoting action and adventure movies. As a data analyst for the company, they want you to identify 5-star rated action and adventure movies in the Netflix data. This information will help the marketing agency identify promising films to promote to their clients.
In this lesson, you learned how to sort and filter data in Excel using a real-world Netflix dataset. You examined sorting data to create a structured format that reveals patterns and insights, detecting data errors, and identifying outliers and simple queries. Additionally, you explored filtering data to isolate and display relevant rows based on specific conditions, focusing on specific analysis purposes, and simplifying the analysis process. Sorting helps structure your data to uncover insights, while filtering allows you to quickly focus on the most relevant information, saving time and streamlining your analysis.