Table of Contents |
A tangent line is a line that touches a graph at one specific point (but does not cross it).
EXAMPLE
The graph of and its tangent line at
  are shown below. Use this picture to estimate the slope of the tangent line.
 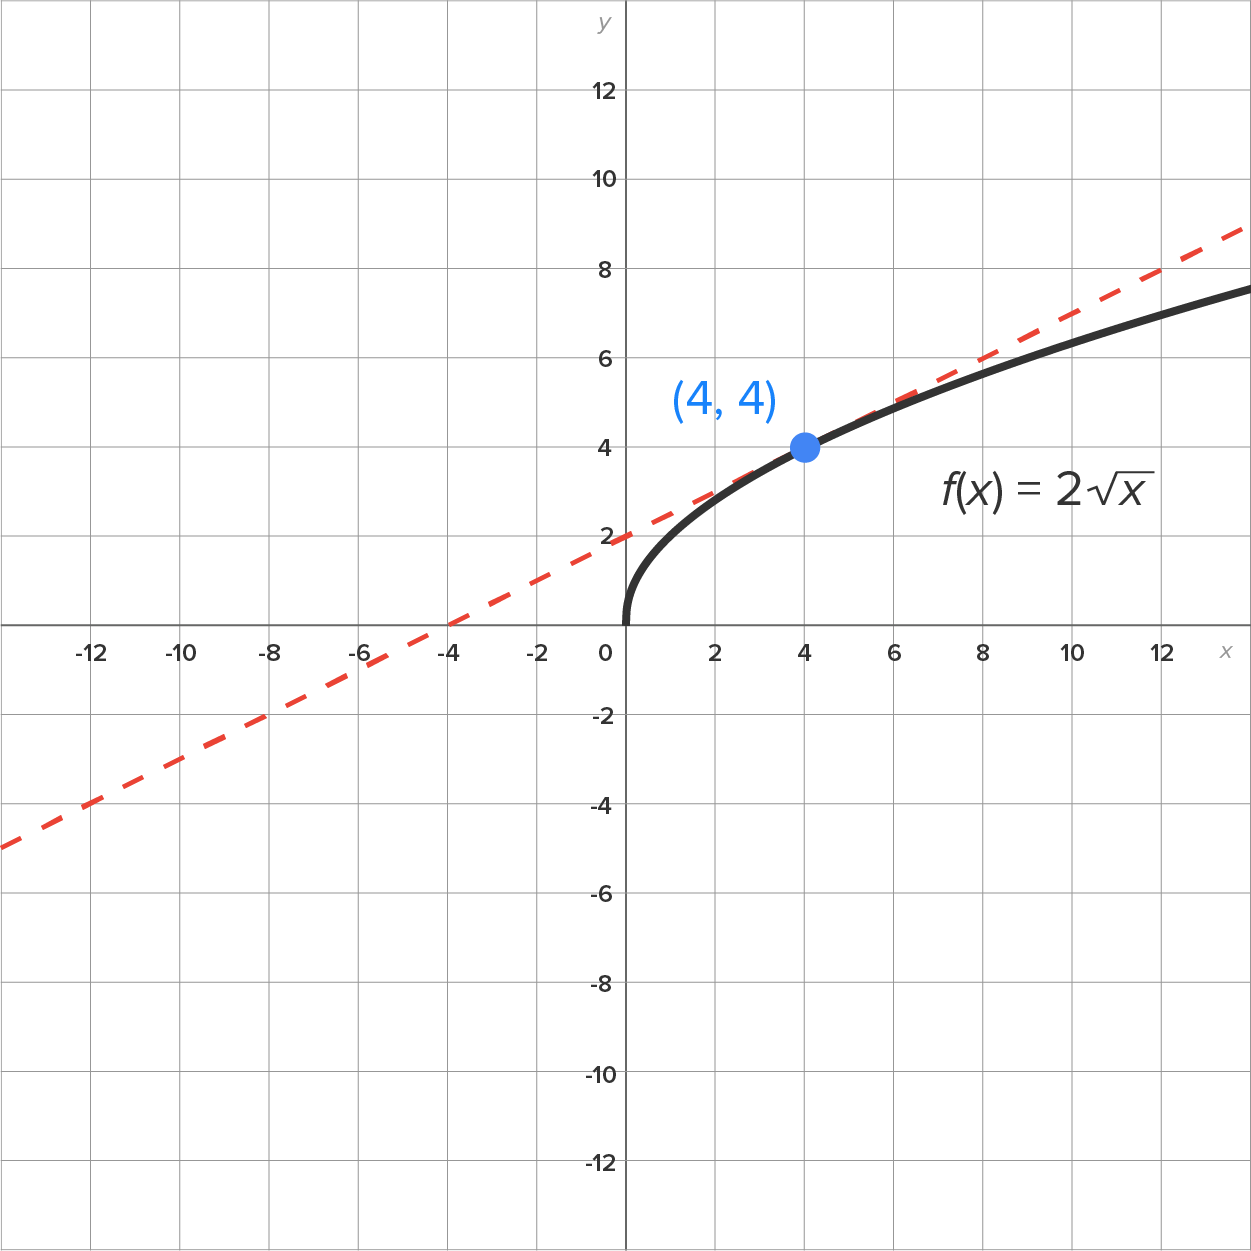 to estimate the slope of this line. Inspecting closely, it looks like the point
  is also contained on the line.
 In fact, this is the exact slope of the tangent line.
 do the following:

 to compute the slope of the line.
 below with its tangent line at the point

 and
and 
 and
and  the slope is
Tangent lines whose slopes are 0, also known as horizontal tangent lines, are very useful in calculus. It is important (and quite simple) to identify the places on a graph where the tangent line is horizontal.
EXAMPLE
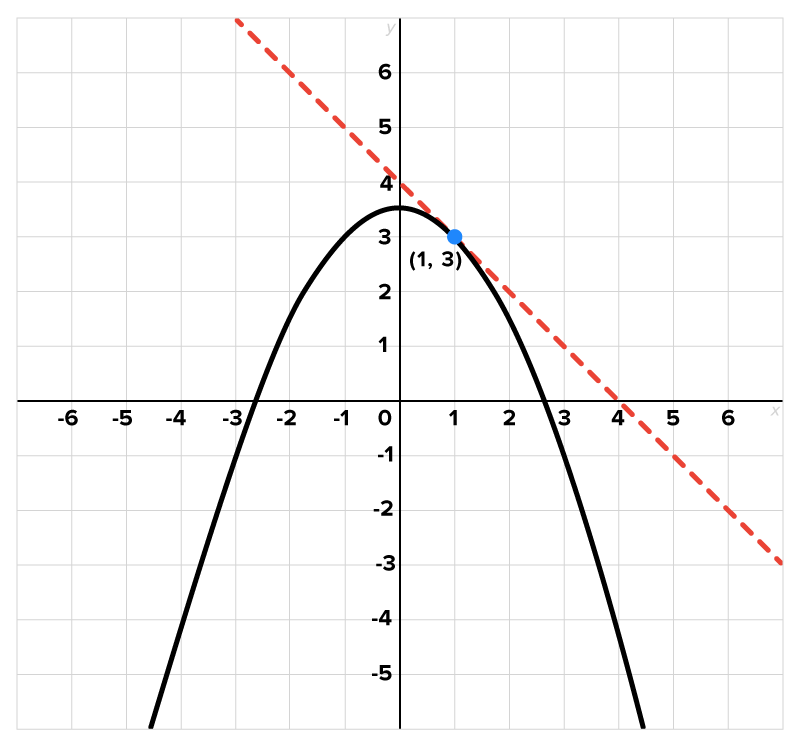
Estimate the slope of the tangent line to the curve at the point
  The graph of and its tangent line are shown here:
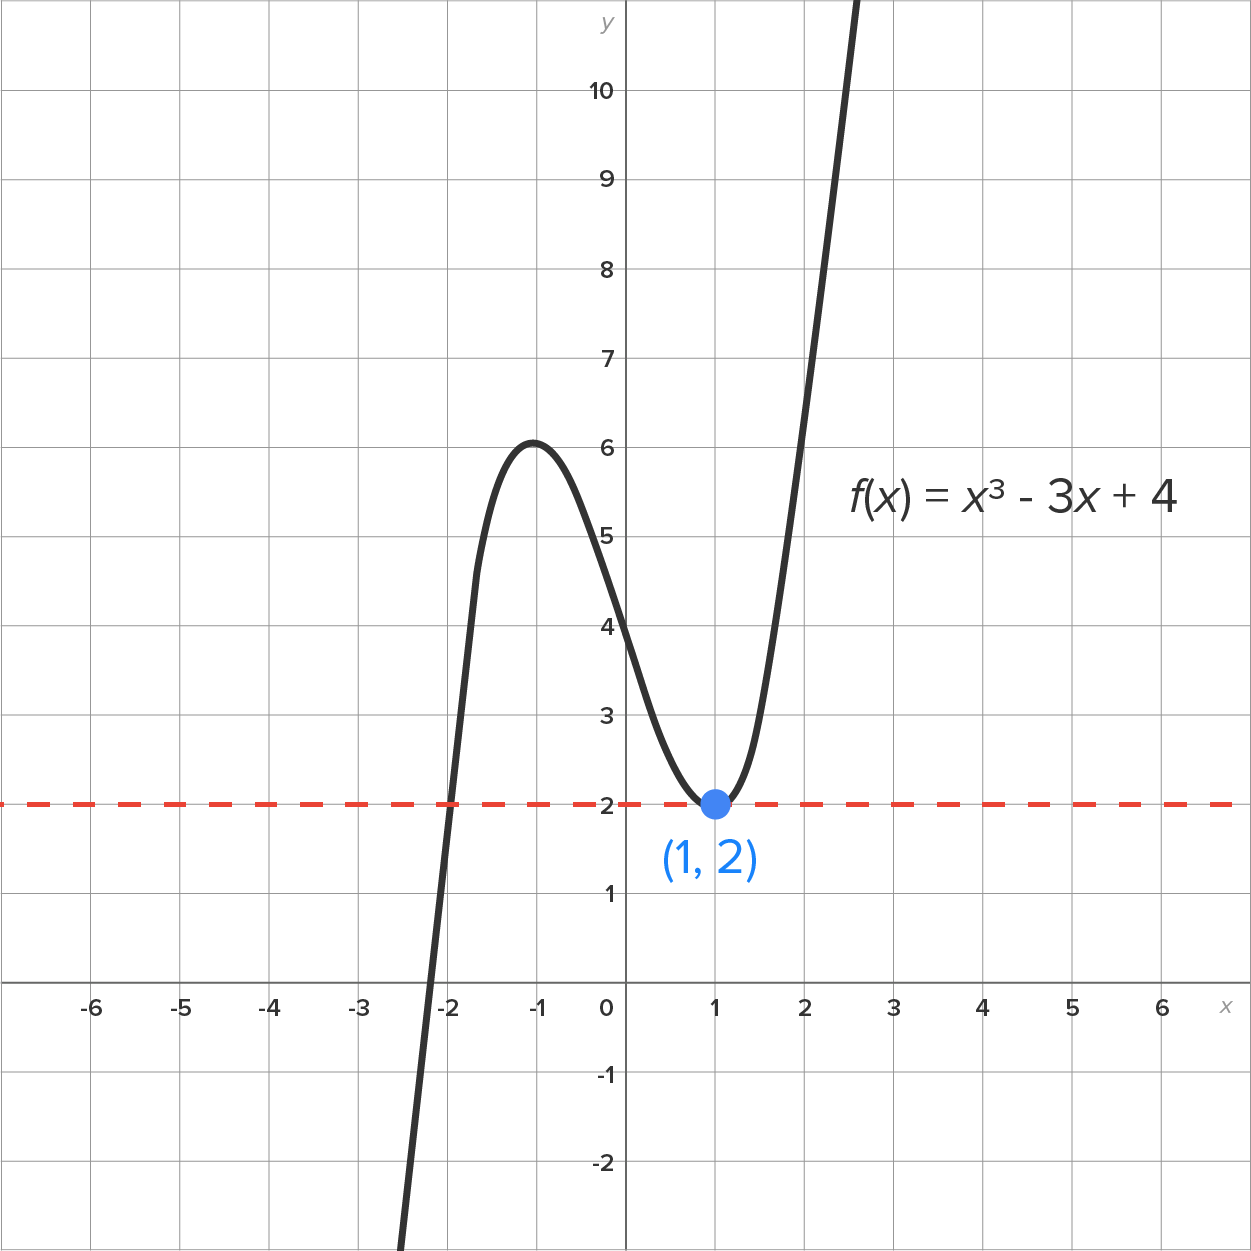
EXAMPLE
Estimate all values of x for which the graph of below has a horizontal tangent line.
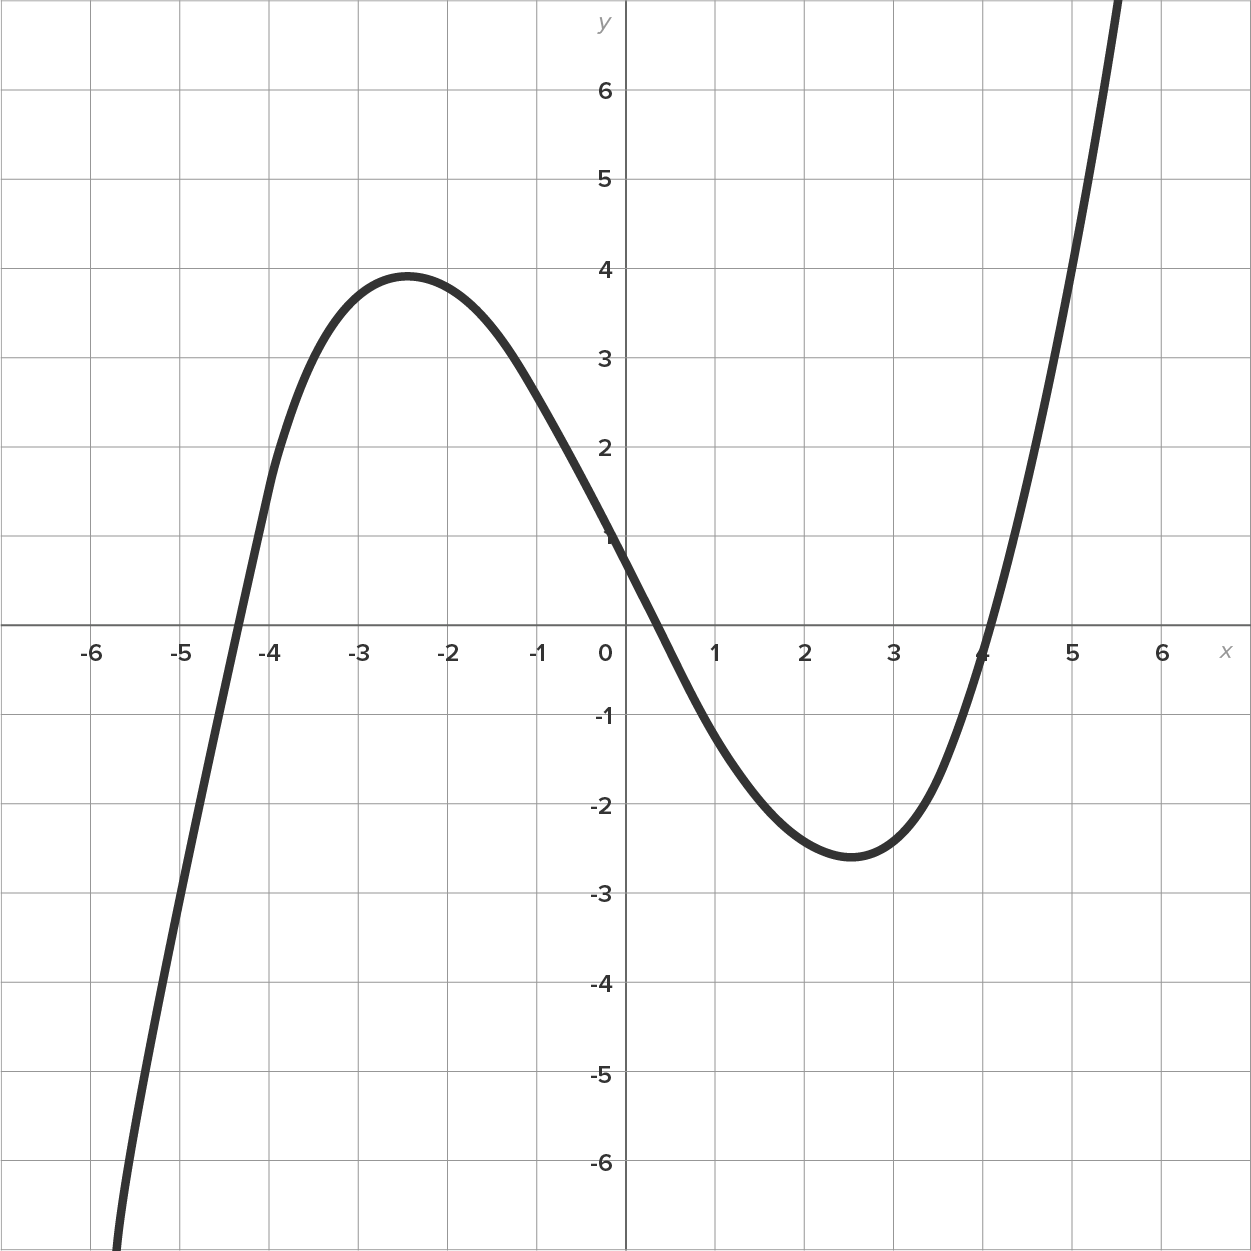
 and
and  .
.
Source: THIS TUTORIAL HAS BEEN ADAPTED FROM CHAPTER 0 OF "CONTEMPORARY CALCULUS" BY DALE HOFFMAN. ACCESS FOR FREE AT WWW.CONTEMPORARYCALCULUS.COM. LICENSE: CREATIVE COMMONS ATTRIBUTION 3.0 UNITED STATES.