Table of Contents |
Imagine that we are planning a trip from Chicago, IL to Knoxville, TN. The most direct flight covers a distance of 475 miles in 1 hour. Dividing distance by time, we get a speed of 475 miles per hour. This represents the average speed, or average rate of change in distance over change in time. In reality, the plane travels at varying speeds, particularly during take off and landing, but generally speaking, we say that the airplane travels at a speed of 475 miles per hour.
On a graph, we see that the average speed is represented by a straight line, while the actually path of the plane may be non-linear:
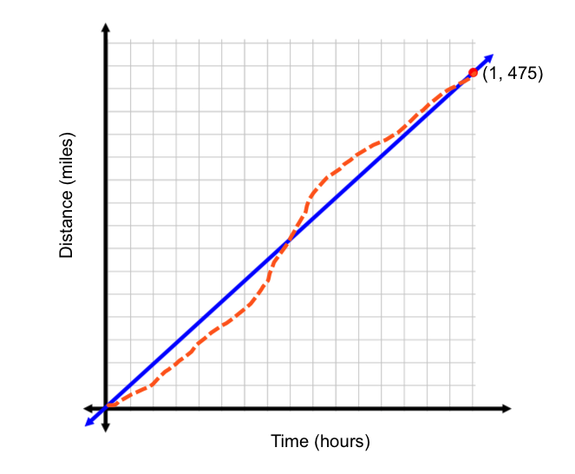
As we can see from the graph above, the average speed of the airplane is the slope of the line. Recall that the algebraic definition of slope is the change in y-values divided by the change in x-values. In this scenario, the change in y-values is 475, because the starting distance was 0 miles and the ending distance was 475 miles. Our change in x-values is 1, because at 0 hours we were at 0 miles traveled, and at 1 hour we were at 475 miles traveled.
EXAMPLE
Kristen is hiking on a local trail. While hiking, she decides to use her GPS to track her elevation. When she reaches mile marker 2, she measured her elevation at 4,100 feet. Once she reached mile marker 5, her elevation was now at 5,300 feet. Let's find the average change in elevation of Kristen's position from mile marker 2 to mile marker 5. , or 1,200 feet in elevation.
  .
.

|
Using the average rate of change formula for elevation and mile marker, plug in the known values |

|
Evaluate the numerator and denominator |

|
Divide the numerator by denominator |

|
Our solution |
 and
and  . Then we could have plugged that into the slope formula:

In the table below, we have one graph with a negative slope, a graph with a positive slope, and a graph with a slope of zero. Let's interpret the slope within the context that's provided by the information in the axes.
| Graph | Slope | Interpretation |
|---|---|---|
|
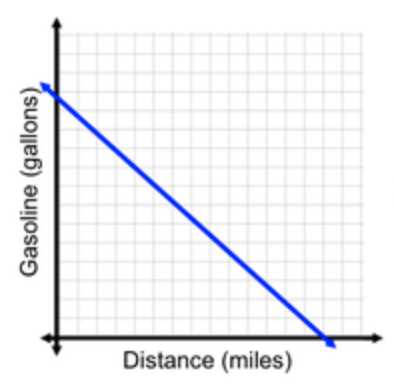
Negative slope | This graph shows a relationship between distance traveled and gallons of gasoline that a car has in its tank. The negative slope indicates that as the car continues to travel, fewer and fewer gallons of gasoline remain in the tank. We can interpret the y-intercept as the amount of gasoline the car started with, and the x-axis as the number of miles the car travels until it runs out of gas. |
|
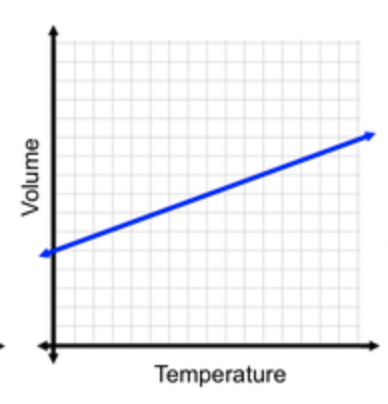
Positive Slope | This graph shows a relationship between the volume of an object and the temperature of its environment. The positive slope indicates that as the room temperature increases, or as the object gets warmer, it expands, increasing in volume. |
|
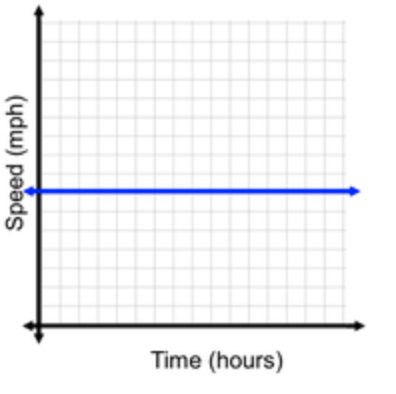
Zero Slope | This graph shows a relationship between the amount of time an object travels and its speed. The slope of zero indicates that there is no change in speed during the time interval recorded on this graph. We could perhaps interpret this graph as being a car on the highway set in cruise control. When a car is set in cruise control, its speed is locked and will continue to travel at a constant speed. With a constant speed, there is no change in speed from one time interval to the next. |
Source: THIS TUTORIAL HAS BEEN ADAPTED FROM "BEGINNING AND INTERMEDIATE ALGEBRA" BY TYLER WALLACE. ACCESS FOR FREE AT www.wallace.ccfaculty.org/book/book.html. License: Creative Commons Attribution 3.0 Unported License