Use Sophia to knock out your gen-ed requirements quickly and affordably. Learn more
×

Shifts in Supply

Author: Sophia

1. Law of Supply: A Review

In review, the law of supply states that if the price of a good decreases, the quantity supplied will decrease. It works the other way as well—when the price of a good increases, so does the quantity supplied.

There is a positive relationship between price and quantity with supply. Therefore, a movement along the supply curve is caused by a change in price, assuming that everything else is held constant, defined as “ceteris paribus.”

Here is the supply schedule and supply curve for a farmer’s willingness to supply apples.

Price of Granny Smith Apples Quantity of Granny Smith Apples Each Week
$2.00 7
$1.75 6
$1.50 5
$1.25 4
$1.00 3
$0.75 2
$0.50 1
$0.25 0

A graph showing a single supply line for apples. The x-axis represents the quantity of apples in thousands of bushels, marked in increments of 1 from 0 to 7. The y-axis represents the price per apple in dollars, marked in increments of 0.25 from 0 to 2. A line slopes upward, passing through three labeled points: (0, 0.25), (3, 1.00), and (7, 2.00). Each point is marked with a dot and labeled on the graph.


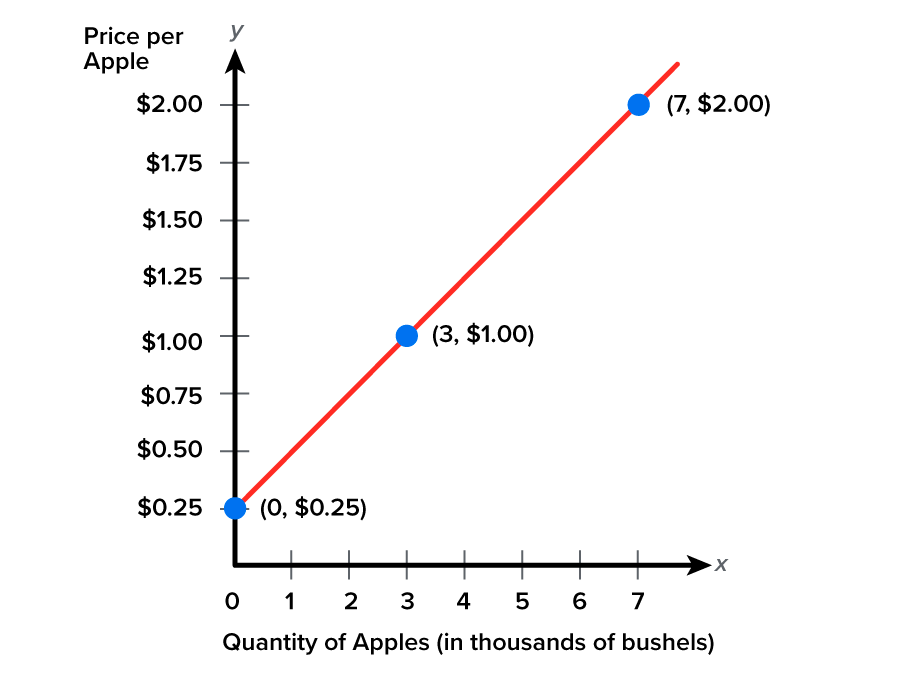
You can see that as the price of the apples goes up, he is willing to supply a greater quantity (in thousands of bushels). Notice, too, that as the price goes up, we move along the curve to the right.

As the price falls, the quantity he is willing to produce also falls with it, with a corresponding move down and to the left along the supply curve.

Again, there is a positive relationship between price and quantity where they move in the same direction; so, as the price changes, we simply move along the curve. We do not need a new curve.

A graphic showing the capital letters P and Q, each followed by a large downward-pointing arrow, indicating that both price (P) and quantity (Q) are decreasing.

As mentioned, the law of supply and ceteris paribus tell us that as the price of apples falls, we can expect farmers to supply fewer apples, holding everything else constant.

This assumes, then, that only the price of apples has changed. For instance, the price of their resources or inputs has not changed, so fertilizers have not become more expensive. Their technology for growing apples has not changed either—just the price of apples.

terms to know
Law of Supply
If the price of a good decreases, the quantity supplied will decrease.
Movement Along the Supply Curve
Movement caused by a change in price, assuming all other variables are held constant.


2. Shifts in Supply

However, in the real world, we know that things change all the time. What if fertilizers become more expensive, or if farmers have to pay their workers more money because the wages have risen? What if a new technology is developed for apple picking that makes it much more efficient?

Will farmers still supply the same amount of apples if these things happen? Obviously not. In this case, they will not supply a different quantity because of a price change; they will do so for another reason.

If there is an increased cost to the farmer because of an increase in labor cost, or a higher cost of fertilizers, notice what will happen to his numbers. At all of these prices, he supplies a lower quantity of apples.

Price of Granny Smith Apples Quantity of Granny Smith Apples Each Week
$2.00 5
$1.75 4
$1.50 3
$1.25 2
$1.00 1
$0.75 0
$0.50 0
$0.25 0

Now, the farmer supplies less, but it is not because the price fell, so we are not able to find that price–quantity relationship along the original supply curve. We cannot simply move along that curve to find a new relationship. We need a new supply curve.

A graph that shows a leftward shift in the supply curve due to increased costs to farmers. The x-axis represents the quantity of apples, in thousands of bushels. This axis is marked in increments of 1, starting at 0 and ending at 7. The y-axis represents the price per apple in dollars. This axis is marked in increments of 0.25, starting at 0 and ending at 2 dollars. A supply line passes through three labeled points, (0, 0.25), (3, 1.00), and (7, 2.00), marked with dots. A second line appears to the left of the original, parallel to it, indicating a decrease in supply. An arrow points leftward between the two lines to visually represent this shift. The graph is titled ‘Effects of Increased Cost to Farmers’.

There is a completely different relationship now between the price and the quantity that the farmer is able and willing to supply. This is what we mean when we say there has been a shift in the supply curve.

hint
Note that, in this example, a shift to the left is a decrease in supply, because the farmer is willing and able to supply fewer apples at every price.

Therefore, a shift in supply is defined as any change other than the price of the good itself that affects production decisions for a particular good.

term to know
Shift in Supply
Any change other than the price of the good itself that affects production decisions for a particular good.


3. Causes of Shifts in Supply

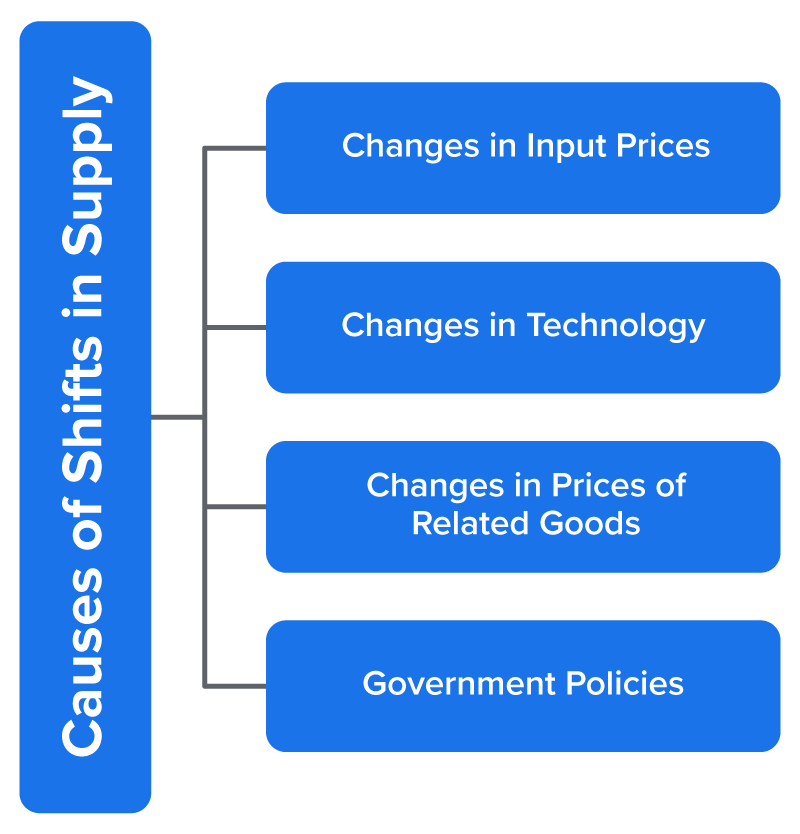
Here is a summary of the factors that can impact producers and cause a shift in supply; we will discuss each of them in further detail.

A diagram listing four causes of shifts in supply. The left side of the image has a vertical box with the heading ‘Causes of Shifts in Supply’. From it, four horizontal rectangles extend outward, each listing a cause: ‘Changes in Input Prices’, ‘Changes in Technology’, ‘Changes in Prices of Related Goods’, and ‘Government Policies’. Thin connecting lines link the causes to the heading box.

hint
Keep in mind that anything that makes it easier or less expensive to produce something will create an increase in supply and shift the curve to the right. Anything that makes it more difficult or more expensive to produce something will cause a decrease in supply and a shift in the supply curve to the left.

3a. Changes in Input Prices

Again, this supply graph shows the impact of a change in input price. The price of apples has not changed. However, if fertilizers become more expensive, it would also make them more expensive for the farmer. Therefore, he will supply fewer apples at all prices, which represents a decrease in supply.

A graph that depicts the effects of increased cost to farmers. The x-axis represents the quantity of apples in thousands of bushels. This axis is marked in increments of 1, starting at 0 and ending at 7. The y-axis represents the price per apple in dollars. This axis is marked in increments of 0.25, starting at 0 and ending at 2 dollars. A supply line passes through three labeled points: 0, 0.25 dollars; 3, 1.00 dollars; and 7, 2.00 dollars. A second line appears to the left of the original, parallel to it, indicating a decrease in supply due to higher input costs. An arrow points leftward between the two lines to represent the shift.
Price of apples did not change but fertilizer got more expensive. This makes it more expensive for the farmer so he will supply fewer apples at all prices now.

big idea
Increase in Input Price = Decrease in Supply.
Decrease in Input Price = Increase in Supply.

An increase in input prices causes a decrease in supply because production has become more expensive. A decrease in input price, like cheaper land, labor, or capital, will create an increase in supply, shifting the curve to the right instead.

3b. Changes in Technology

Now, if the technology for apple growing or apple picking improves, then farmers will be able to supply apples more efficiently. They will supply a greater quantity at all prices.

Therefore, an increase in technology will create a shift to the right or an increase in supply, as shown below. Conversely, a failure of technology can certainly decrease the supply.

A graph that depicts the impact of improved technology on supply. The horizontal x-axis represents the quantity of apples in thousands of bushels. This axis is marked in increments of 1, starting at 0 and ending at 7. The vertical y-axis represents the price per apple in dollars. This axis is marked in increments of 0.25, starting at 0 and ending at 2 dollars. A supply line passes through the following points: x equals 0 and y equals 0.25 dollars, x equals 3 and y equals 1 dollar, and x equals 7 and y equals 2 dollars. A new supply line appears to the right, parallel to the original, indicating an increase in supply due to better technology. An arrow between the lines points to the right to show the shift.
If technology improves for apple growing or apple picking, then this will make farmers able to more efficiently supply apples. They will supply more at all prices now.

big idea
Increase in Technology = Increase in Supply.
Decrease in Technology = Decrease in Supply.

3c. Changes in Prices of Related Goods

Next, we will discuss the impact of changes in the prices of related goods, focusing on substitutes and complements in production.

  • Substitutes in production and consumption are goods that you buy instead of another one with regard to consumption, but in production, they are a bit different, as you will see.

EXAMPLE

Now, if the market price of apples goes up, we know that the law of supply tells us that the quantity supplied for apples will increase, demonstrated by moving along the supply curve to the right. However, let’s talk about a substitute in production. Perhaps pear growing and apple growing can be substituted with each other. If apples are more expensive in price, maybe some pear farmers may actually decide to plant apples instead of pears because they can make more money as apple farmers.

Therefore, the supply of pears will actually shift because farmers will plant fewer pears when the price does not change for pears. It follows that the supply curve for pears will shift to the left as a decrease, all because the price of apples has gone up. Pears can be seen as a substitute for apples in production.

For substitutes in production, when the price of a substitute in production increases—like apples going up in price—the supply of the other good will actually decrease—in this case, pears.

  • Complements in production and consumption are things that go together. Again, this lesson’s definition focuses more on the consumption end of it, but in production, it will be a bit different. So, many farmers produce two products because one is a by-product of the others.

EXAMPLE

Wheat and hay are complements in production, as are beef and leather. If the price of wheat goes up, according to the law of supply, we know that this will cause a change in the quantity supplied for wheat or movement along the wheat curve. Farmers will produce more wheat, but only because the price has gone up.

Now that they are producing more wheat, though, they will also produce more hay. Hay has not gone up in price, yet farmers are supplying more at all prices. This, then, indicates a change in the supply of hay or a shift of the supply curve for hay to the right.

Therefore, for complements in production, when the price of a complement in production increases, the supply of the other good will increase.

terms to know
Substitutes in Production and Consumption
As the price of one good increases, the supply for an alternative good in production decreases.
Complements in Production and Consumption
As the price of one good increases, the supply for a complement in that production process increases.

3d. Government Policies

Briefly, government policies, such as subsidies and taxes, can also impact a producer’s ability to supply.

3e. Producers’ Expectations Regarding Price (Cost of Factors of Production) and Industry Health

Producers, in most cases, will withhold some of their inventory from the market if they expect the price of their product to increase. If they expect the price of the products to decrease, they will empty their inventory.

When the cost of production—interest rate, labor, rent, and raw materials—becomes more expensive, this negatively affects the profit margin of the producer, shifting the supply curve inward/leftward.

When the cost of production becomes less expensive, this positively affects the profit margin of the producer, shifting the supply curve outward/rightward.

EXAMPLE

If an industry is perceived by industry experts to be profitable, companies may expand production, shifting the supply curve outward/rightward. For instance, from 2023–2027, the microchip industry is expected to be profitable, so Nvidia may expand production. If an industry is expected to face challenges (due to declining demand, new government regulations, or the like), companies will cut back on production.

3f. Number of Sellers in the Market

The number of sellers in an industry will impact the supply of the industry’s product. More sellers will shift the supply curve outward, and fewer sellers will shift the supply curve inward.

3g. Climate Impacts

Both the political climate and the weather can result in an outward or inward shift in the supply curve.

Favorable political conditions, political stability, government subsidies, and incentives to a particular industry will shift the supply curve outward or rightward and vice versa.

Good weather for agriculture, predictable climate, and zero natural disasters will shift the supply curve outward or rightward and vice versa.

3h. Higher Educational Quality

A higher educational level within the labor force will bring about improved innovation and skills specialization, which will shift the supply curve rightward/outward, and vice versa.

big idea
The bottom line is to be able to differentiate between the quantity supplied and the change in supply. A change in the price of a good will cause a change in the quantity supplied or cause movement along the curve, just as it does with demand. A change in any other factor can shift the supply curve, which is when we can say that there has been a change in supply, meaning an increase or decrease in supply. It is important to keep in mind that different situations will shift the curve more than others.

summary
We started today’s lesson with a review of the law of supply, recalling how movement along a supply curve is due to a change in the price of that good. We also learned that a shift of the supply curve, or a shift in supply, is caused by a change in any other variable that can impact suppliers’ ability to produce or their cost of production. These causes of shifts in supply include changes in input prices, changes in technology, changes in prices of related goods like substitutes and complements in production, government policies, producers’ expectations regarding price and industry health, number of sellers in the market, climate impacts, and higher educational quality.

Source: THIS TUTORIAL WAS AUTHORED BY KATE ESKRA FOR SOPHIA LEARNING. PLEASE SEE OUR TERMS OF USE.

Terms to Know
Complements in Production and Consumption

As the price of one good increases, the supply for a complement in that production process increases.

Law of Supply

If the price of a good decreases, the quantity supplied will decrease.

Movement Along the Supply Curve

Movement caused by a change in price, assuming all other variables are held constant.

Shift in Supply

Any change other than the price of the good itself that affects production decisions for a particular good.

Substitutes in Production and Consumption

As the price of one good increases, the supply for an alternative good in production decreases.