Table of Contents |
Before we begin, let’s review the law of demand, which is defined as the inverse or negative correlation between price and quantity with all other variables fixed.
Here is the demand schedule and demand graph for Granny Smith apples.
| Price of Granny Smith Apples | Quantity of Granny Smith Apples Each Week |
|---|---|
| $2.00 | 0 |
| $1.75 | 1 |
| $1.50 | 2 |
| $1.25 | 3 |
| $1.00 | 4 |
| $0.75 | 5 |
| $0.50 | 6 |
| $0.25 | 7 |
| $0.00 | 8 |
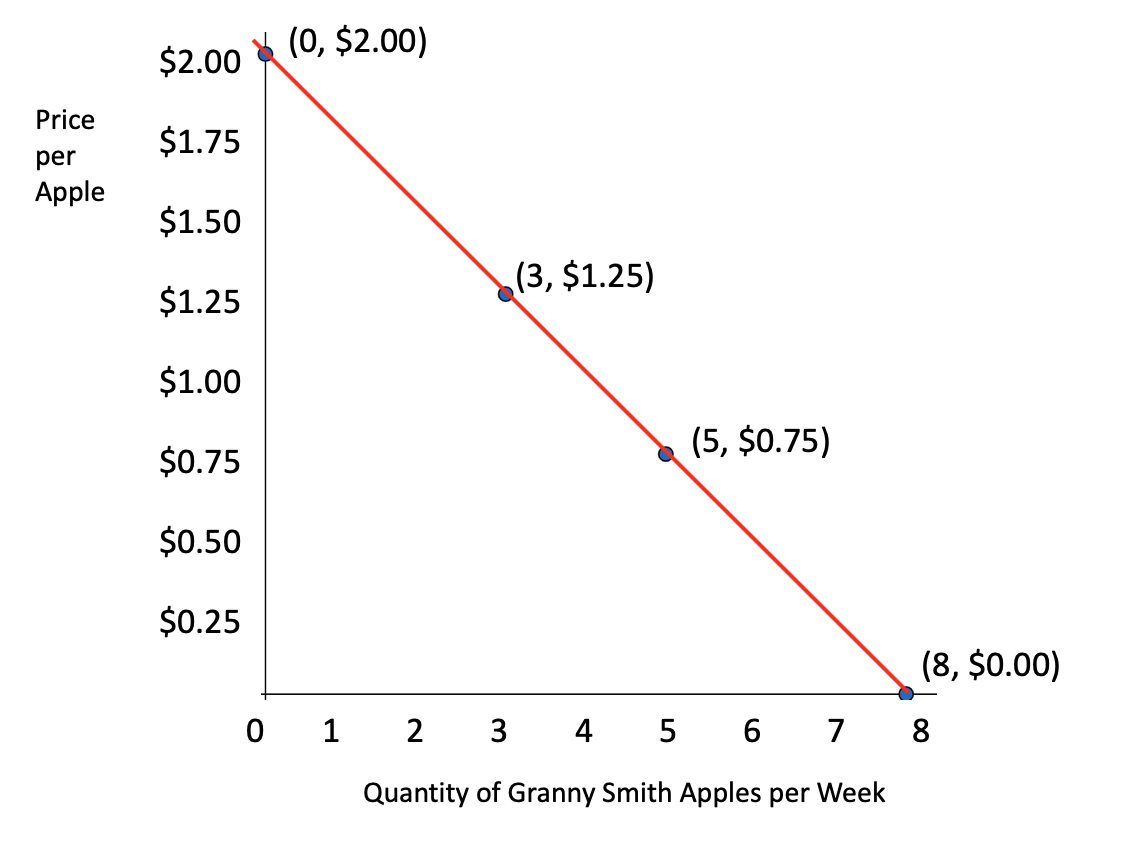
Notice that when the price is high at $2 per apple, you do not want to purchase any apples at all. However, as the price falls, you want to purchase more and more. At $1.50, you may buy two apples a week; if the price were only $0.50 an apple, you would purchase six, and if they were $0.25, you would purchase seven. Now, if the apples were free, you would be likely to eat more than one apple a day, so you would buy eight in a week.
When we plot the points of the demand schedule on a graph with price on the y-axis and quantity on the x-axis, we get the demand curve.
Notice that the law of demand suggests a negative or inverse relationship between price and quantity. As the price of Granny Smith apples falls, you will purchase more. As the price rises, you will purchase less. Therefore, as the price changes, we move along the demand curve.
The price change is the only reason you purchase more. For instance, you would purchase six apples only because they each cost $0.50. If their price went up, you would purchase fewer apples.

Now, this only describes the relationship between price on the y-axis and quantity on the x-axis. These are the only two variables, so we can only move along the demand curve to show the relationship between price and quantity.
Therefore, this represents a change in the quantity demanded, not a change in demand itself. You would not say that if the price of apples went up, you would demand less. Rather, you would say that since the price of apples went up, the quantity you demand would decrease.
Movements along the demand curve are demonstrated when the price of the product changes and impacts the quantity demanded.
Now, the law of demand governing these movements along the demand curve assumes ceteris paribus, holding everything else constant, although this is not always the case.
As mentioned, when the price of Granny Smith apples goes up, we can expect people to buy fewer Granny Smith apples. However, ceteris paribus assumes that only the price of Granny Smith apples—and nothing else—has changed.
The price of Gala apples did not change, nor did the price of other substitutes for apples like oranges or bananas. Your income did not change either—only the price of Granny Smith apples did.
Now, what if something else does change, as it very often does? Suppose you have to take a significant pay cut or you read an article stating that Granny Smith apples are the least healthy type of apples. Will you still buy the same amount of Granny Smith apples? Will the relationship between price and quantity be the same?
The answer is no.
So, here is a new demand schedule for Granny Smith apples. Notice that compared to our original demand schedule, the numbers are totally different at the same prices.
| Price of Granny Smith Apples | Quantity of Granny Smith Apples Each Week |
|---|---|
| $2.00 | 0 |
| $1.75 | 0 |
| $1.50 | 0 |
| $1.25 | 0 |
| $1.00 | 1 |
| $0.75 | 2 |
| $0.50 | 3 |
| $0.25 | 4 |
| $0.00 | 5 |
Before, you were willing to purchase an apple when they were $1.75 each. Now that you took a pay cut, however, you cannot afford Granny Smith apples at that price. Alternatively, you may be concerned that Granny Smith apples are unhealthy, so you will buy fewer apples at all prices.
When we plot these new points, notice that we cannot simply move along the original demand curve. There is an entirely different relationship between price and the quantity being bought.
You are not buying fewer apples because the price went up; you are buying fewer because something else changed. You are buying a different quantity at every price. Therefore, a new demand curve is needed.
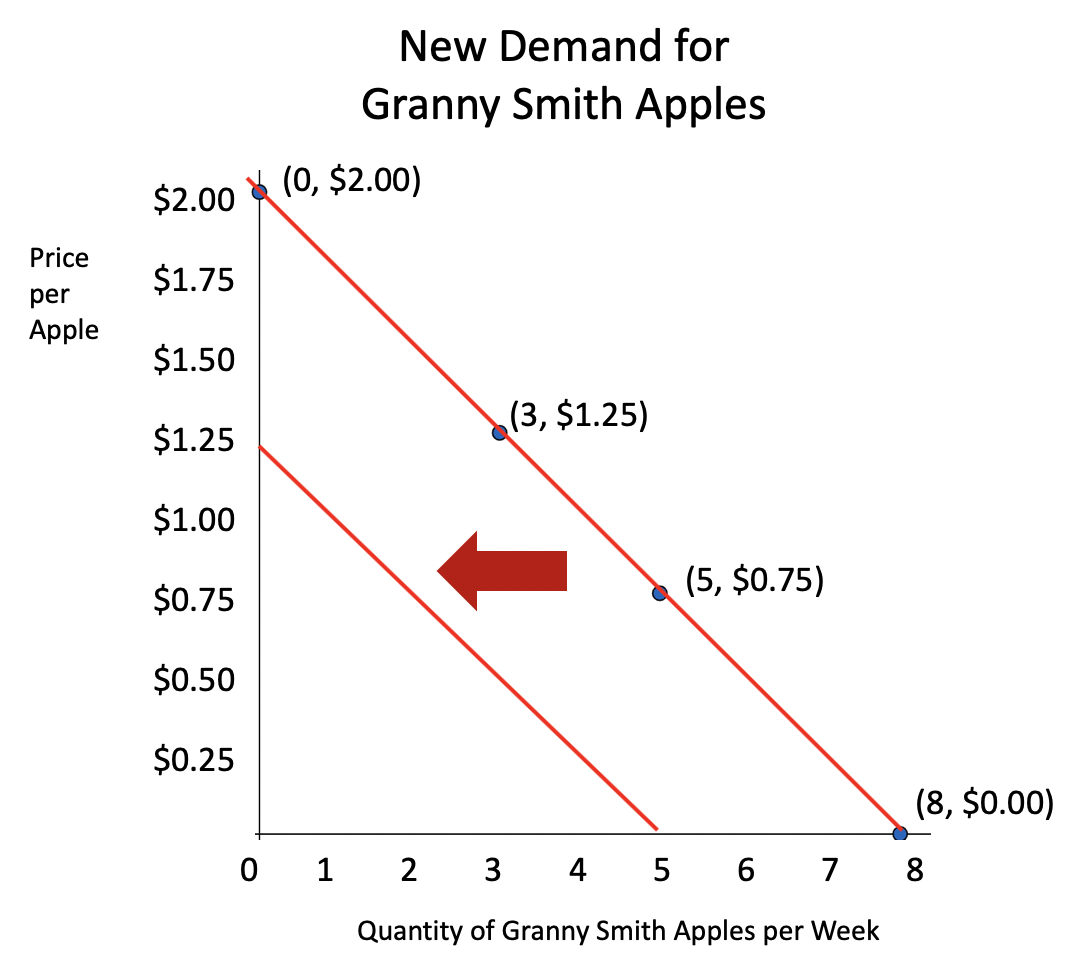
This represents a shift in demand, which is a change in something other than price that affects the purchasing behavior.
What is the difference between a change in demand and a change in quantity demanded? The change in quantity demanded is the upward and downward movement along the same demand curve. It occurs because of a change in the price of a particular good or service. This change is generally due to a change in the price of the good or service.
The change in demand is the shift of the demand curve on the graph. This can be an outward shift, meaning more demanded at all prices, or an inward shift, meaning less demanded at all prices. A change in demand occurs due to changes in various goods and services that don’t relate to price.
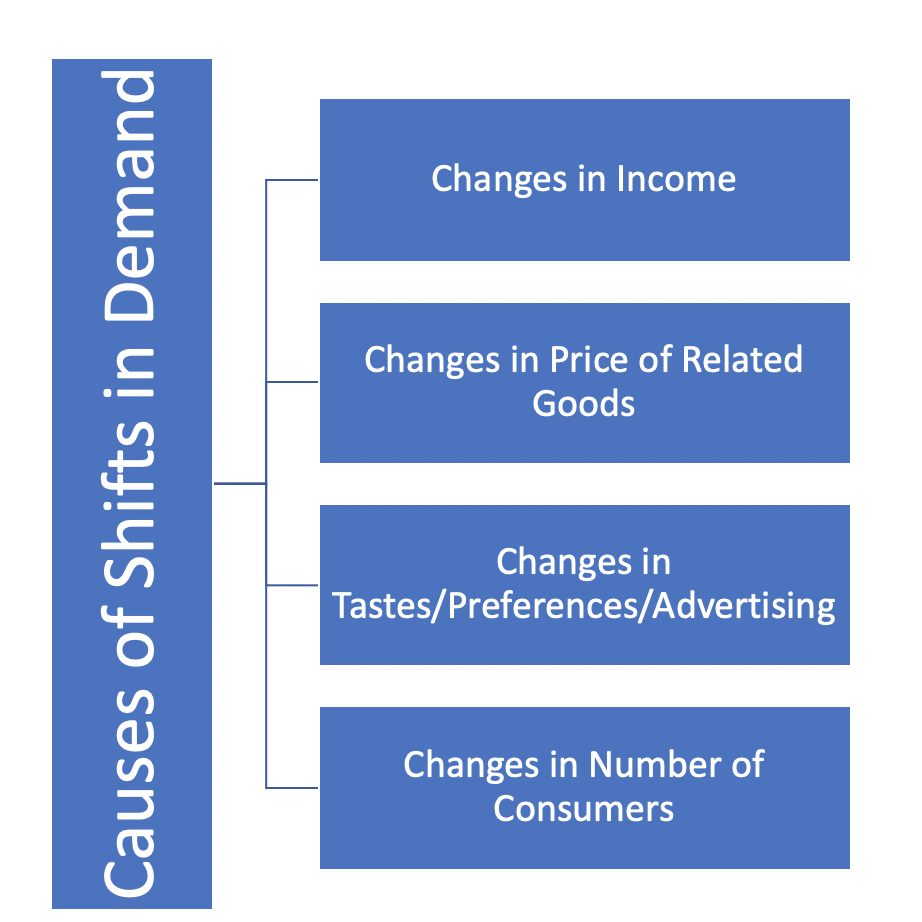
The causes can include the following:
| Change in Demand | Change in Quantity Demanded | |
|---|---|---|
| Definition | Shift of the demand curve in the demand graph | Movement of the point of demand on a demand curve |
| Cause | Change in nonprice factors associated with the product | Change in the price of the product |
| Curve Movement | Outward/rightward or inward/leftward shifts in the demand graph | Upward or downward movement along a demand curve |
Here is a summary of the factors that cause a shift in demand. We will cover each of these in further detail:
Changes in income can impact how much of the things we buy. We can decide to buy more of most goods (known as normal goods) as our income goes up, but there are some items, like generic brands, that we actually buy less of as our income increases.
Let’s refer to the graph illustrating a decrease in demand. Remember, the price of Granny Smith apples did not change. However, if you make less money, you cannot afford as many, and you will buy fewer apples at all prices. Therefore, demand shifts to the left.
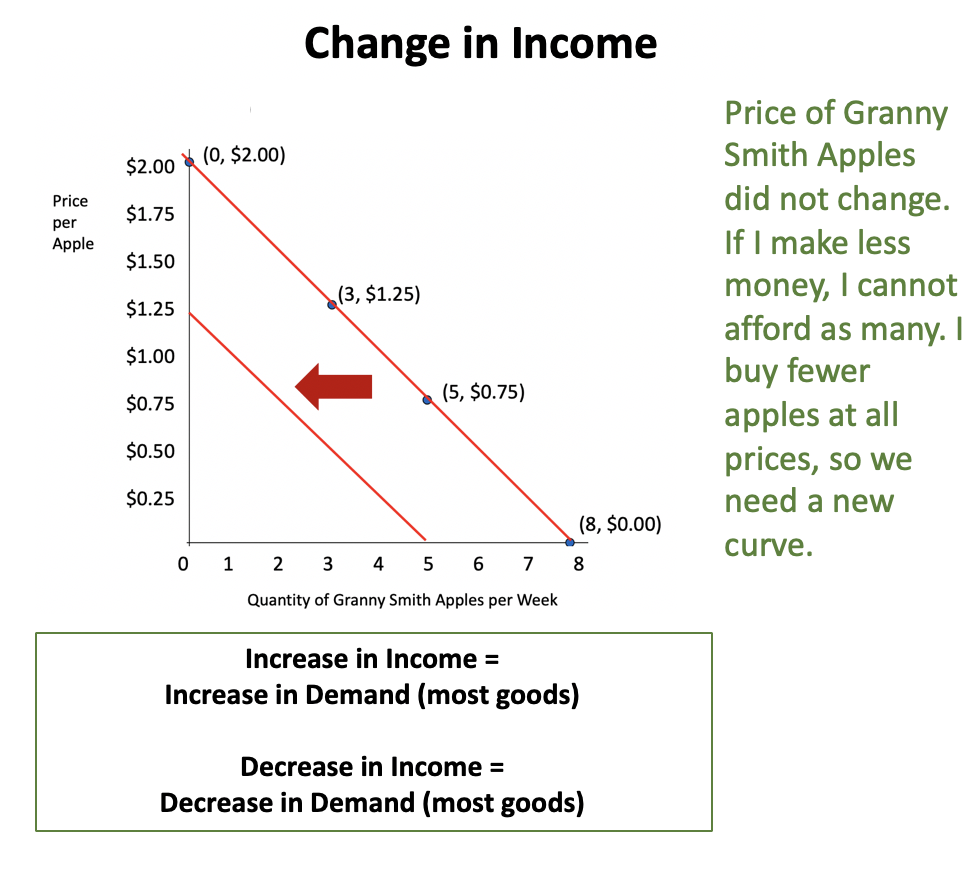
For most goods, meaning normal goods, an increase in income will cause an increase in demand, while a decrease in income will cause a decrease in demand.
Now, the opposite is true for some goods, called inferior goods—such as generic brands—whereby an increase in income will cause us to buy fewer of them, while a decrease in income will cause us to buy more of them.
Changes in the prices of related goods are another factor that will shift the demand curve. For instance, if something related to Granny Smith apples changes in price, this can affect how many Granny Smith apples you buy, even though the price of Granny Smith apples did not change.
EXAMPLE
If Granny Smith apples are the only type of apple that becomes more expensive, the quantity of apples demanded will decrease, which is expressed as movement along the Granny Smith apple demand curve. However, how do consumers respond?EXAMPLE
Suppose you eat apples and caramel apple dip together. If the caramel apple dip goes on sale, you will buy more of it, which is expressed as movement along the demand curve for caramel apple dip. However, even though the price of apples has not changed, you will also buy more apples to go with your caramel apple dip. This represents a change in the demand for apples, or a shift of the demand curve to the right, because the price of apples has not changed, yet you are buying more of them.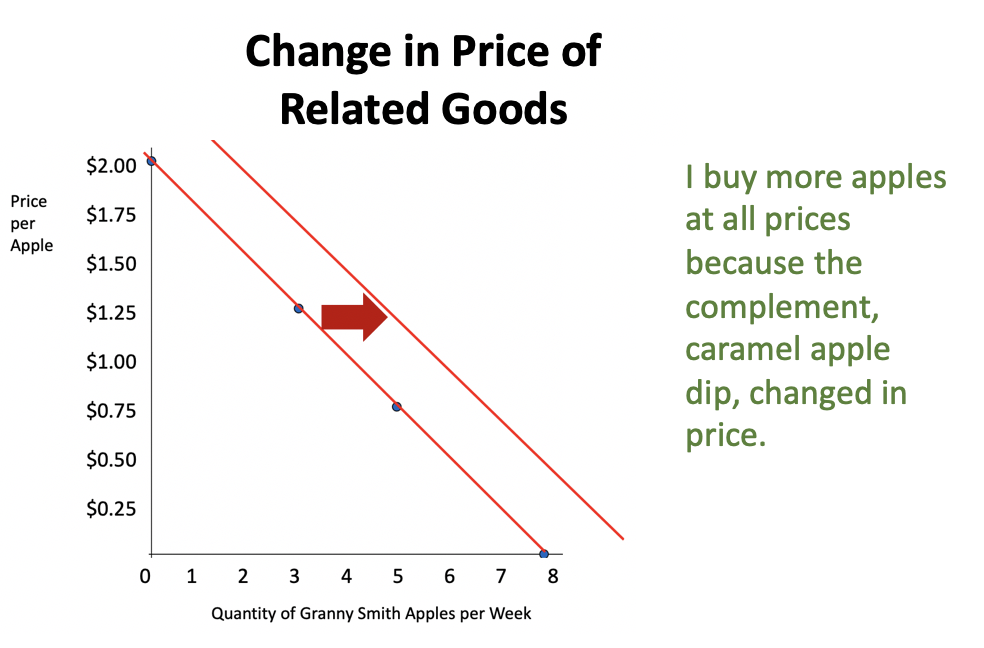
Changes in tastes and preferences are impacted by things like positive or negative news reports. If there is a good news report about a product—or if there are fads or strong advertisements—this displays an increase in demand for that product.
EXAMPLE
The child’s toy Tickle Me Elmo was featured on a popular television show, so every parent in the market wanted to purchase it for their child, resulting in a massive increase in demand.Negative news reports or fads going out of style result in a decrease in demand.
EXAMPLE
Suppose you hear on the news tonight that there was an E. coli outbreak in spinach in your local area. At all prices, people will purchase less spinach, which is a decrease in demand.If the number of consumers in a market changes, it will obviously impact the demand for something.
Finally, when buyers anticipate that there will be an increase in the price of goods and services, this will lead to an increase in the current demand for the goods and services.
EXAMPLE
If a student in California knows they will be flying home to New York for the Thanksgiving break, the student will anticipate that flight tickets a week or two before Thanksgiving would be expensive. Therefore, the student would buy their ticket weeks in advance to save on the cost of traveling home for the holidays (price increase expectation).EXAMPLE
When Apple releases a new product, during the first 6–12 months, the price of the new product is high. The price of the same product would drop significantly over time and as the company plans to release newer products (price decrease expectation).Source: THIS TUTORIAL WAS AUTHORED BY KATE ESKRA FOR SOPHIA LEARNING. PLEASE SEE OUR TERMS OF USE.