Table of Contents |
A distribution is a way to visually show how many times a variable takes a certain value.
While distributions display the values the variable takes and how often, shape describes the data points as a whole. This tutorial will use qualifying descriptors to identify how the distribution of a data set can look when graphed.
A symmetric distribution will have the same mean as its median. If plotted, it will look like two mirror images on the same plot.
The figure below shows three examples of symmetric distributions.
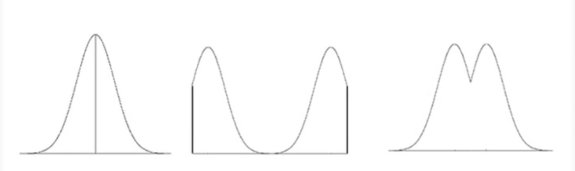
In the graph on the far left, for example, the line in the center of the graph is the mirror line, and it represents both the mean and the median of this distribution.
Symmetrical distribution doesn't happen too often. Only a few distributions are actually truly symmetric. Often, we get distributions that look something like this:
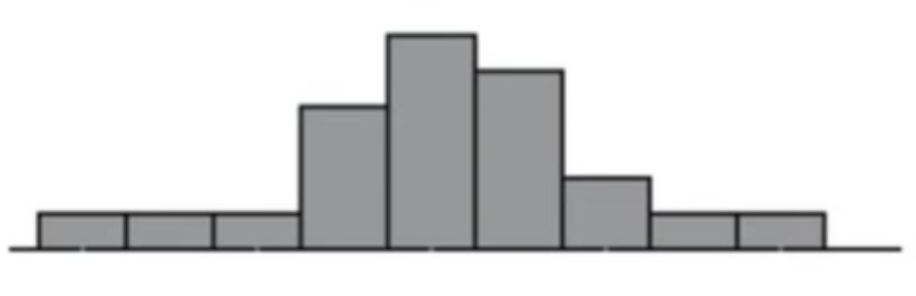
Although this distribution is close to being symmetrical, it is not exactly symmetric.
Note that when you say the word “symmetric,” you must mean exactly. Thus, qualifiers like approximately symmetric, roughly symmetric, or nearly symmetric are necessary to make it clear when a distribution is nearly, but not exactly, symmetric.
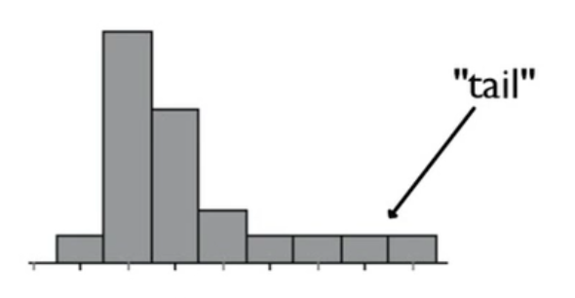
Certain distributions aren't even close to being symmetric. Many asymmetric distributions are called skewed distributions.
These distributions are characterized by a hump, which is sort of a dense grouping with lots of points at certain values and some values that only have a few occurrences. The part of the distribution with fewer occurrences is called a tail. The tail occurs to one side of the median of the distribution. These distributions look like this:
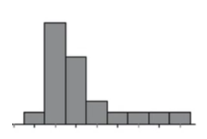
There are two ways that a distribution can be skewed.
| Skewed Distributions | ||
|---|---|---|
|
Right-Skewed (Positively Skewed) |
Tail is on the right side of the median. Right is more positive on the number line. |
|
|
Left-Skewed (Negatively Skewed) |
Tail is on the left side of the median. Left is more negative on the number line. |
|
When all values are equally distributed, then the shape is referred to as being in uniform distribution. Here is an example of uniform distribution:
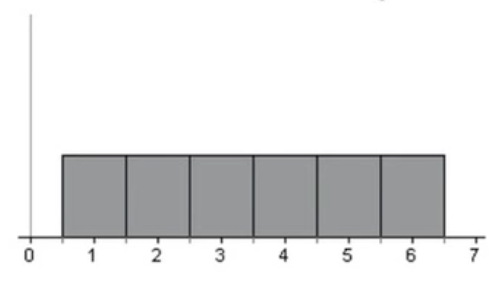
Uniform distributions are a certain kind of symmetric distribution. Imagine you put a line of symmetry between the three and four. The two sides would then be symmetric. Moreover, this is a distribution where all the values are equally distributed.
You can also use the same qualifiers for uniform distribution as are used with symmetry.
EXAMPLE
If you rolled a die six times, you might get one 6, one 5, one 4, one 3, one 2, and one 1.Often, distributions will have a clear peak to their shape. They will peak in just one place on the distribution.
In the table below, each graph has a clear peak, so all of these are called unimodal distributions.
| Unimodal Distributions | |
|---|---|
| Peak in the Center |
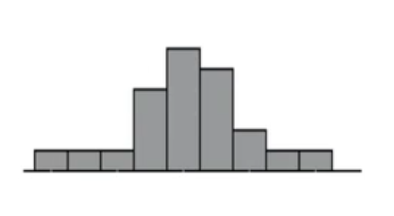
|
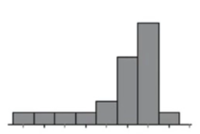
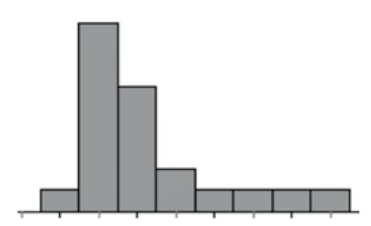
| Peak to the Right |
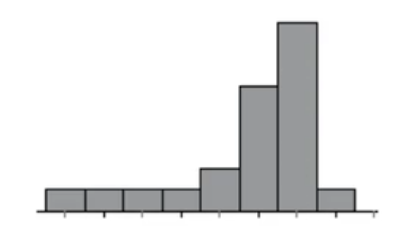
|
| Peak to the Left |
|
You might have a distribution that has two distinct regions with lots of data points and a gap in the middle. When this happens, two peaks form on the distribution. These are both called modes, and a distribution like this is called bimodal distribution.
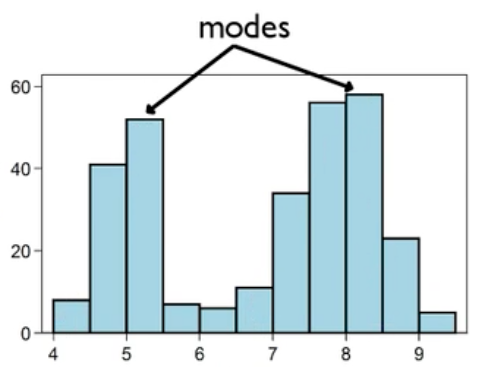
Technically, there's only one bin that is the mode: the very tallest bar. However, in the above graph, there are two bins that are the tallest relative to the others around them—also known as local modes.
Now, sometimes you have a distribution that appears bimodal, like the graph below:
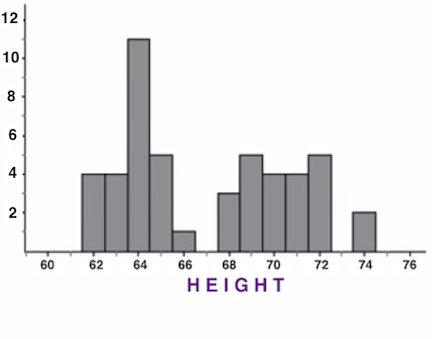
Even though it appears to be bimodal, upon further examination of heights, it's possible that you have two different distributions that happen to be graphed on the same set of axes (see below).
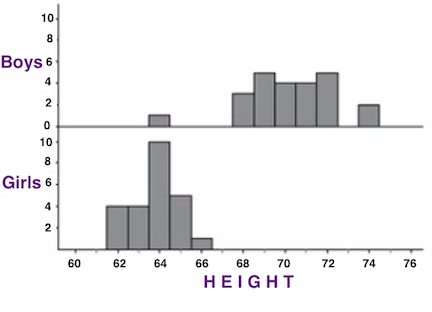
There might be some hidden variable that causes the bimodality. When viewed separately, you end up with two unimodal distributions that just happened to be graphed on the same set of axes.
Any distribution with more than two peaks is called a multimodal distribution. This distribution, for instance, has four peaks:
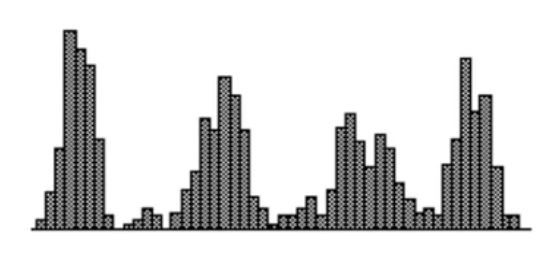
You can have the same issue with this type of distribution as you did with the bimodal distribution, in that it may be multiple distributions graphed on the same set of axes.
Source: THIS TUTORIAL WAS AUTHORED BY SOPHIA LEARNING. PLEASE SEE OUR TERMS OF USE.