In this lesson, you will learn about the four main types of sampling that can be applied in business data analytics scenarios. Specifically, this lesson will cover:
1. Introduction to Sampling
When you are working with data, it is often impossible or impractical to collect information from every single person or item in a group. This is where sampling comes in handy. Sampling is like taking a small piece of a big cake to understand what the whole cake tastes like. In business data analytics, sampling helps us make predictions and decisions without needing to look at every single piece of data.
There are several reasons why sampling is used in business data analytics, such as:
-
Time and Cost Efficiency: Collecting data from everyone can be very expensive and time-consuming. Sampling saves time and money.
-
Manageability: Handling a smaller set of data is easier and more manageable.
-
Accuracy: If done correctly, a sample can give us a good estimate of the whole group.
Let’s start exploring several widely used sampling techniques.
1a. Random Sampling
Random sampling is a way to select a small group of items or people from a larger group, also known as the population, in such a way that every item or person has an equal chance of being chosen. This method is very important in business data analytics, because it helps us make fair and accurate conclusions about the whole population without having to look at every single item or person.
Imagine you want to know what kind of products customers like the most in a big store. Checking every customer’s preference would take too much time and effort. Instead, you can use random sampling to pick a smaller group of customers to ask. If done correctly, this smaller group will represent the preferences of all customers.
Suppose you were studying customer preferences and wanted to create a random sample. Follow these steps:
-
-
List the Population: First, make a list of all the items or people in the population. For example, if you are studying customer preferences, your list might include all the customers who visited the store in the past month.
-
Assign Numbers: Give each item or person a unique number. This helps in keeping track of who or what is being selected.
-
Use a Random Method: Use a random method to pick numbers from your list. This can be done with Excel.
-
Select Your Sample: The items or people that correspond to the randomly picked numbers form your sample. This sample should be a good representation of the whole population (that is, all customers).
Let’s take a look at how you could create a random sample in Excel.
-
EXAMPLE
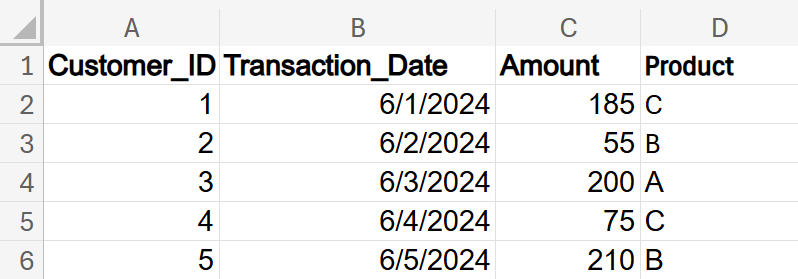
Suppose you have 100 customer transactions from a store. The first five observations are provided below.
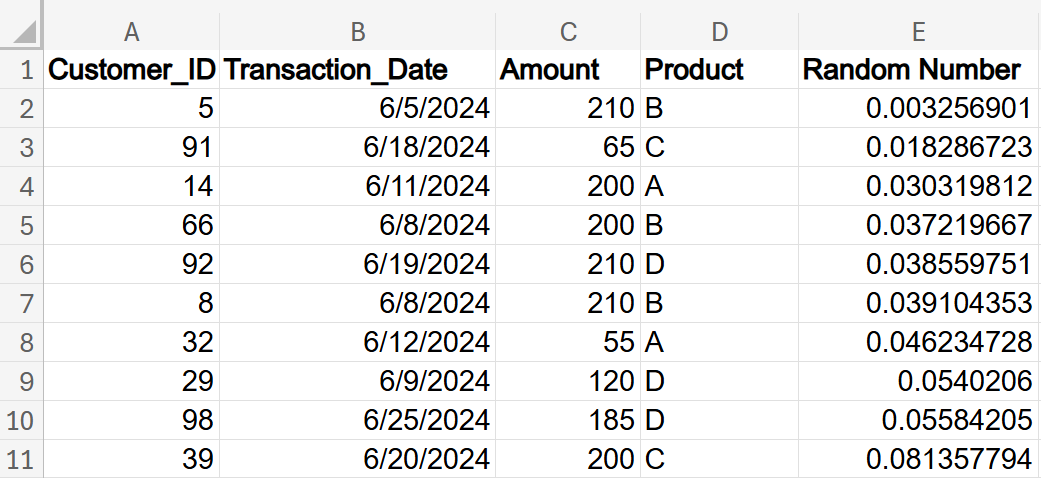
To take a random sample of 10 customers from this data set, you can use the Excel RAND() function. The RAND() function in Excel generates a random decimal number between 0 and 1. Each row in your dataset gets a random number, ensuring that every row has an equal chance of being selected. Once each row has a random number, sort the dataset by that column and then select the top 10 rows as your random sample. A possible random sample is shown below:
-
Use Excel to find a random sample of 10 customer transactions from the previous example.
Using the data in the
customer_preferences_random_sample.xlsx file, perform the following:
1. Create a new column by entering
Random_Number in cell E1.
2. Enter the following formula in cell E2:
=RAND()
You should see a random number from 0 to 1 populate cell E2. Hover over the small black plus sign (Auto-Fill Handle) at the bottom-right corner of cell E2. Click and hold the left mouse button, then drag the handle down to the last cell where you want the formula (cell E101). Each row will receive a random number between 0 and 1.
3. Create a new column by entering
Random_Number1 in cell F1. Copy the values in the
Random_Number column. Go to the
Random_Number1 column and paste the values into the
Random_Number1 column by selecting
Paste Special -->
Values Only.
The RAND() function recalculates every time Excel performs a calculation, including when you copy and paste data or sort the data. When you perform this copy and paste step, the values in the
Random_Number column will change from their original values.
4. Sort the
Random_Number1 column in ascending order (smallest to largest) by selecting the
Random_Number1 column. In the
Home menu, select the drop-down arrow beside the
Sort and Filter icon and select
Sort Ascending. Select
Expand and Sort to apply the sort to all rows.
Then, you can select the top 10 rows to obtain the random sample.
When you work through these steps, you will obtain a different random sample from what is shown in the example, due to the random nature of the RAND() function.
-
In the Excel file
customer_service_reviews.xlsx, there are 30 customer satisfaction scores and reviews for a local restaurant.
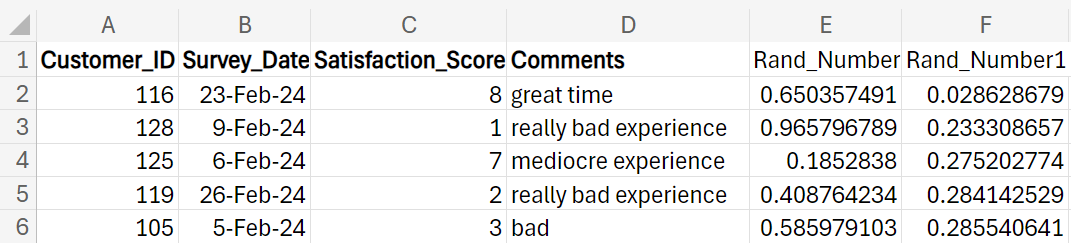
Take a random sample of 5 customer reviews.One possible solution might look like the following:
The customers selected for your random sample will be different because of the random numbers generated by the RAND() function each time the function is used.
Random sampling helps ensure that every member of the population has an equal chance of being selected, which makes the sample more representative of the entire population. Results from a random sample can often be generalized to the entire population, providing valuable insights for decision-making.
1b. Systematic Sampling
Systematic sampling is a method of selecting a sample from a larger population in a systematic, orderly way. Instead of randomly picking individuals, you select every kth individual from a list or sequence. The value of k is determined by dividing the population size by the desired sample size. For example, if you have a population of 1,000 and you want a sample of 100, you would select every 10th individual.
Follow these steps to create a systematic sample.
-
-
Define the Population: Identify the entire group you want to study.
-
Determine the Sample Size: Decide how many individuals you need in your sample.
-
Calculate the Sampling Interval (k): Divide the population size by the sample size.
-
Select a Random Starting Point: Choose a random starting point within the first (k) individuals.
-
Select Every kth Individual: From the starting point, select every kth individual until you reach your sample size.
Let’s look at an example of how you can create a systematic sample in Excel:
-
Your company wants to analyze customer satisfaction based on survey responses. You have a list of 1,000 customers who completed the survey, and you want to select a sample of 100 customers for detailed analysis.
Create a systematic sample size of 100 using the
customer_satisfaction_systematic_sample.xlsx data file by performing the following:
1. Create a new column by entering
Systematic_Sample in cell E1.
2. Calculate the sampling interval by dividing the total number of customers by the desired sample size.

3. Generate a random starting point. In an empty cell, enter the formula:
=RANDBETWEEN(1,10)
This Excel formula will generate a random number between 1 and 10. Suppose the random number is 7. This will be your starting point.
4. Select every k
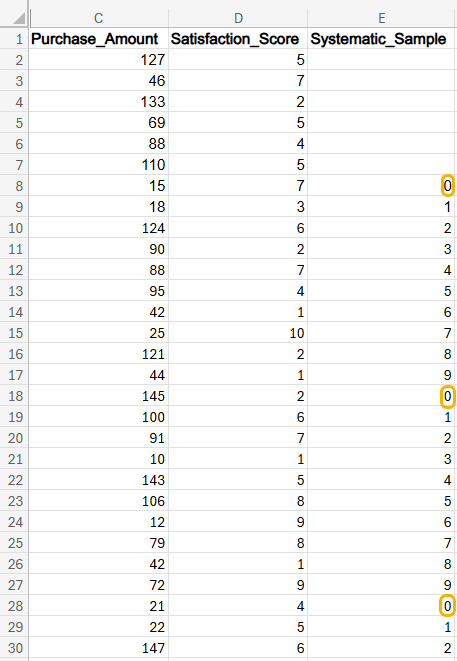
th customer. Starting from the 7th customer, select every 10th customer. In cell E8 (this is the 7th observation), enter the formula:
=MOD(ROW(A7)-7,10)
Let’s break down this Excel formula.
- ROW(A7): This function returns the row number of cell A7. In this case, it returns 7 because A7 is in the 7th row.
- ROW(A7) - 7: This part subtracts 7 from the row number. For cell E8, it calculates
 .
.
- MOD(ROW(A7) - 7, 10): The MOD() function returns the remainder after dividing the first argument by the second argument.
The Excel function =
MOD(ROW(A7)-7,10) will resolve to =
MOD(0,10) and this will equal 0. The MOD() function in Excel returns the remainder after a number is divided by a divisor. When you use =
MOD(0,10), you are asking for the remainder of 0 divided by 10.
When you divide 0 by 10

the result is 0 because dividing 0 by any number always gives 0. Since there’s nothing left over after the division, the remainder is also 0.
For the next row, cell E9 (the 8th observation), the Excel function =
MOD(ROW(A8)-7,10) will resolve to =
MOD(1,10) and this will equal 1. The Excel function =
MOD(1,10) will return the remainder of 1 divided 10

10 cannot go into 1 even once, so the entire 1 is left as the remainder.
Modulo arithmetic deals with the remainder when one number is divided by another. For example, in modulo arithmetic

is 2, because 7 divided by 5 leaves a remainder of 2. In Excel, the =MOD() function works the same way, so =
MOD(7,5) would return 2, just like the long division example.
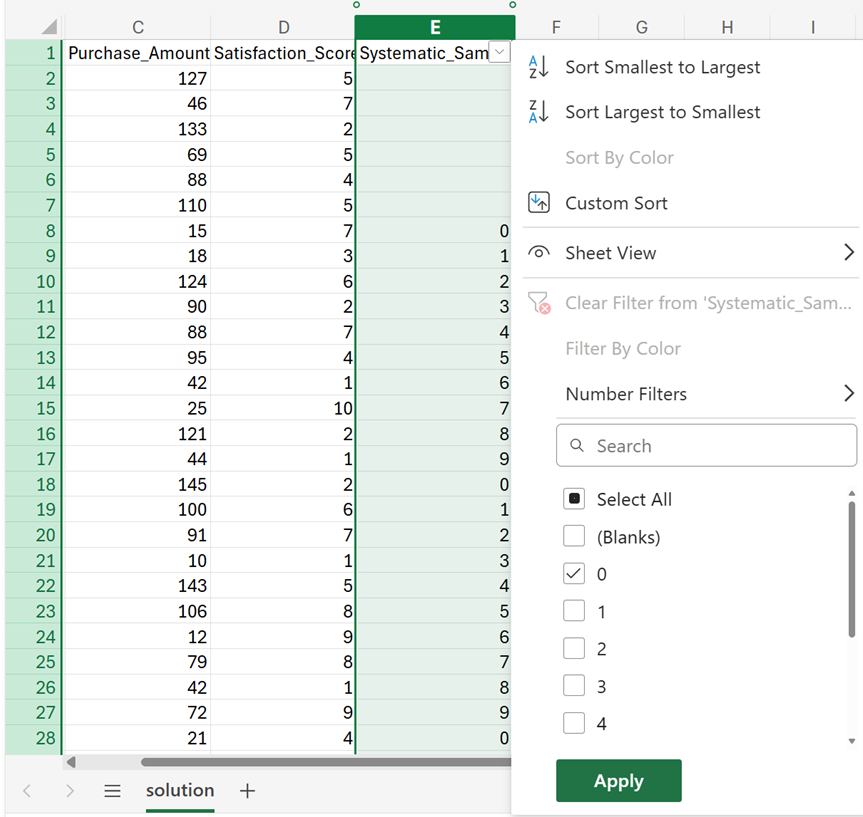
You will see in the 7th row, and then for every 10 rows, there is a 0 indicating that is the row that should be selected for the sample.
5. To obtain the systematic sample, filter the data for rows where the value in the
Systematic_Sample column is 0. Select the
Systematic_Sample column. In the
Home menu, select the drop-down arrow beside the
Sort and Filter icon and select
Filter. Select the drop-down arrow beside the
Systematic_Sample column name in cell E1, deselect the
Select All checkbox, and select the
0 checkbox. Select
Apply.
The worksheet will update to only include the rows where the column
Systematic_Sample is 0. Remember when you filter in Excel, the rows that do not meet the filtering criteria are hidden. It is necessary to ensure you are only working with values where
Systematic_Sample is 0. Next, you will copy and paste these values to a new worksheet.
6. After applying the filter, select all the visible rows (including the column names). Right-click and choose
Copy, or press Ctrl + C.
7. Add a new worksheet by clicking the + icon at the bottom of the Excel window.
8. Click on the first cell (A1) in the new worksheet. Right-click and select
Paste Special -->
Values Only.
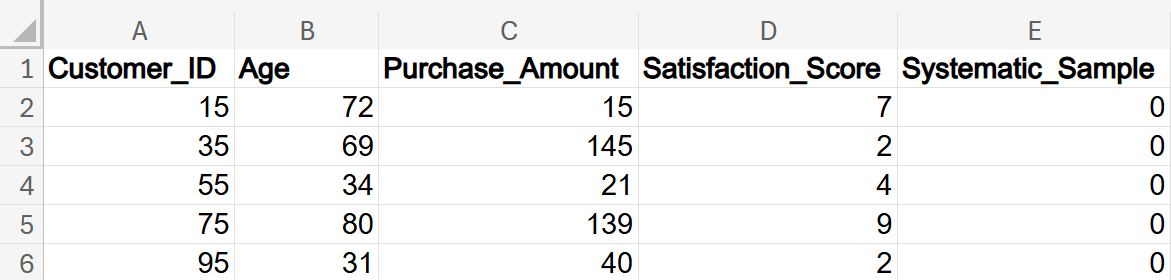
The first five rows of the systematic sample are shown below.
9. Check your work by comparing your systematic sample to the one provided in this example.
-
Using the
banking_transactions_systematic_sample.xlsx file, create a systematic sample of 25 transactions.
Solution:

Suppose the random number generated from the RANDBETWEEN() function was 15. Starting at the 15th transaction, select every 20th transaction. In cell E16, enter the formula:
=MOD(ROW(A15)-15, 20)
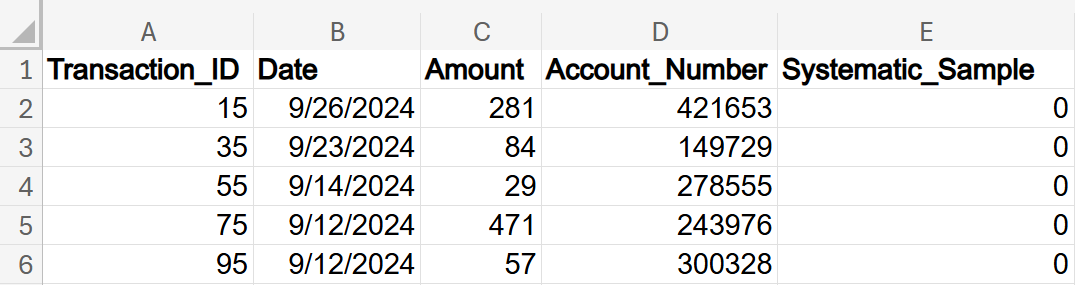
The first five rows of the final systematic sample are shown below.
-
Check out this video about creating a systematic sample size of 25.
-
- Systematic Sample
- A type of sampling method where every kth element is selected.
1c. Stratified Sampling
Stratified sampling is a sampling method used to ensure that different groups within a population are represented fairly in a sample.
Imagine you are a business analyst working for a company that sells products to different age groups. You want to understand how each age group feels about your products. If you just pick a random sample of customers, you might end up with too many people from one age group and not enough from another. This is where stratified sampling comes in handy.
Follow these steps to create a stratified sample:
-
-
Divide the Population into Strata: First, you divide your entire population into different groups, or strata. Each group should have something in common. For example, you could divide your customers into age groups: 18–25, 26–35, 36–45, and so on.
-
Sample from Each Stratum: Next, you take a random sample from each group. The size of the sample from each group can be proportional to the size of the group in the population. For example, if 20% of your customers are in the 18–25 age group, then 20% of your sample should come from that group.
-
Combine the Samples: Finally, you combine the samples from each group to form your overall sample.
-
EXAMPLE
Suppose you have 1,000 customers and you want to survey 100 of them. You divide them into four age groups:
- 18–25: 200 customers
- 26–35: 300 customers
- 36–45: 250 customers
- 46–55: 250 customers
You decide to take 10% of each group:
- 18–25: 20 customers
- 26–35: 30 customers
- 36–45: 25 customers
- 46–55: 25 customers
By doing this, you make sure that each age group is fairly represented in your survey.
Let’s now look at how you would construct this stratified sample in Excel.
-
EXAMPLE
Using a similar scenario as described in the previous example, you are going to construct a stratified sample in Excel.
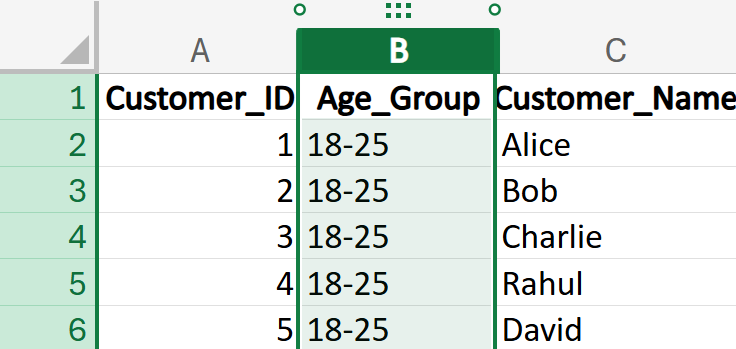
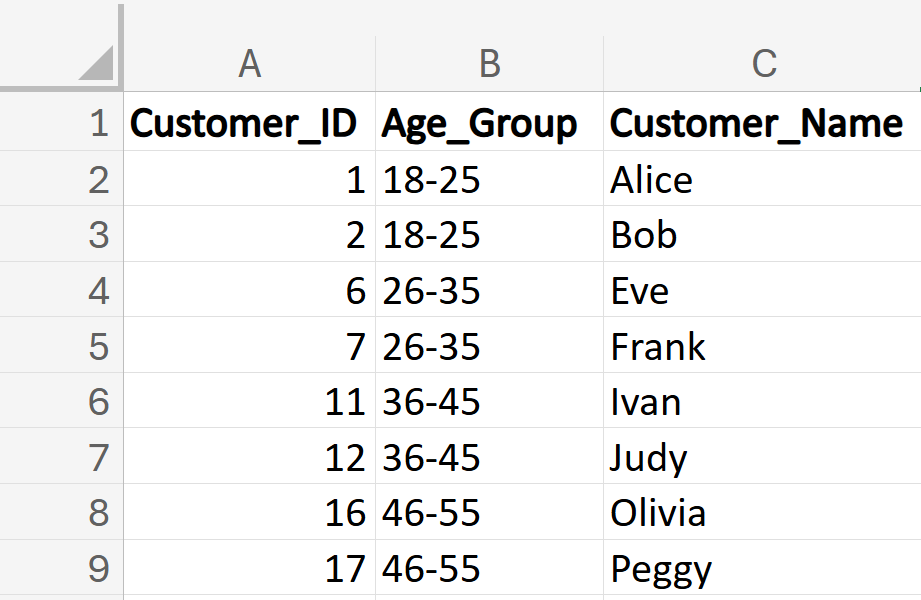
The Excel file
customer_data_age_group.xlsx contains information about 20 customers divided into four age groups: 18-25, 26-35, 36-45, 46-55.
Use the customer_data_age_group.xlsx Excel file and perform the following to construct a stratified sample.
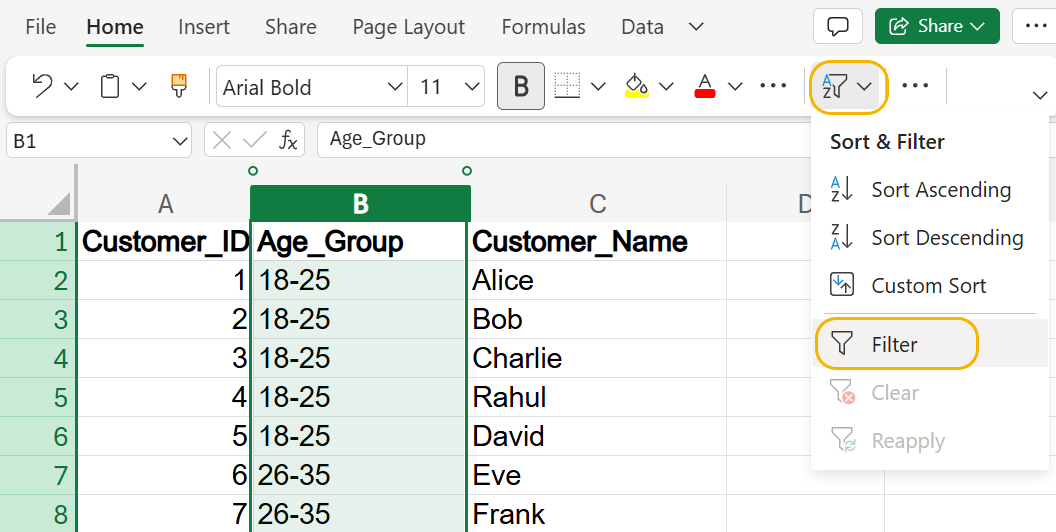
1. Ensure the data is sorted by
Age_Group. For this data, it is sorted by
Age_Group. Always check to make sure the column that contains the group/strata that you want to sample from is sorted.
2. Decide how many samples you want from each group. Let’s sample two customers per age group.
3. Create a new worksheet in your Excel file named stratified_sample. Create the same three columns that are in the customer_data worksheet. You are creating a blank worksheet that will contain your stratified sample when you are done.
4. Return to the customer_data worksheet and select the
Age_Group column.
5. Under the
Home tab, select the dropdown arrow to the right of the
Sort and Filter tool. Select
Filter.
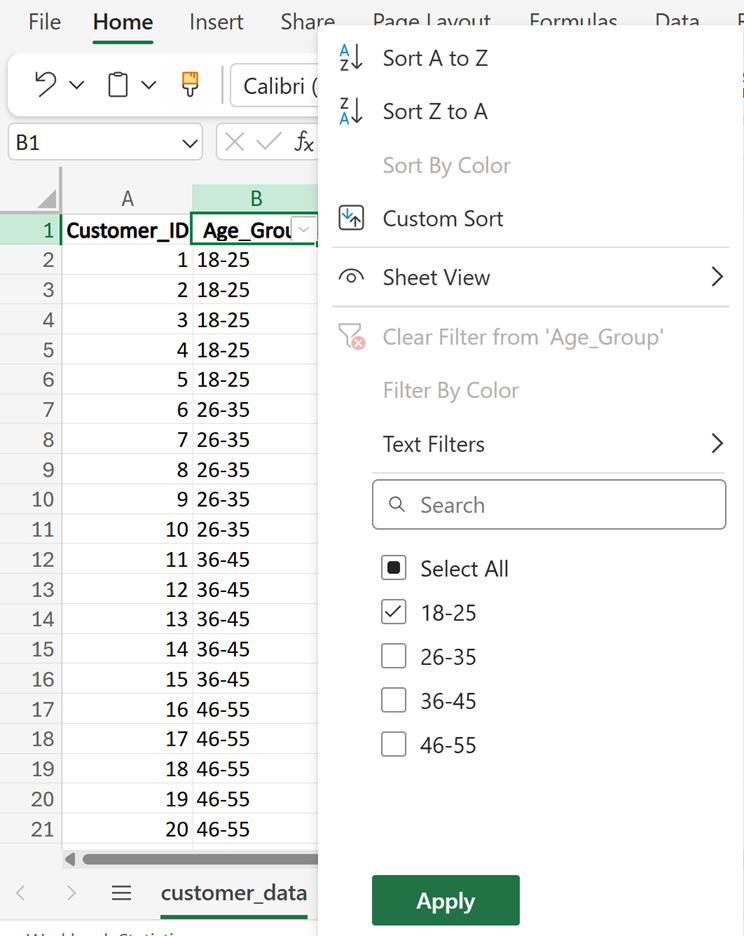
6. A dropdown box will appear on the right side of the
Age_Group column. Select the drop-down box. Choose
Select All to remove all checks from the checkboxes, then choose the checkbox next to the 18-25 age category. Select the
Apply button.
7. Only the rows for the 18-25 age category will be displayed in the worksheet. Copy the first two rows of the filtered data. Then, paste these rows into the stratified_sample worksheet. These are the first two selected rows from the first age group.
You are now going to repeat these steps for each age group.
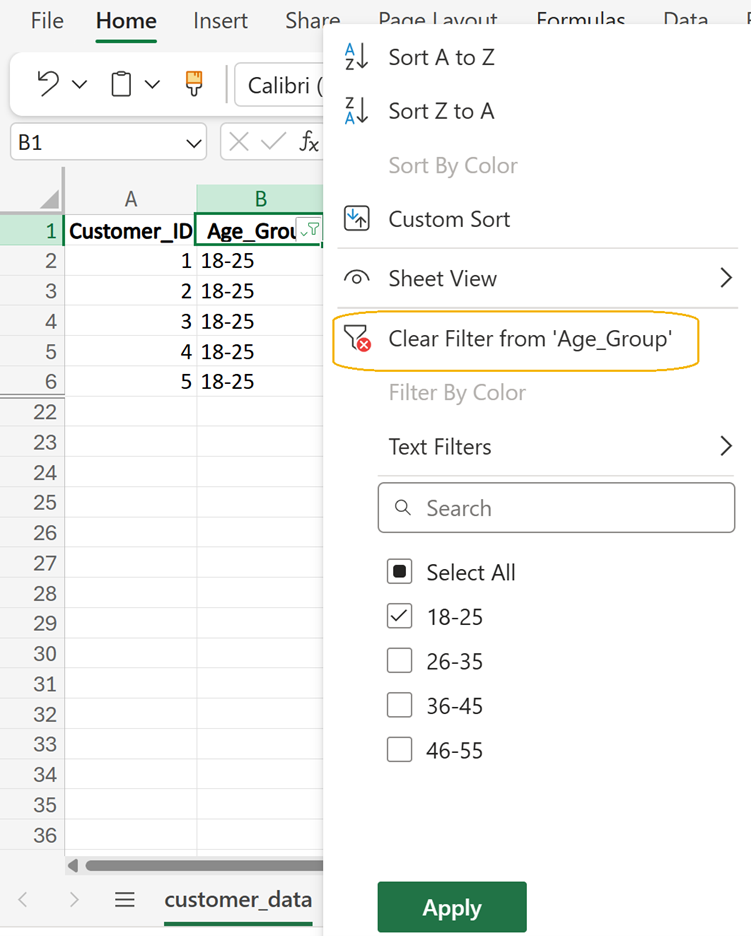
8. To revert the data in the customer_data worksheet back to the non-filtered data, select the drop-down box to the right of the
Age_Group column header and select
Clear Filter from ‘Age_Group’.
9. Repeat steps 6-8 for the remaining four age groups. Your final systematic sample that will be in your stratified_sample worksheet should look like the following:
Now, try to construct a stratified sample in Excel on your own!
-
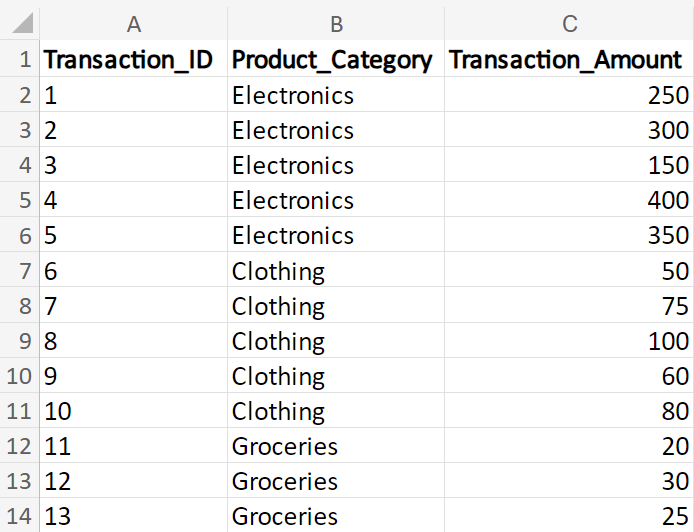
The
product_groups.xlsx Excel file contains information about transactions across different product categories. Construct a stratified sample in which you select three transactions from each product category.
Solution: Your final stratified sample should have 18 rows and look like the following:
-
Check out this video about creating a stratified sample.
-
In this tutorial, you used a manual method to construct a stratified sample (you selected the top 2 or 3 rows from each group). This approach ensures that everyone obtains the same results, which is important for learning and consistency. However, it is important to understand that in real-world applications, samples should be selected randomly from each group or stratum to ensure the sample is representative of the entire population.
-
- Stratified Sampling
- A type of sampling method that involves dividing a population into smaller groups, known as strata, that share similar characteristics.
- Strata
- Subgroups or segments of a population that share similar characteristics.
1d. Cluster Sampling
Cluster sampling is a sampling method used to make data collection easier and more efficient, especially when dealing with large populations. This technique is particularly useful in business data analytics when you need to gather information from a large group but want to save time and resources.
Think of yourself as a business analyst working for a company that wants to survey its customers across the country. Instead of trying to survey every single customer, which would be very time-consuming and expensive, you can use cluster sampling to make the process simpler.
Follow these steps to create a cluster sample.
-
-
Divide the Population into Clusters: First, you divide the entire population into smaller groups, called clusters. Each cluster should be a mini representation of the whole population. For example, you could divide your customers by city or region.
-
Randomly Select Clusters: Next, you randomly select a few clusters to survey. Instead of surveying customers from every city, you might choose a few cities at random.
-
Survey Everyone in the Selected Clusters: Finally, you survey all the customers within the chosen clusters. This way, you still get a good mix of data without having to survey everyone.
-
EXAMPLE
Let’s say you have 10,000 customers spread across 5 cities. You want to survey 1,000 customers. Here’s how you could use cluster sampling:
- Divide into Clusters: Each city is a cluster.
- Randomly Select Clusters: Randomly pick 10 cities.
- Survey Everyone in Selected Clusters: Survey all customers in those 10 cities.
By doing this, you gather data from different parts of the country without having to reach out to every single customer.
Let’s now look at how you would construct this cluster sample in Excel.
-
EXAMPLE
Using a similar scenario as described in the previous example, you are going to construct a cluster sample in Excel.
The
customer_cluster_data.xlsx Excel file contains customers that are spread across five different cities. Each city represents a cluster. In this example, we have 5 clusters: CityA, CityB, CityC, CityD, and CityE. Each row in the data represents an individual customer who lives in one of the cities.
Use the customer_cluster_data.xlsx Excel file and perform the following to construct a cluster sample.
1. Create a new worksheet in your Excel file named cluster_sample. Create the same three columns that are in the customer_data worksheet. You are creating a blank worksheet that will contain your cluster sample when you are done.
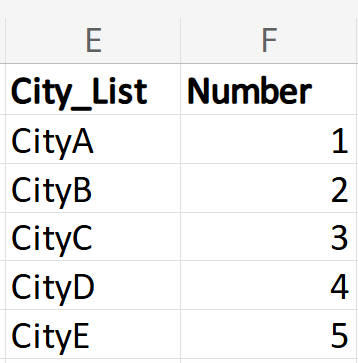
2. Return to the customer_data worksheet and create two new columns named
City_List and
Number. Create
City_List in column E and create
Number in column F. List the five cities in the
City_List column and assign a number 1 to 5 to each city.
3. Use the RANDBETWEEN() function to randomly select numbers corresponding to the cities.
In cell H2, enter the formula:
=RANDBETWEEN(F2, F6)
This will generate a random number between 1 and 5. Suppose it generates 3.
In cell H3, enter the formula:
=RANDBETWEEN(F2, F6)
This will generate another random number between 1 and 5. Suppose it generates 4.
If both cells H2 and H3 have the same number, regenerate one of them.
You will obtain different random numbers because the function RANDBETWEEN() is designed to generate a new random number within the specified range each time it is recalculated.
So that your results will be consistent with this example, use 3 and 4 as your randomly selected values from RANDBETWEEN().
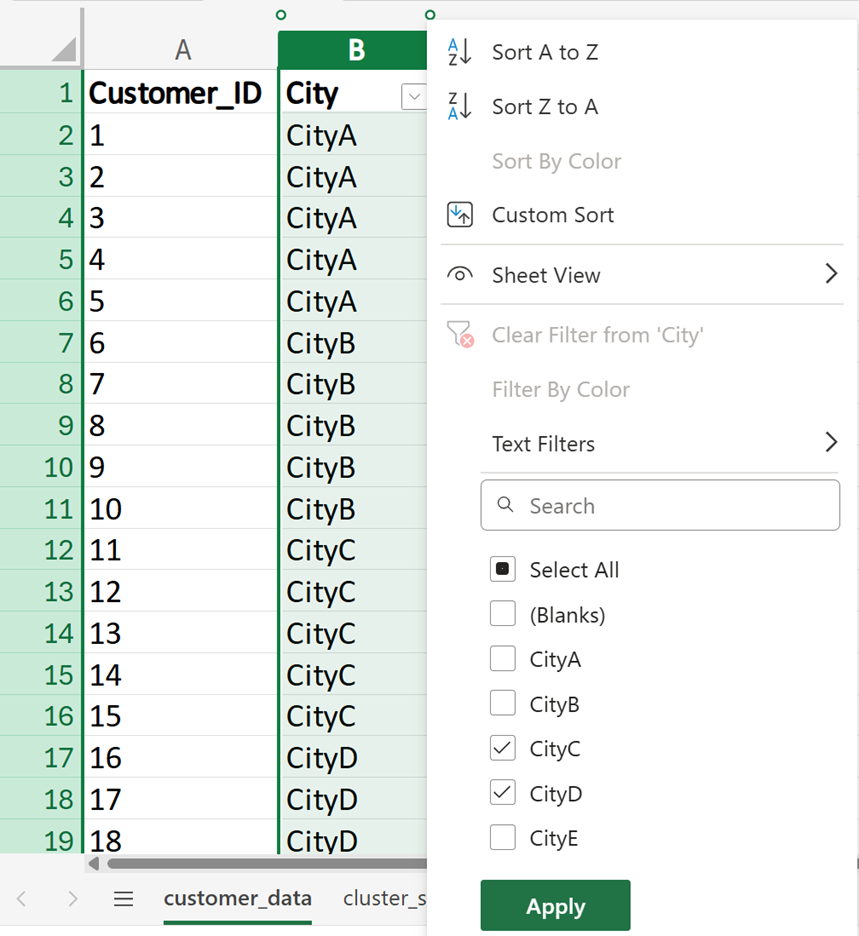
4. Match the numbers 3 and 4 to the cities. These random values correspond to CityC and CityD. Filter the data so that all customers from CityC and CityD are selected.
5. Select the
City column. Under the
Home tab, select the dropdown arrow to the right of the
Sort and Filter tool. Select
Filter. A dropdown box will appear at the right side of the
City column. Select the drop-down box. Choose
Select All to remove all checks from the checkboxes, then choose the checkboxes next to CityC and CityD. Select the
Apply button.
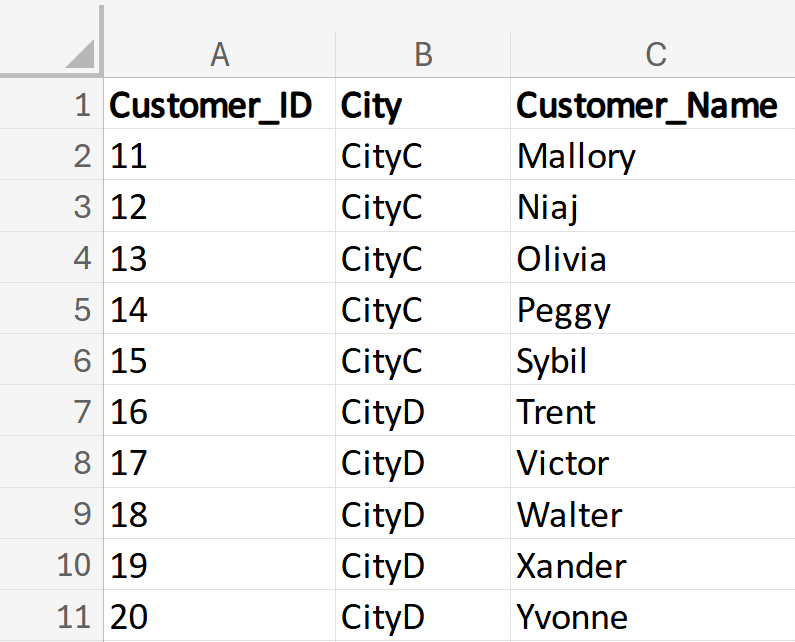
6. Only the rows for CityC and CityD will be displayed in the worksheet. Copy all the rows. Then, paste these rows into the cluster_sample worksheet. Your final cluster sample that will be in your cluster_sample worksheet should look like the following:
Now, try to construct a cluster sample in Excel on your own!
-
The
regions_cluster.xlsx Excel file contains information about customers across different regions of the country. Construct a cluster sample in which you select customers from three regions of the country.
To obtain consistent results, assign the numbers 1 to 4 to each region. That is, the North region should be assigned the number 1, South should be assigned the number 2, East should be assigned the number 3, and West should be assigned the number 4. Assume that using the RANDBETWEEN() function, you obtain the random numbers 1 and 3.
Your final cluster sample should have 10 rows and look like the following:
-
Check out this video on creating a cluster sample.
Cluster sampling is a useful tool in business data analytics. It helps you collect data efficiently and effectively, making it easier to analyze and draw conclusions. Remember, the key is to ensure that each cluster is a good representation of the whole population.
-
- Cluster Sampling
- A type of sampling method where entire clusters are selected and all elements within the cluster are sampled.
1e. Difference Between Stratified and Cluster Sampling
Understanding the difference between stratified and cluster sampling is crucial for selecting the appropriate method for your business data analytics needs, as each technique offers unique advantages and applications depending on the structure and goals of your project.
Below is a table that highlights the key differences between cluster sampling and stratified sampling, along with business data analytics examples for each method.
|
Aspect
|
Stratified Sampling
|
Cluster Sampling
|
|
Definition
|
Divides the population into strata, then randomly samples from each stratum.
|
Divides the population into clusters, then randomly selects entire clusters to sample.
|
|
Purpose
|
To ensure representation of specific subgroups within the population.
|
To simplify data collection and reduce costs, especially for large, dispersed populations.
|
|
Population Division
|
Strata are based on specific characteristics (for example, age, income, department).
|
Clusters are usually based on natural groupings (for example, geographical areas).
|
|
Sampling Process
|
Randomly sample from each stratum proportionally to its size in the population.
|
Randomly select a few clusters and include all members within those clusters.
|
|
Homogeneity
|
Strata should be homogeneous (similar within each stratum).
|
Clusters should be heterogeneous (diverse within each cluster).
|
|
Example
|
Customer Segmentation: A bank segments customers by income levels and samples from each segment to analyze spending behavior.
|
Market Research: A retail chain analyzes sales data from randomly selected stores to identify regional trends.
|
In this lesson, you learned that sampling is essential in business data analysis because it allows analysts to draw conclusions about a larger population without examining every individual. Sampling methods like random sampling, systematic sampling, stratified sampling, and cluster sampling are used to select a subset of individuals from a larger population. These methods help ensure that the sample is representative of the population, which is crucial for making accurate inferences about a population. For each sampling method, you gained hands-on practice in constructing each type of sample in Excel. These Excel exercises connected the concept of each sampling method with real-world applications, guiding you through how these sampling methods are constructed in practice.