Table of Contents |
Totals are one way of measuring revenue. Just like with costs, revenue can also be measured on a per unit basis as margins, as well as averages. More formally, marginal revenue (MR) is the revenue earned from selling one more unit of output. Mathematically, marginal revenue is the change in total revenue divided by the change in output, as shown in the following formula.

Using C&C Family Farm’s data we can calculate the marginal revenue. Here we take the difference between row two and row one for total sales revenue, and divide it by the difference between row two and row one for total output. The marginal revenue per unit is $1.67 ($167 - $0) / (100 - 0 units). In the table below, column 3 is filled in with the marginal revenue values calculated by using the marginal revenue formula.
All marginal values are determined by calculating the difference between two total revenue values, then dividing by two total output values. For example, look at column 4 in the table below, where you can see that in order to determine the marginal value, you take the difference between row two and row one for the total revenue revenue, and divide it by the difference between row two and one for the total quantity of output.
|
Total Output (Q) (in Pounds) (1) |
Price per Pound (2) |
Total Revenue (TR = P * Q) (3) |
Marginal Revenue (MR = Change in TR / Change in Total Output) (4) |
|---|---|---|---|
| 0 | $1.67 | $0.00 | - |
| 100 | $1.67 | $167.00 | $1.67 |
| 230 | $1.67 | $384.10 | $1.67 |
| 290 | $1.67 | $484.30 | $1.67 |
| 350 | $1.67 | $584.50 | $1.67 |
| 380 | $1.67 | $634.60 | $1.67 |
| 400 | $1.67 | $668.00 | $1.67 |
| 390 | $1.67 | $651.30 | $1.67 |
Because each pound of strawberries is sold for $1.67 irrespective of the quantity of output produced, the marginal revenue is always the same as the price. In the table, the price (column 2) is identical to marginal revenue (column 4). So if the price is equal to marginal revenue for all quantities of production, what does this look like graphically? A horizontal line should come to mind.
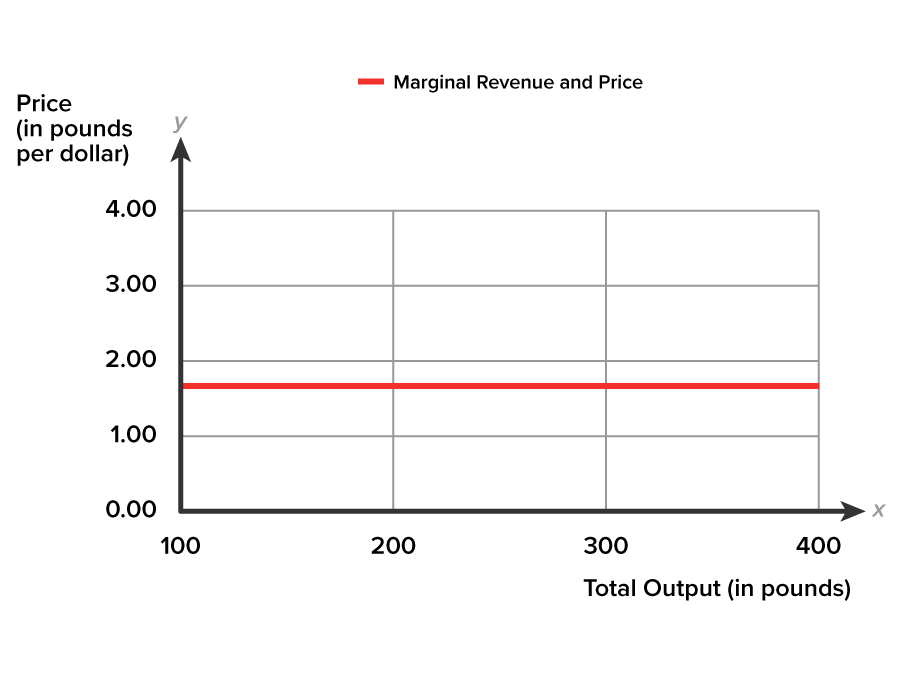
Let’s confirm the observation that price and marginal revenue are represented by the same curve, by plotting marginal revenue and price against total output so that we can visualize the relationship. The marginal revenue curve shows the additional revenue gained from selling one more unit.

Because each pound of strawberries is sold for $1.67 irrespective of the quantity of output produced, the marginal revenue is the same as the price. The horizontal curve demonstrates that P=MR.
Knowing marginal revenue will help C&C Family Farm determine whether or not it is maximizing profit, and whether to increase or decrease production to move closer to the profit maximization level of output.
Source: THIS TUTORIAL HAS BEEN ADAPTED FROM OPENSTAX “PRINCIPLES OF ECONOMICS 2E”. ACCESS FOR FREE AT https://openstax.org/books/principles-economics-2e/pages/1-introduction. LICENSE: CC ATTRIBUTION 4.0 INTERNATIONAL.