Use Sophia to knock out your gen-ed requirements quickly and affordably. Learn more
×

Reading Graphs (Carefully)

Author: Sophia

what's covered
In this lesson, you will investigate the different kinds of information that can be extracted from graphs. Specifically, this lesson will cover:

Table of Contents

1. Information Related to a Graph

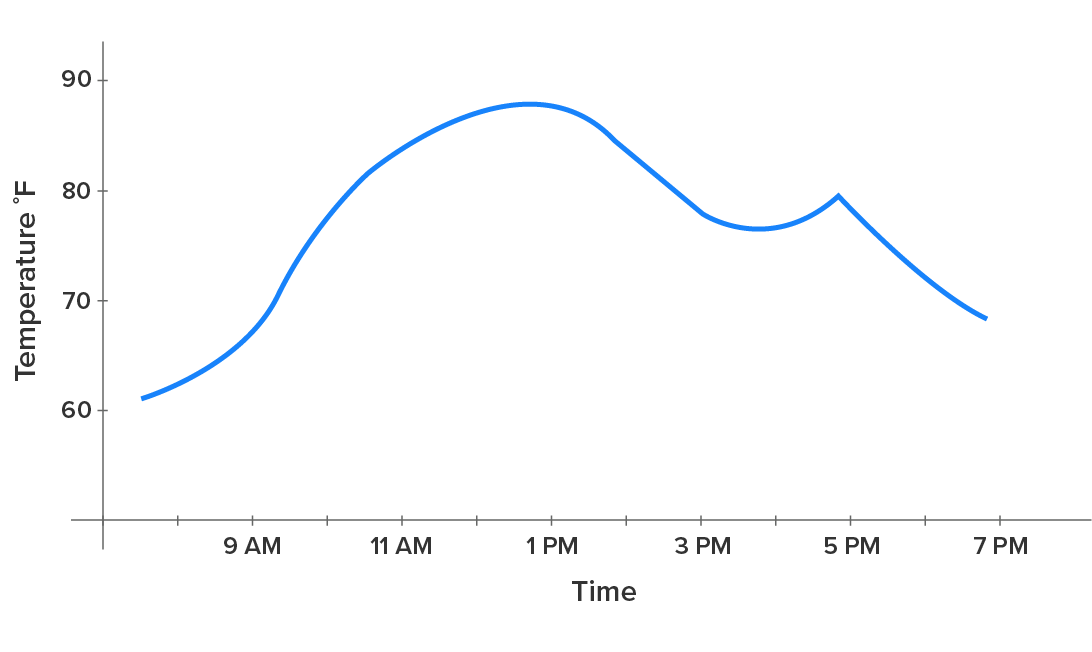
Consider the graph below, which shows the temperature throughout the day.

A graph providing data on temperature variations throughout the day. The horizontal axis represents the time ranging from 7 A M to 7 P M at intervals of 2 hours. The vertical axis represents temperature in degrees Fahrenheit (°F) ranging from 50 to 90 at intervals of 10. A curve starts at around 60 degrees Fahrenheit before 8 A M, rises between 9 and 11 A M, and reaches a peak between 12 to 1 P M. After 1 P M, the curve dips slightly and then rises again briefly after 3:30 P M before declining after 5 PM. The approximate temperatures at 9 A M, 11 A M, 1 P M, 3 P M, 5 P M, and 7 P M are 65, 82, 87, 77, 77, and 69 degrees Fahrenheit, respectively.

1a. Using Specific Points on a Graph

Using the graph above, we can extract the following information by examining points on the graph:

  • At 9 AM, the temperature is roughly 65 degreeF.
  • The high temperature of the day was recorded at 12:30 PM and was about 87 degreeF.

1b. Using the Shape of a Graph

Using the same graph, we can extract the following information by observing the shape of the graph.

  • The temperature appears to have risen most sharply at 9 AM.
  • The temperature dropped after 1 PM, but then rose slightly around 3:30 PM, then started falling again at 5 PM.
  • At 5 PM, the graph started falling sharply and suddenly. It’s possible that a cold front came through, it started raining, or a storm came through.

2. Applications of Graphs to Real-Life Situations

try it
Consider this graph, which shows the height of a diver after jumping off the diving board.
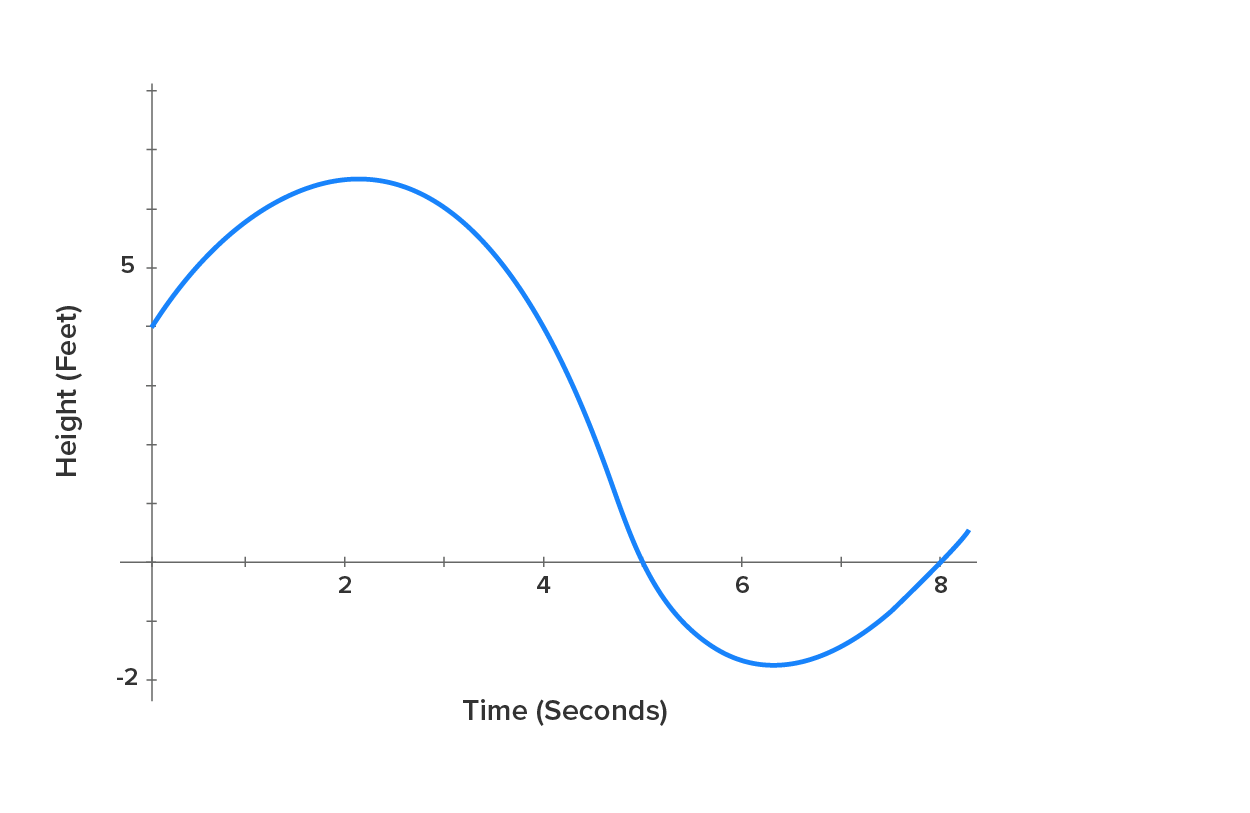
A graph with a horizontal axis represents time in seconds ranging from 0 to 8 seconds at intervals of 1 second. The vertical axis represents the height in feet ranging from –2 to 7 at intervals of 1 foot. A curve starts at 4 feet and rises to a peak between 6 and 7 feet, at 2 seconds. The curve then gradually dips toward the fourth quadrant, crossing the x-axis at 5 seconds. In the fourth quadrant, the curve reaches a minimum of –1.5 feet and then rises to the first quadrant by crossing the x-axis at 8 seconds.
How high was the diving board?
4 feet (the starting point)
How far underwater did the diver go?
About 1.5 feet (the lowest y-value)
How long was the diver underwater?
The diver entered the water after 5 seconds and surfaced again after 8 seconds, so this means that the diver was underwater for 3 seconds.

try it
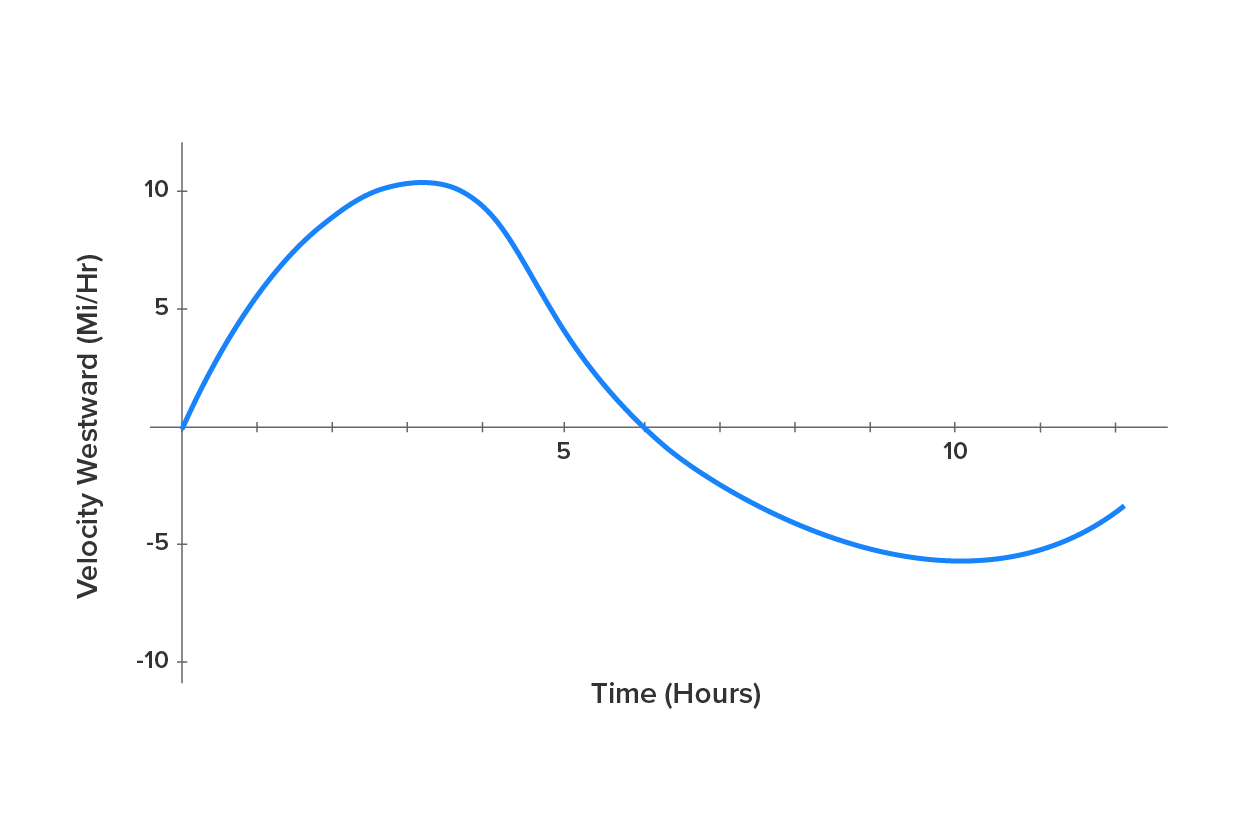
The graph below shows the velocity (heading west) of a boat heading away from St. Thomas (to the west).
A graph with a horizontal axis represents time in hours ranging from 0 to 12 at intervals of 1 hour. The vertical axis represents velocity in miles per hour (mi/hr), labeled as ‘Velocity Westward’, ranging from –10 to 10 at intervals of 5 miles per hour. A curve starts at the origin (0, 0) and rises to a peak at 10 miles per hour around 3 hours. The curve then gradually falls, crossing the x-axis at approximately 6 hours. It continues downward, reaching a minimum of nearly –5 miles per hour around 10 hours before curving back upward.
When is the boat travelling fastest?
Around 3 hours, when the graph is at its peak. It looks like the velocity is about 10 mi/hr.
What does a negative velocity mean?
In this case, since a positive velocity means the boat is heading west, a negative velocity means the boat is heading east.
When is the boat furthest from St. Thomas?
After 6 hours, the velocity transitions from positive to negative, which means that the boat was at its furthest point west before heading east again.

summary
In this lesson, you learned that graphs are very useful since they are a visual representation of a situation. They can be created quite easily using technology, so it is important to consider many aspects of the graph. You learned how to extract information related to a graph by using specific points on a graph and using the shape of a graph. You also explored several applications of graphs to real-life situations to apply your knowledge of the different kinds of information that can be extracted from graphs.

Source: THIS TUTORIAL HAS BEEN ADAPTED FROM CHAPTER 0 OF "CONTEMPORARY CALCULUS" BY DALE HOFFMAN. ACCESS FOR FREE AT WWW.CONTEMPORARYCALCULUS.COM. LICENSE: CREATIVE COMMONS ATTRIBUTION 3.0 UNITED STATES.