Table of Contents |
One measure of variation is range. The range is one of the simplest ways to calculate variation. It is calculated by simply subtracting the minimum value from the maximum value.

EXAMPLE
This chart shows the height of the Chicago Bulls basketball team for a particular year:| Height of Chicago Bulls Players | |
|---|---|
| Omer Asik | 84 |
| Carlos Boozer | 81 |
| Ronnie Brewer | 79 |
| Jimmy Butler | 79 |
| Luol Deng | 81 |
| Taj Gibson | 81 |
| Richard Hamilton | 79 |
| Mike James | 74 |
| Kyle Korver | 79 |
| John Lucas III | 71 |
| Joakim Noah | 83 |
| Derrick Rose | 75 |
| Brian Scalabrine | 81 |
| Marquis Teague | 74 |
| C.J. Watson | 74 |
Range and interquartile range are similar ideas in that they're both measured by subtraction, so they're not particularly difficult to calculate. While they are calculated similarly, they do measure different measures of variation.
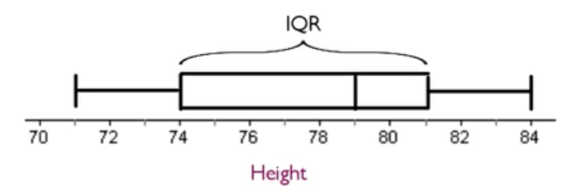
The interquartile range, also abbreviated IQR, is another measure of spread, but it's median-based. To review, the median is the middle number of an ordered data set.
The IQR represents the range in which the middle 50% of the data points lie. Finding the interquartile range takes a few steps.

Source: THIS TUTORIAL WAS AUTHORED BY JONATHAN OSTERS FOR SOPHIA LEARNING. PLEASE SEE OUR TERMS OF USE.

