Table of Contents |
| Property | Integral Formula | In Words |
|---|---|---|
| 1 |
Definite Integral When Lower and Upper Bounds Are Equal 
|
When the limits of integration are equal, the value of the definite integral is 0. |
| 2 |
Definite Integral When Upper and Lower Bounds Are Interchanged 
|
When the order of the limits of integration are interchanged, the values of the definite integrals are opposites. |
| 3 |
Definite Integral of a Constant Function 
|
The definite integral of a constant is equal to the constant multiplied by the width of the interval 
|
| 4 |
Definite Integral of a Constant Multiple of a Function 
|
The constant k can be moved outside, and the definite integral of  is multiplied by k. is multiplied by k.
|
| 5 |
Definite Integral Over a Partition of an Interval, with a ≤ b ≤ c 
|
Adding areas Note: 
|
To understand some of these properties, we’ll look at Riemann sums and areas.
Property 1: If the lower and upper limits of integration are equal, then the width of the interval is 0, which means there is no accumulated area.
Property 2: As we have seen,  accumulates area from
  to
to  Then, moving in the opposite direction from
  to
to  whatever was added would be subtracted, and vice versa. Thus, the definite integrals have opposite signs.
Property 3: Consider the graph of  on the interval
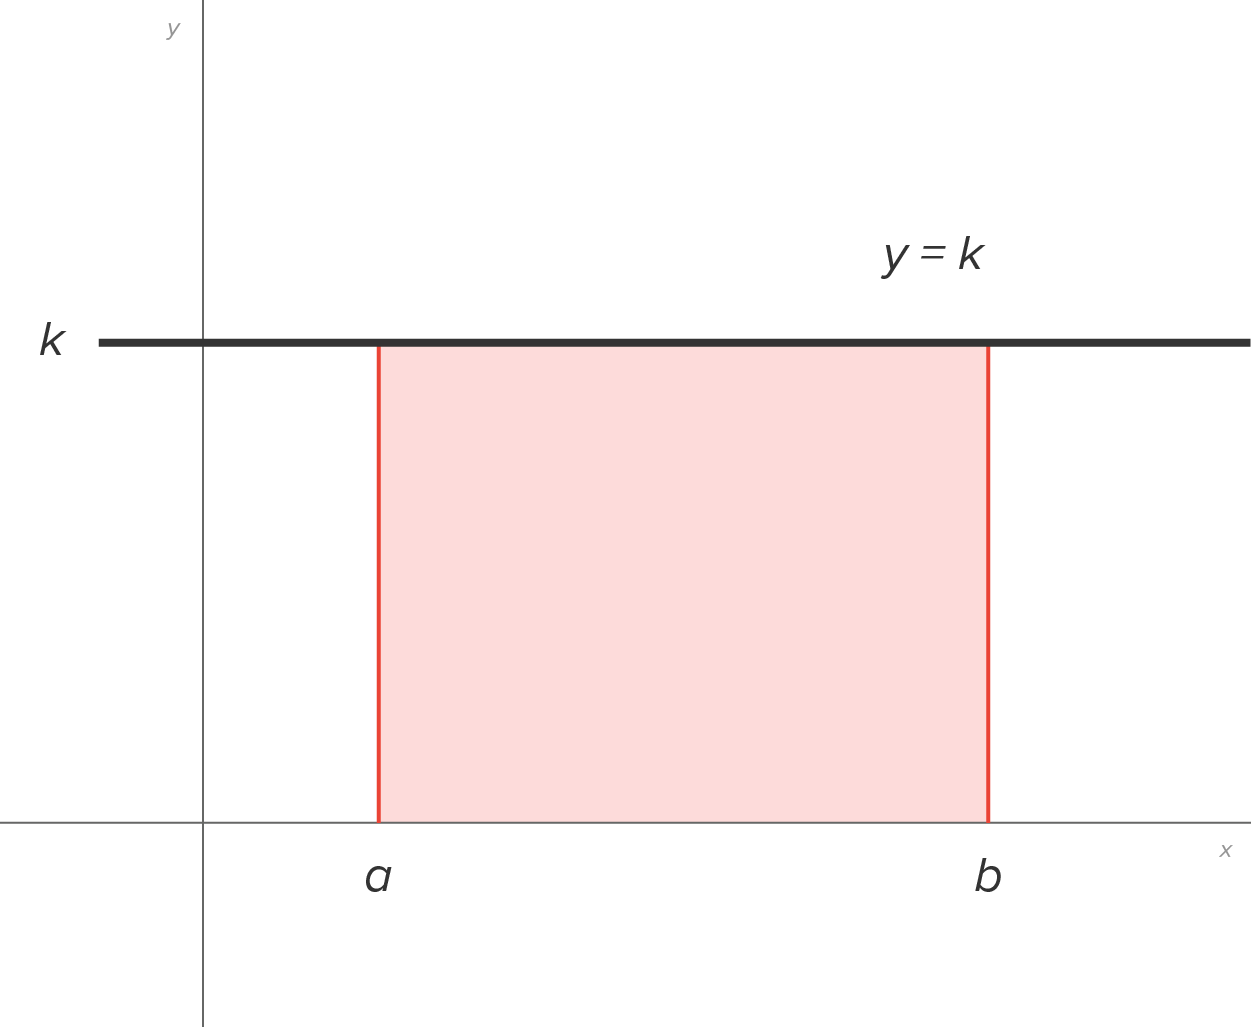
Assume  as in the picture. The region formed by
  and is a rectangle with height k and width
  Then, the area is
the definite integral is equal to the area. 
 which is also true since then the rectangle is below the x-axis.
Riemann Sum for 
|
Riemann Sum for 
|
|---|---|
 Height of each rectangle:  Area of each rectangle: 
|
 Height of each rectangle:  Area of each rectangle: 
|
In the Riemann sum, all terms have a common factor of k, meaning it can be factored outside the sum,  Since this is the original Riemann sum multiplied by k, this justified the integral version of this property.
Property 5: Consider the graph in the figure:
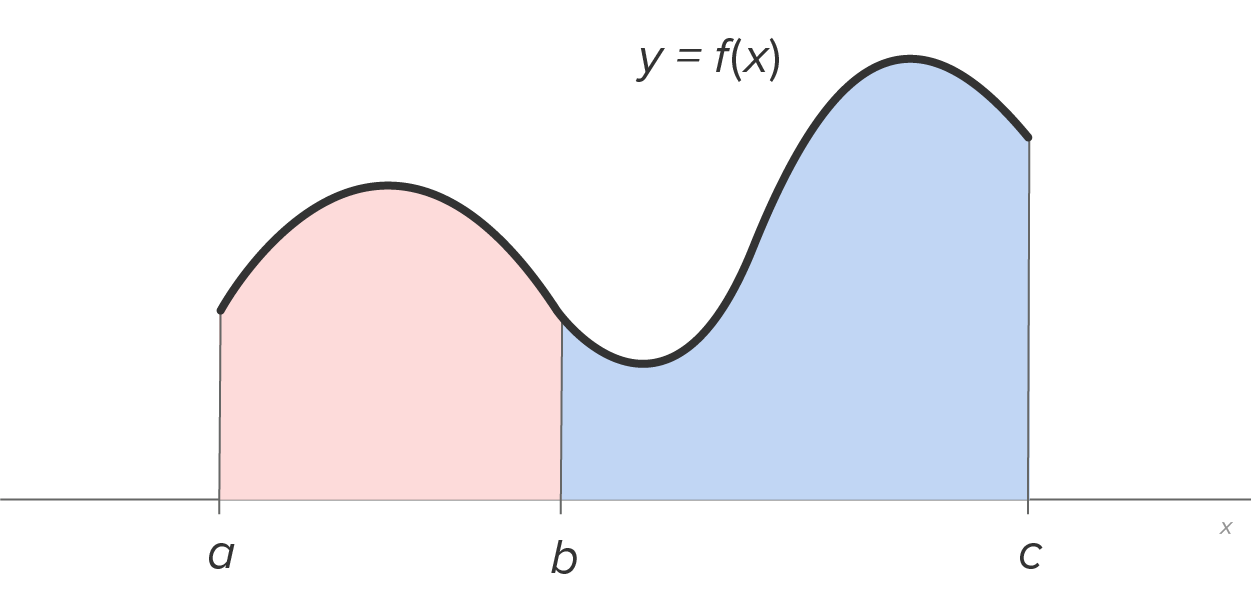
By adding areas, we see that the area on  is the sum of the areas on
  and
and 
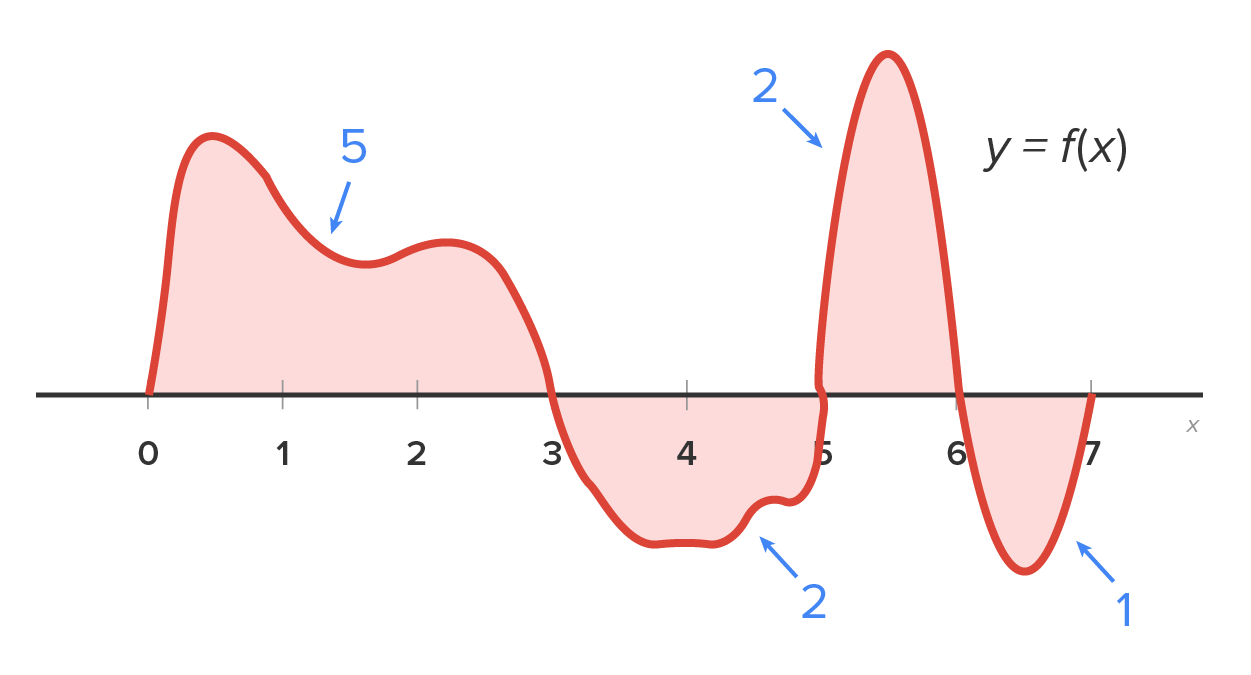
EXAMPLE
The graph in the figure shows a function and areas between and the x-axis.

|
|
Evaluate this definite integral. |

|
The area of the region is 2, but is below the x-axis. |


|
|
Evaluate this definite integral. |

|
Use the following property: Note, “3” was chosen since at  the first region ends and the second one begins. the first region ends and the second one begins.
|

|
Substitute values from the graph: 
|

|
Simplify. |


|
|
Evaluate this definite integral. |

|
Use the following property: Since the limits of integration are in reverse order, this property is appropriate to use. |

|
Substitute values from the graph:
|

|
Simplify. |


|
|
Evaluate this definite integral. |

|
Use the following property:
|

|
was evaluated in part b.
|

|
Simplify. |


 since the region on
  has area 2 above the x-axis, and the region on
  has area 1 below the x-axis.

 consider and
 since the area of the region is 2, but below the x-axis.
  since the area of the region is 2, and above the x-axis.
| Formula | In Words |
|---|---|
Definite Integral of a Sum of Two Functions 
|
The definite integral of a sum of two functions is the sum of the definite integrals of the functions. |
Definite Integral of a Difference of Two Functions 
|
The definite integral of a difference of two functions is the difference of the definite integrals of the functions. |
These properties follow directly from Riemann sums (using properties of summations).
For the sum property:


By the property of summations, this is written as  which by the limit property is equal to
  which is equal to
A very similar sequence of steps can be followed for the difference between f and g.
EXAMPLE
Given and
and  find each of the following:

|
|
Evaluate this definite integral. |

|
Use the definite integral of a sum of two functions property. |

|
Substitute values. |

|
Simplify. |


|
|
Evaluate this definite integral. |

|
Use the property:
|

|
For the first integral,  For the second integral, the value is given: 10 |

|
Simplify. |


|
|
Evaluate this definite integral. |

|
Use the property:
|

|
Use the property:
|

|
Substitute given values of integrals. |

|
Simplify. |


 and
and  let’s find
  first:
|
|
The integral we are trying to find, which is related to 
|

|
Use the property:
|

|
Use the property:
|

|
Given and 
|

|
Simplify. |
 it follows that
  This is due to the property that

 we’ll find the value of
If  on
on  then
then 
To visualize this, consider these graphs. Clearly, the area between the graph of  and the x-axis is greater than the area between the graph of and the x-axis.
The graphs of  and and  together on the same axes. together on the same axes.
|
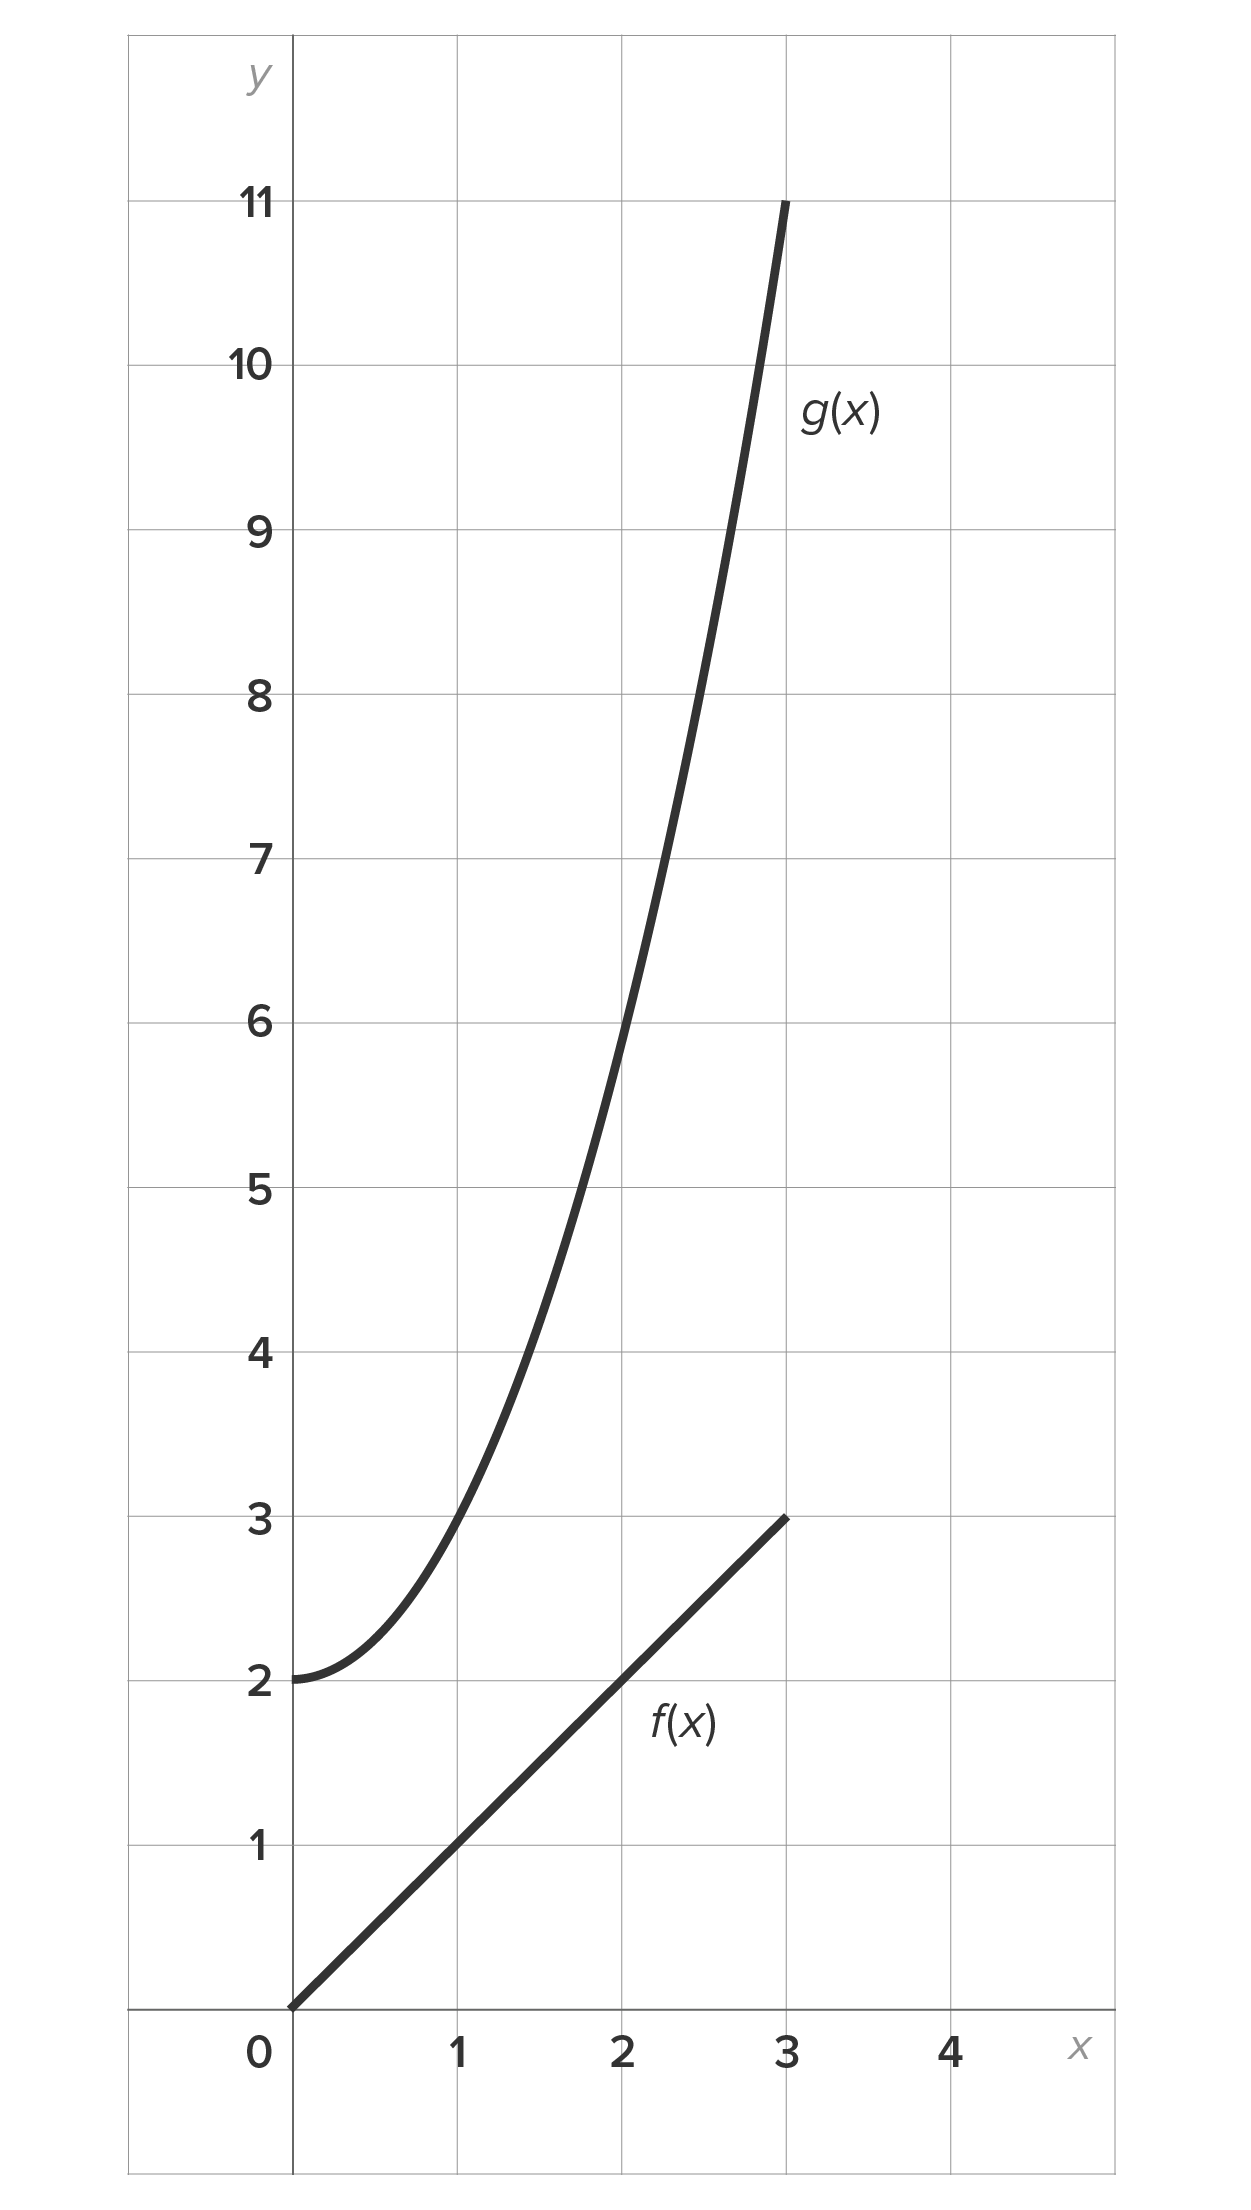
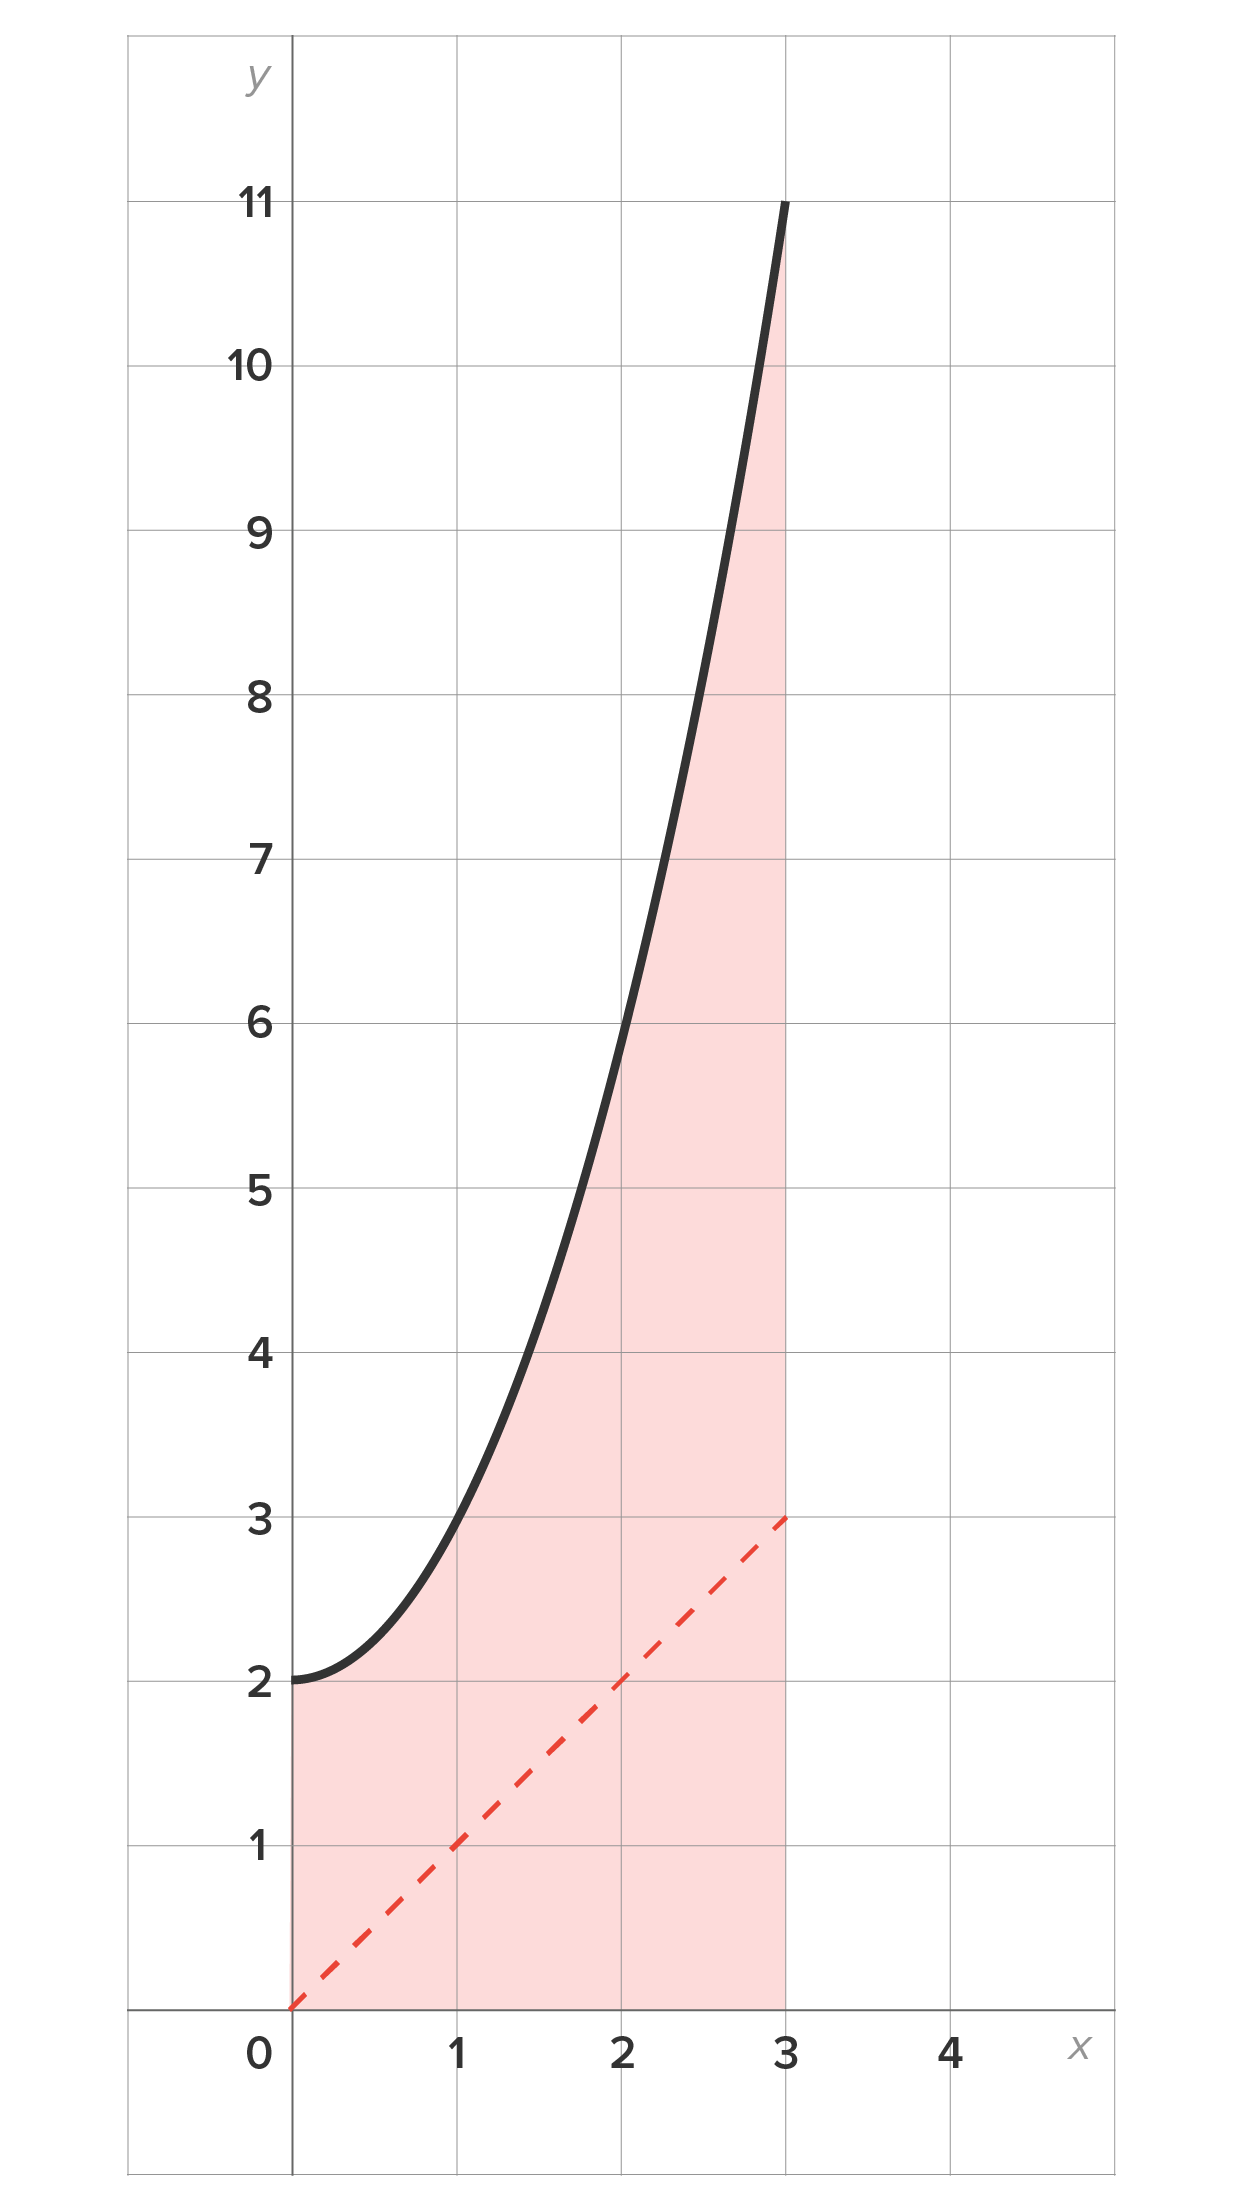
The region bounded by the graphs of and the x-axis. 
|
The region bounded by the graphs of and the x-axis. 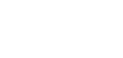
|
|---|---|---|
|
|
|
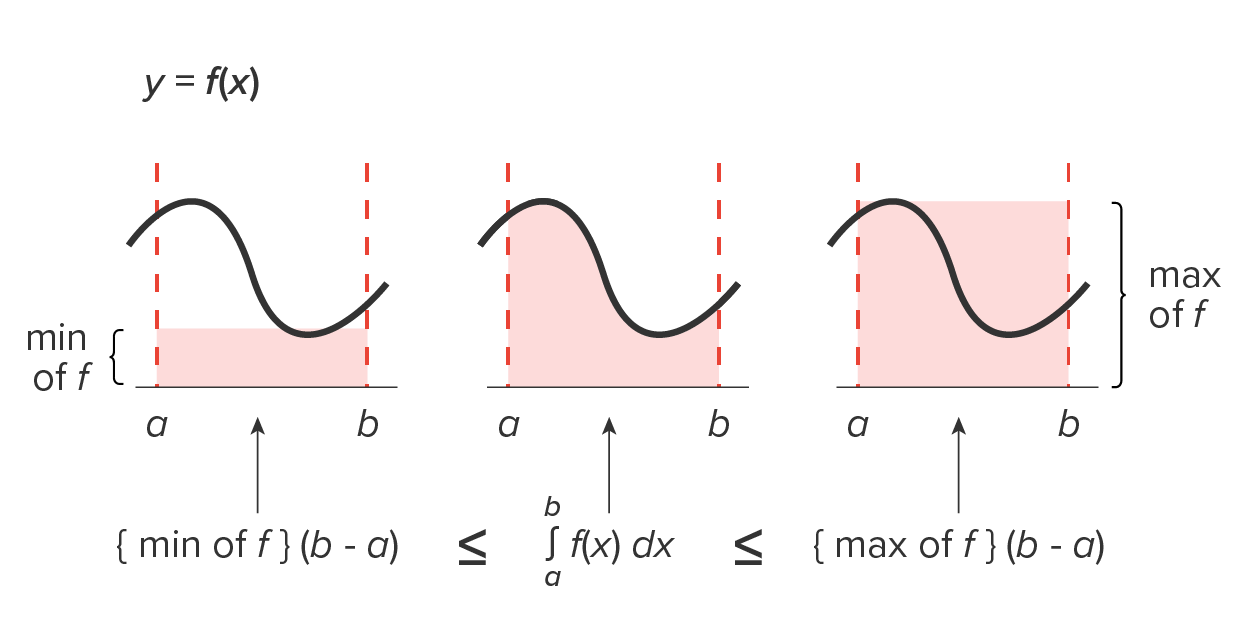
Let m = the minimum value of on
Let M = the maximum value of on
Given that  on the interval then
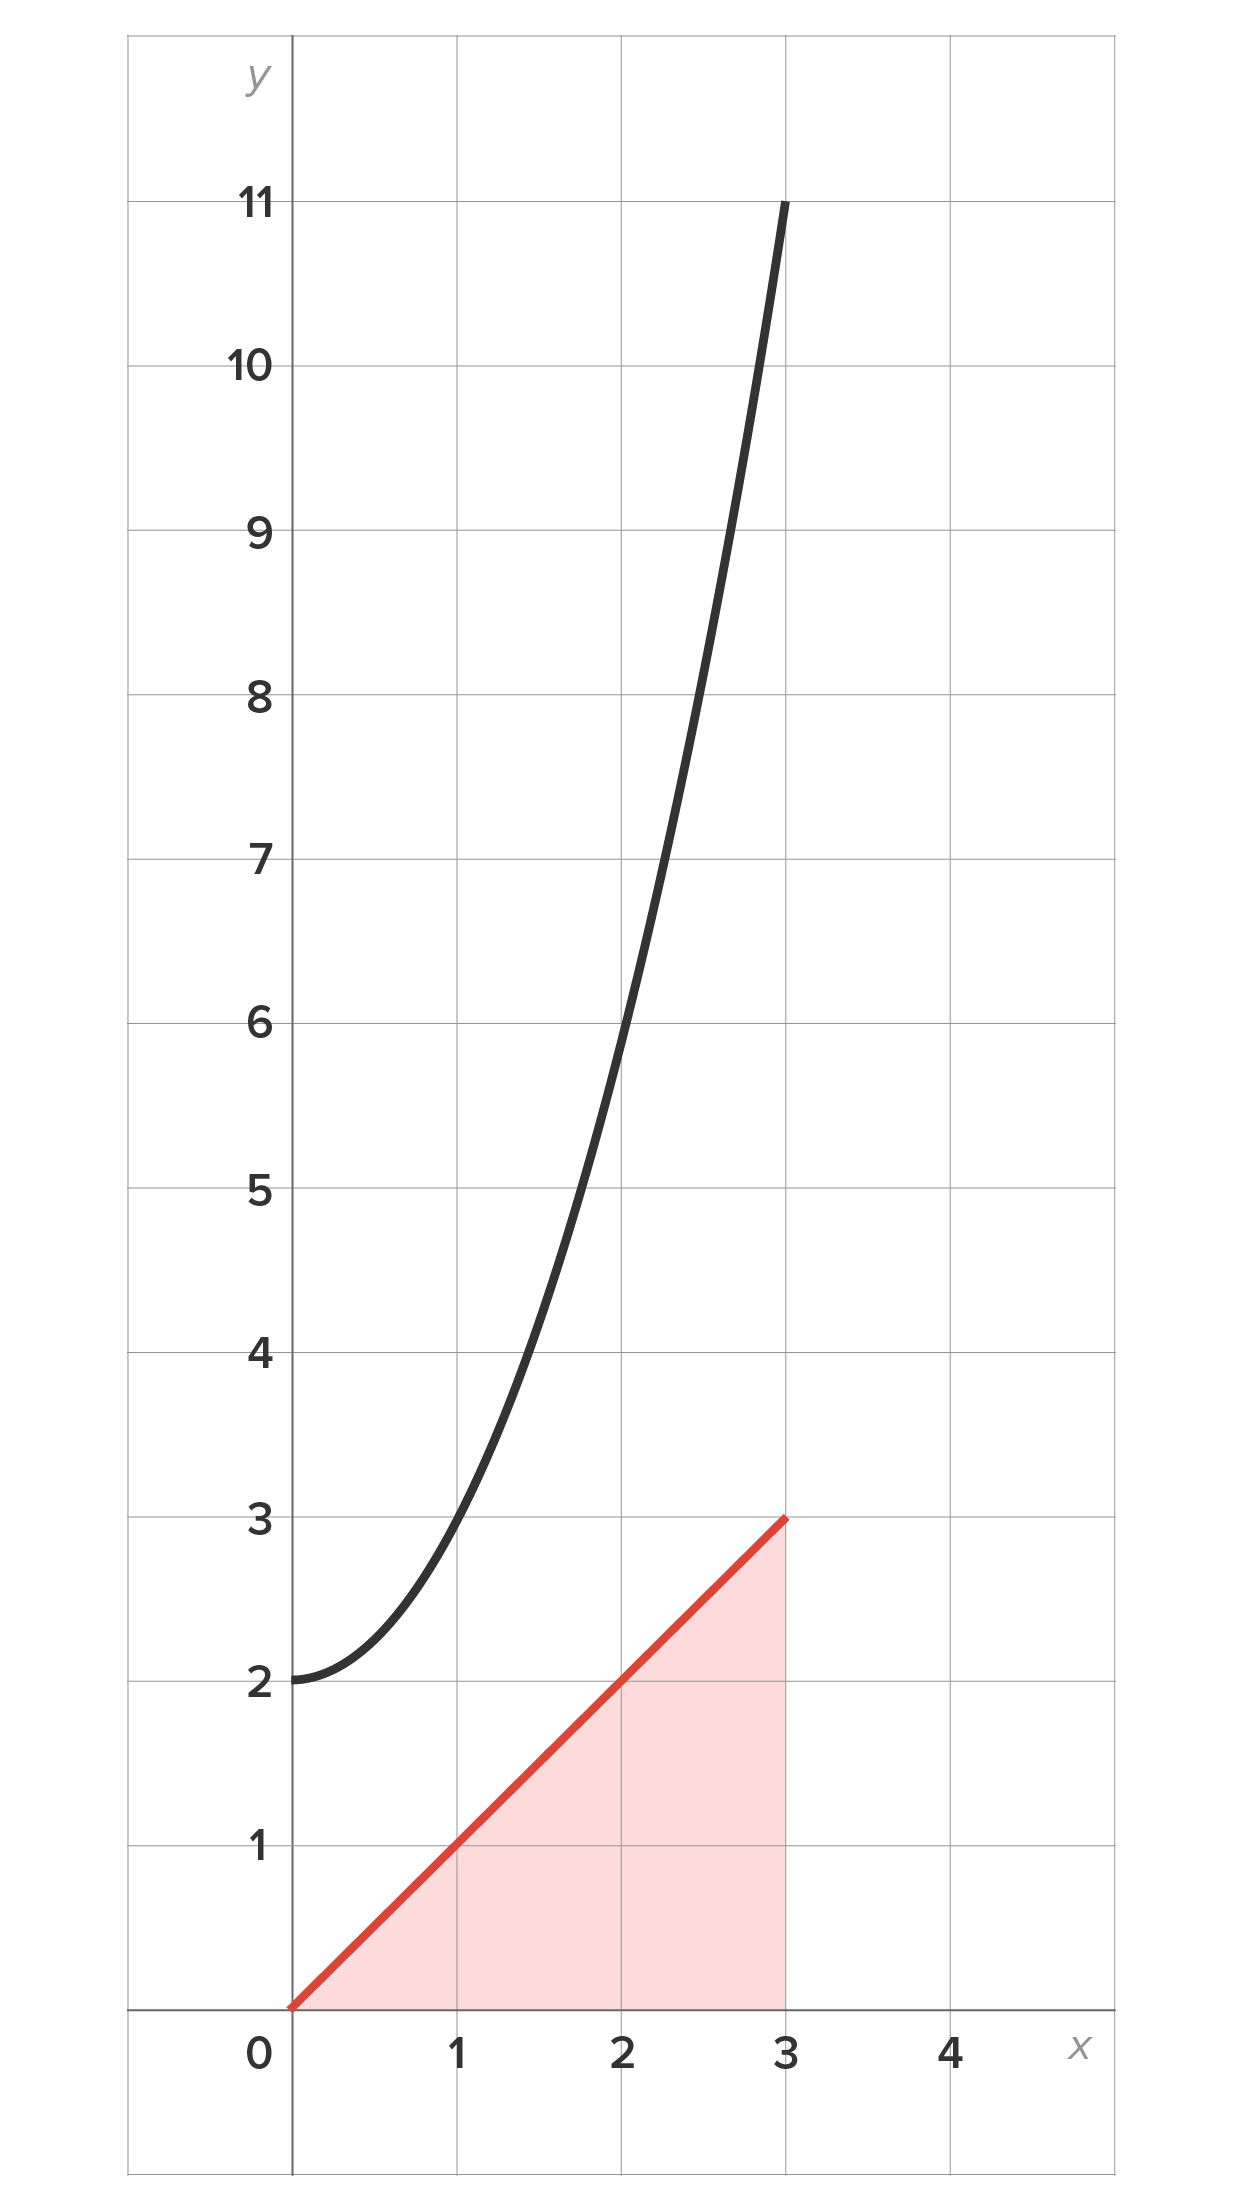
Below is the graphical justification:
EXAMPLE
Use the graph to determine the upper and lower bounds of the value of
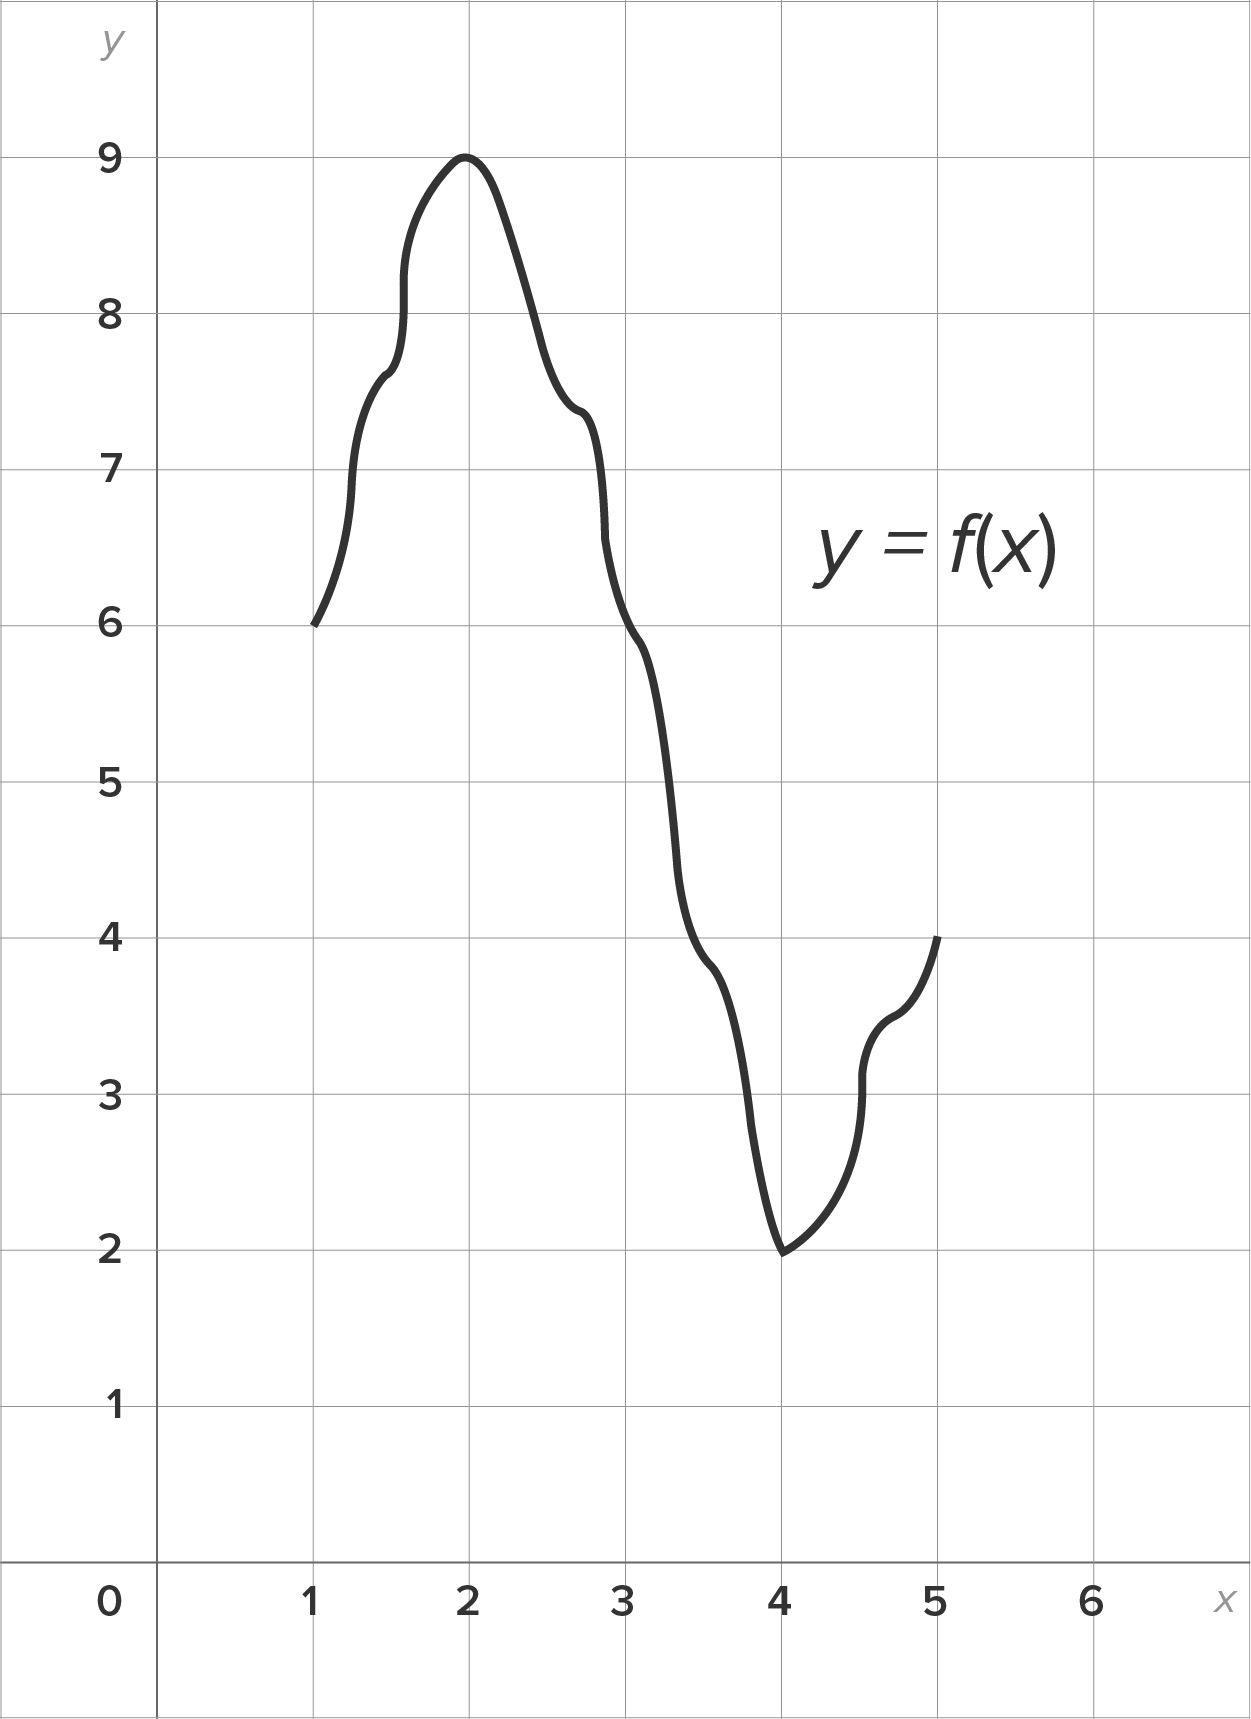 on
on  is 2; the maximum value is 9.
 and the maximum value is
  That is,

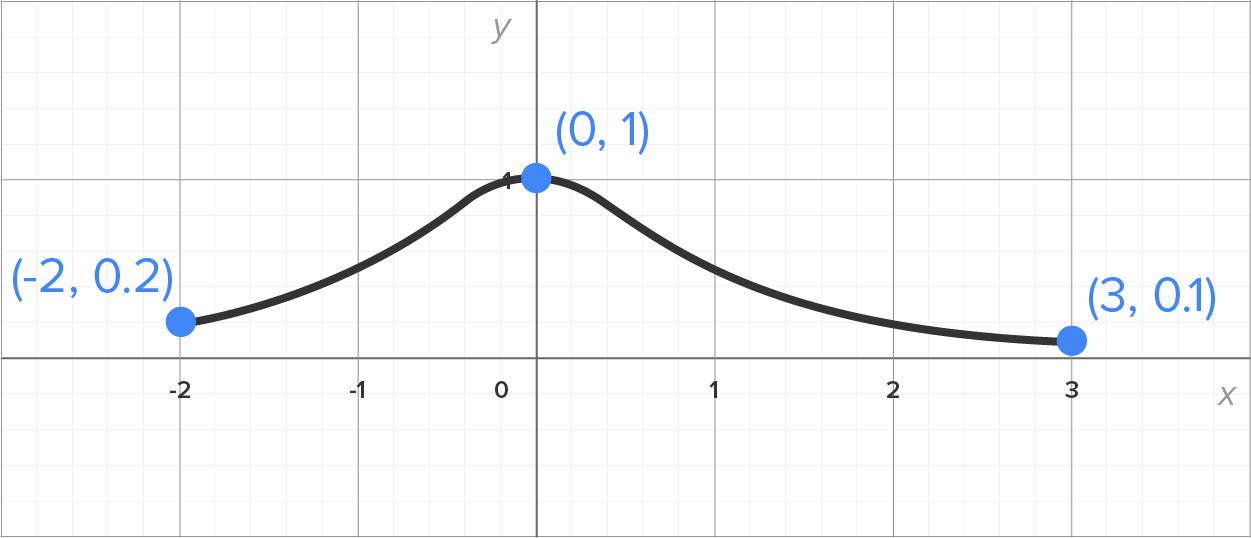
 on the interval
  is 0.1, the smallest possible value of
  on the interval is 1, the largest possible value of
 is between 0.5 and 5.
Source: THIS TUTORIAL HAS BEEN ADAPTED FROM CHAPTER 4 OF "CONTEMPORARY CALCULUS" BY DALE HOFFMAN. ACCESS FOR FREE AT WWW.CONTEMPORARYCALCULUS.COM. LICENSE: CREATIVE COMMONS ATTRIBUTION 3.0 UNITED STATES.


