In this lesson, you will learn about the basic probability rules that can be used to find probabilities businesses need to make decisions. Specifically, this lesson will cover:
1. Probability Basics
Probability is a fundamental concept in business data analytics, helping analysts make informed decisions based on data. Probability is the study of uncertainty. It helps us quantify how likely certain events are to occur. Probability measures the likelihood of an event occurring, ranging from 0 (impossible) to 1 (certain). The probability of an event (A) is denoted as P(A).
1a. Sum of Outcomes Equals 1
The total probability of all possible outcomes of an event must sum to 1, meaning that when you add up the probabilities of every possible outcome, the result must be exactly 1. This fundamental concept ensures that all possible outcomes are accounted for when analyzing uncertain situations. An outcome for an event refers to a specific result or observation from a specific action, decision, or process. An event has a set of related outcomes that share a common characteristic or trait. The table below provides some examples of events and outcomes in a business data analytics context.
|
Event
|
Outcomes
|
|
Analyzing market demand for a new product launch
|
High demand, low demand
|
|
Analyzing wasted time or costs in a supply chain
|
Identifying bottlenecks, allocating resources effectively
|
|
Customer satisfaction survey
|
Resolved, not resolved, escalated, positive feedback, negative feedback
|
|
Sales performance analysis
|
Top-performing products, average-performing, under-performing products
|
The scenario below provides an example of the probability rule that the sum of all probabilities for all possible outcomes for an event must be 1.
-
EXAMPLE
Consider a marketing campaign where a company sends out promotional emails. The possible outcomes are:
- Customer opens the email.
- Customer ignores the email.
- Email bounces back.
The event is the company sending out promotional emails, and the outcomes are the results from this process of sending out emails.
Suppose


and

Then, this probability scenario would be valid because

-
Imagine you’re analyzing the outcomes of a marketing campaign. Each customer can respond in one of six ways:
- Purchase (P)
- No Purchase (NP)
- Subscription (S)
- Unsubscribe (U)
- Engage (E)
- Ignore (I)
-
- Outcome
- A single result of an event.
1b. Complement Rule
You are planning a fun day at the amusement park. You wake up and check the weather to find there is a 30% probability it will rain. What is the probability it will not rain? The probability of not having rain is known as the complement of a probability. In this case, the complement of a 30% chance of rain is the 70% likelihood that rain will not occur.
The complement of probability A is the probability that A does not occur, denoted as A' (pronounced "A prime"). The complement of probability A is 
For instance, if the probability that a customer will purchase a product after seeing an ad is  then the probability that the customer will not purchase the product is
The example below illustrates how you can use the complement rule in a real-world business scenario.
-
EXAMPLE
The inventory manager for an e-commerce company that sells camping gear requests your assistance in using analytics to help with managing inventory. The manager specifically requested you because he heard you were a probability ninja. The goal is to minimize stockouts (when a product is out of stock) while maintaining optimal inventory levels. Stockouts lead to lost sales, dissatisfied customers, and missed revenue opportunities. Overstocking ties up capital and storage space, increasing costs.
You use historical sales data and predictive analytics to forecast demand for each product. Based on these forecasts, you plan inventory replenishment. You have built a model that provides the probability of stockouts for each item in the store’s inventory. A sample of the data is shown below.
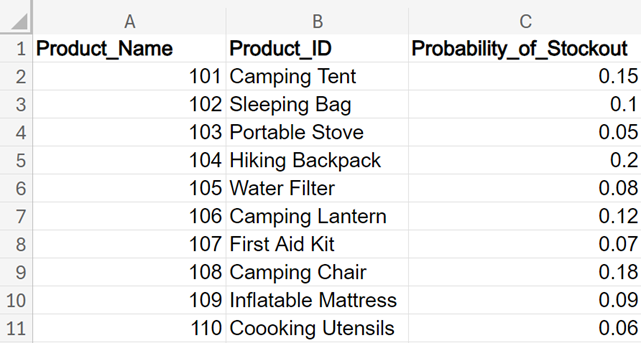
The manager is interested in the probability of no stockouts (the likelihood that a product will remain in stock). You can find the probability of no stockouts by using the complement rule.

Using Excel, you can find these probabilities in a straightforward manner using the formula below.

You can find the probability of no stockouts for all the items in the data by applying the rule of complements in Excel to all cells in column D.

Notice that the probability of stockout and no stockout equals 1 for each product.
An inventory manager can leverage the probability of no stockouts for several strategic purposes:
-
Reorder Point Determination: Calculate the reorder point for each product based on the probability of no stockouts. This ensures timely restocking and minimizes the risk of running out of inventory.
-
Inventory Optimization: Prioritize items with lower probabilities of no stockouts. Allocate resources (capital, storage space) efficiently by focusing on critical products with low probabilities of no stockouts.
-
Supply Chain Coordination: Collaborate with suppliers to maintain consistent supply. Share the probability data to negotiate better lead times and order quantities, leading to an improved supply chain reliability.
-
Marketing and Promotions: Plan marketing campaigns around products with high probabilities of no stockouts. This will enhance customer satisfaction by ensuring availability during promotions.
-
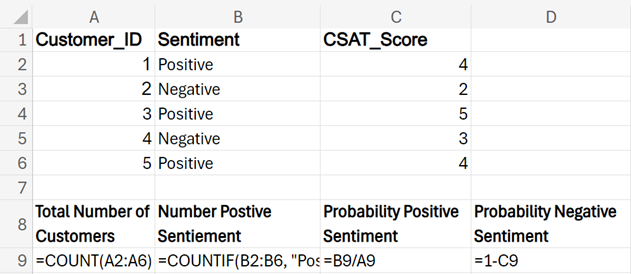
Suppose you have a data set of customer satisfaction scores from a call center as shown below. The data is in the
call_center_sentiment.xlsx file. A description of each column is provided below.
-
CustomerID. Unique identifier for each customer.
-
Sentiment. Refers to the overall attitude or feeling expressed by customers about the customer’s experience with the call center. It is categorized into two types: Positive and Negative.
-
CSAT. CSAT (Customer Satisfaction) score ranging from 1 to 5, where 1 represents dissatisfaction and 5 represents high satisfaction with the customer’s experience with the call center.

Using Excel, find the probability of a customer having a positive sentiment and use the rule of complements to find the probability of a customer having a negative sentiment.
Solution: The probability of positive sentiment is 60%, and the probability of negative sentiment is 40%.

Perform the following steps in Excel, using the image immediately after the steps as a reference.
1. Calculate the total number of customers using the COUNT() function. The COUNT() function is designed to count only the cells that contain numbers. It ignores empty cells, text, logical values, and errors. In this problem, you can use the COUNT() function to determine the total number of customers. Enter the following in cell A9:
=COUNT(A2:A6)
2. Calculate the number of customers with positive sentiment using the COUNTIF() function. The COUNTIF() function is used to count the number of cells within a range that meet a specific condition or criterion. The syntax for COUNTIF() is =COUNTIF(range, criteria) where:
-
range: The range of cells you want to apply the criteria to.
-
criteria: The condition that must be met for a cell to be counted. This can be a number, expression, cell reference, or text string.
In this problem, you can enter the following in cell B9:
=COUNTIF(B2:B6, "Positive")
3. Find the probability of positive sentiment.

In this problem, you can enter the following in cell C9:
=B9/A9
4. Find the probability of negative sentiment.
In the context of this problem, negative sentiment is considered the complement of positive sentiment because the two events are disjoint (they cannot both occur at the same time). A customer cannot simultaneously have both a positive and a negative sentiment about their experience. If a customer has a positive sentiment, they do not have a negative sentiment, and vice versa.
Applying the rule of complements, the probability of a customer having negative sentiment is:

In this problem, you can enter the following in cell D9:
=1-C9
The Excel worksheet with the Excel formulas is shown below:
-
- Complement
- The non-occurrence of probability.
2. Basic Rules of Probability
Business processes and decisions often deal with disjoint events; whether the events are disjoint or not will determine how the probabilities are calculated. The addition rule is commonly used to help businesses quantify uncertainty.
2a. Union and Intersection of Events
Before you are introduced to the addition and multiplication rules, you need to understand two concepts related to the combination of events: union and intersection.
The union of two events, A and B, denoted by  represents the set of outcomes that belong to either event A or event B. In other words, the union includes all outcomes that satisfy either event A or event B. For example, if you had two sets of numbers,
  and
and  , then
  would be
  . The union represents all unique outcomes from both events. The intersection of two events, A and B, denoted by
  represents the set of outcomes that belong to both events. For our example,
The Venn diagram visually represents these relationships, showing that outcomes 1 and 2 belong only to A, outcomes 5 and 6 belong only to B, and outcomes 3 and 4 are shared between both sets.
The Venn diagram shows the union of these two events, A and B:

You can represent the union of events with a Venn diagram, as shown below. The blue color shown below represents the union of events A and B:
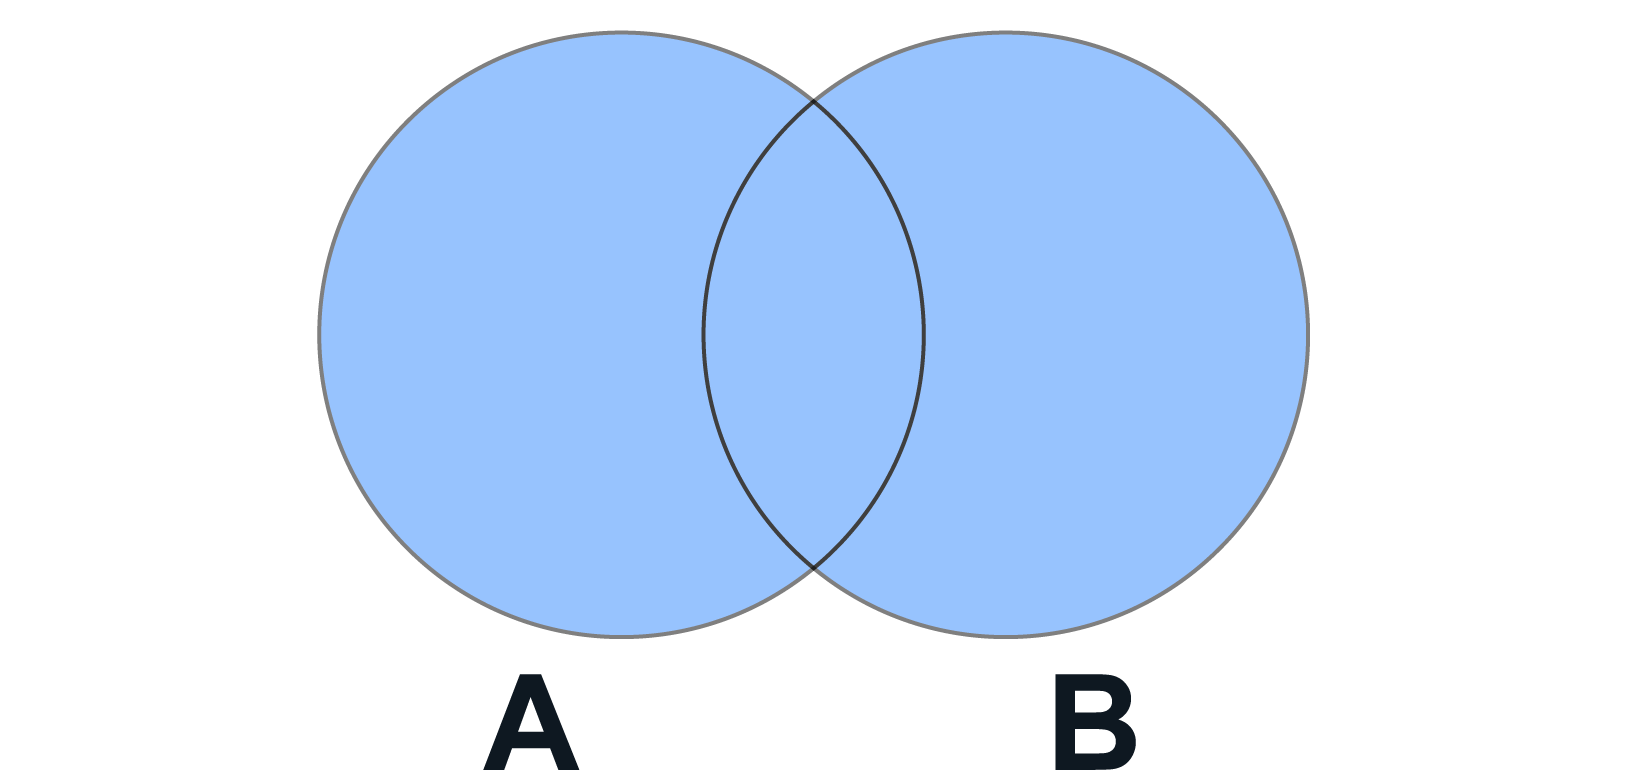
You can represent the intersection of events with a Venn diagram, as shown below. The color blue represents the intersection of events A and B:

-
- Union of an Event
- All outcomes that are part of event A or event B.
- Intersection of an Event
- All outcomes that are part of event A and event B.
2b. Addition Rule
The addition rule provides a way to compute the probability of the union of two events. The addition rule is:

To understand this formula conceptually, consider the following example.
-
EXAMPLE
Imagine you are a marketing analyst for a tech company. You are interested in understanding the potential customer base for a new product. You want to target customers based on their device ownership: iPhone users and Android users. Some customers might own both. If you simply add the probability of being an iPhone user to the probability of being an Android user, you are double-counting those who own both. To correct for this, you subtract the probability of owning both an iPhone and an Android.
If 40% own an iPhone, 60% own an Android, and 10% own both, the probability of owning either an iPhone or an Android is

The Venn diagram below visualizes this scenario:
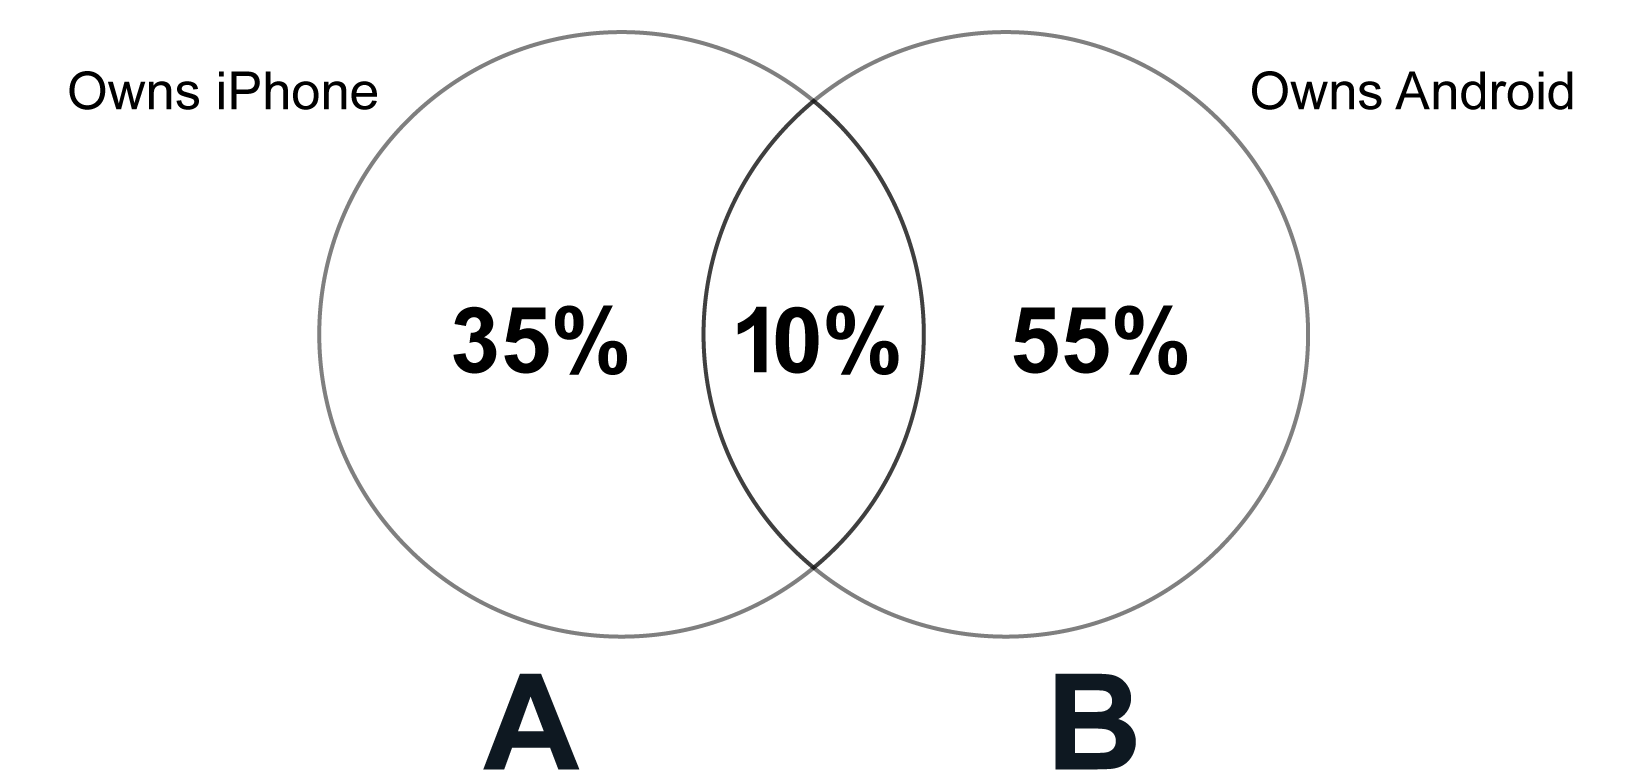
Circle A represents people who own an iPhone (40%).
Circle B represents people who own an Android (60%).
The overlap between the two circles represents people who own both an iPhone and an Android (10%).
The addition rule discussed previously is for events that are not disjoint. If two events A and B are disjoint, then the addition rule for disjoint events is:

The Venn diagram below visualizes the addition rule for disjoint events. The two separate circles represent the two events, with no overlap between them, signifying that the events cannot occur simultaneously. The intersection of these two events would be 0. If the intersection of two events is 0, then the events are disjoint.

To see how to apply the addition rule for disjoint events, consider the following example.
-
EXAMPLE
Returning to your job as a marketing analyst for a tech company, you are still interested in understanding the potential customer base for a new product. Suppose you are targeting two distinct customer segments: businesses and individuals. These segments are disjoint; a customer cannot be both a business and an individual. If you know the probability of a randomly selected person being a business customer is 30% and the probability of them being an individual customer is 70%, then the probability of them being either a business or an individual customer is simply the sum of these probabilities:

Because the events are disjoint, you do not have to subtract out the intersection because there is no overlap of the events. In this example, the customer cannot be a business and an individual customer at the same time.
Let’s apply the addition rule using data in Excel.
-
Below is data related to customer purchases in an online store. The data in the Excel file is
online_purchases.xlsx.

A description of each column is provided below.
-
CustomerID. Unique identifier for each customer.
-
Purchased Electronics. Indicates whether the customer purchased electronics or not.
-
Purchased Clothing. Indicates whether the customer purchased clothing or not.
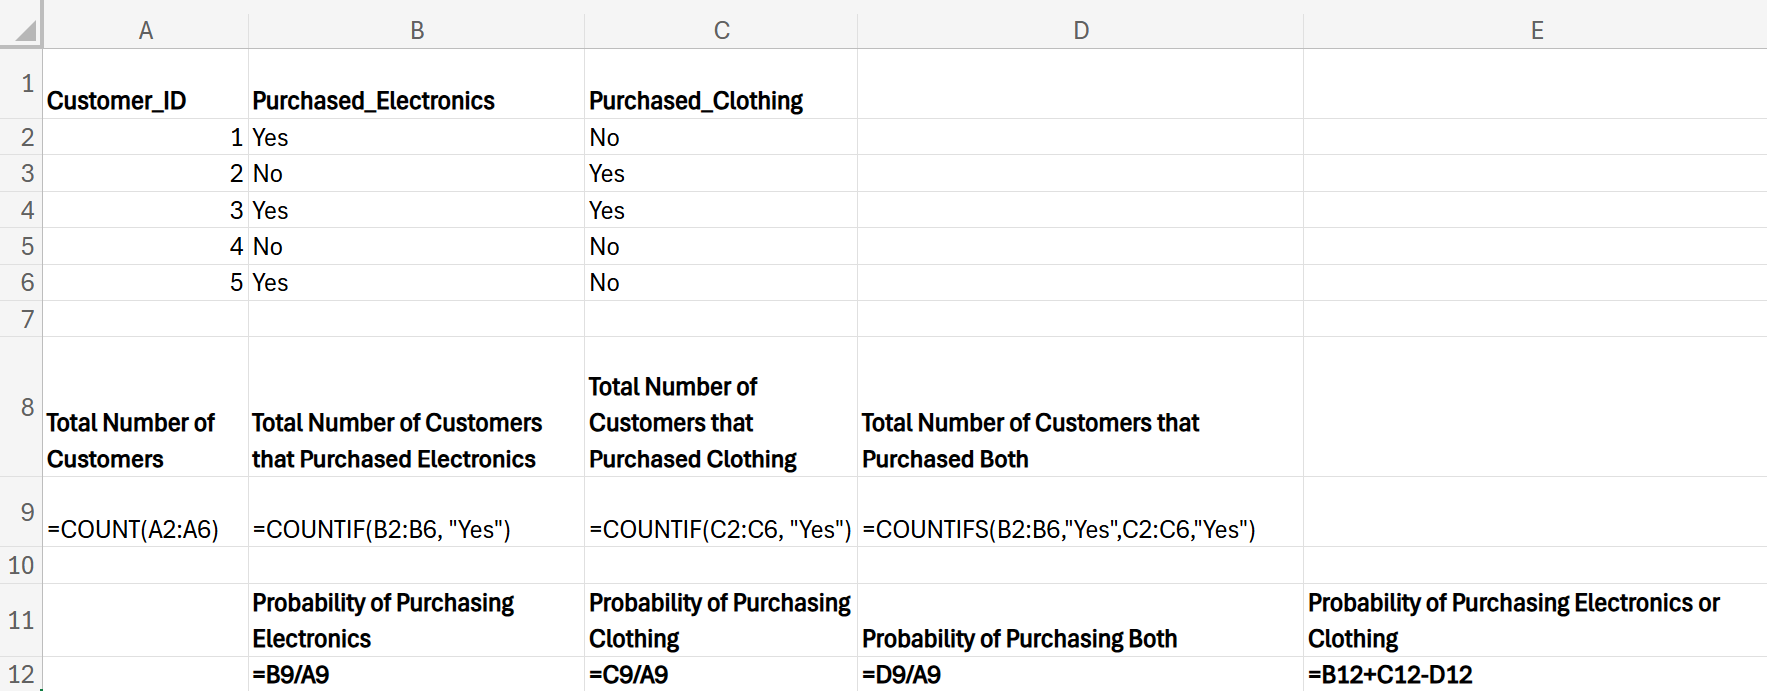
Using Excel, find the probability that a customer purchased either electronics or clothing, using the addition rule in probability.
Solution: The probability of purchasing electronics or clothing is 80%.
The Excel worksheet with the final probabilities is shown below:

Perform the following steps in Excel, using the image immediately after the steps as a reference.
1. Calculate the total number of customers using the COUNT() function. Enter the following in cell A9:
=COUNT(A2:A6)
2. Calculate the number of customers who purchased electronics using the COUNTIF() function. Enter the following in cell B9:
=COUNTIF(B2:B6, "Yes")
3. Calculate the number of customers who purchased clothing using the COUNTIF() function. Enter the following in cell C9:
=COUNTIF(C2:C6, "Yes")
4. Calculate the number of customers who purchased both clothing and electronics using the COUNTIFS() function. Enter the following in cell D9:
=COUNTIFS(B2:B6, "Yes," C2:C6, "Yes")
The COUNTIFS() function in Excel is used to count the number of cells that meet multiple criteria. In this scenario, the formula =COUNTIFS(B2:B6, "Yes," C2:C6, "Yes") is used to count the number of customers who purchased both electronics and clothing. This Excel formula is counting the intersection of two events.
- Event A: A customer purchased electronics (cells in B2:B6 contain “Yes”).
- Event B: A customer purchased clothing (cells in C2:C6 contain “Yes”).
The intersection of these two events

is the number of customers who purchased both electronics and clothing.
Since the intersection of these two events is not 0, this indicates that these two events are not disjoint, and the following addition rule needs to be used:

5. Calculate the probability of purchasing electronics. Enter the following in cell B12:
=B9/A9
6. Calculate the probability of purchasing clothing. Enter the following in cell C12:
=C9/A9
7. Calculate the probability of purchasing both electronics and clothing. Enter the following in cell D12:
=D9/A9
8. Calculate the probability of purchasing electronics or clothing. Enter the following in cell E12:
=B12 + C12 – D12
The Excel worksheet with the Excel formulas is shown below.
In this lesson, you learned about the basic rules of probability that businesses use to make informed decisions. You explored key concepts, such as how the sum of outcomes equals 1 and the complement rule. You also reviewed the union and intersection of events, along with the addition rule. These concepts helped you understand how probabilities are calculated, especially when dealing with disjoint events. You analyzed scenarios where, as a marketing analyst for a tech company, you examined the potential customer base for a new product based on these probability rules.
