In this lesson, you will learn the importance of money management by filling out a monthly budget as part of your personal financial plan and how budgets are used to determine whether you are overspending or have a surplus that can be used toward achieving your goals. Specifically, this lesson will cover the following:
1. The Importance of a Financial Plan and Monthly Budgeting
Now that you begin to see the benefits of financial planning in helping you achieve your goals, the next step is to create a budget to determine where your money goes and how much you have left over to save or invest each month.
First, let’s begin by creating a simple monthly budget. You will need to add together your total income from all sources, such as wages, child support, interest, rental properties, or investments. Typically, we would start with your gross income, which is income before taxes or other deductions, such as health care costs, are subtracted, but since there are many levels of tax calculations depending on your income, dependents, and other factors, we will devote an entire lesson to taxes later.
-
You will use Microsoft Excel in this lesson. If you do not have Microsoft Excel on your device, you can use the free version of Microsoft Office 365. A free account is sufficient for the features used in this course. Sign up for the free version at
www.office.com.
Meet Raychel; she is going to help you prepare a budget.
 Raychel
Manager at a grocery store
(Independent life stage, age 32)
Raychel, a single head of household, works as a manager at a local grocery store in the city where she lives. Raychel currently has no children but is open to a family in the future. Outside of work, Raychel spends some of her free time working with a friend decorating and flipping houses to make extra cash; however, those opportunities are infrequent. Raychel has some student loans from college that she is working toward paying off soon.
Let’s look at Raychel as an example. Her annual income before taxes is $60,511.
Since Raychel is motivated to understand her expenses and better manage her money, she gathers her receipts from last month for items paid in cash and her credit card and bank statements to show her expenses. Raychel has created a personal monthly budget spreadsheet in Microsoft Excel. She will now fill that out.
1a. Entering Income and Formatting Cells
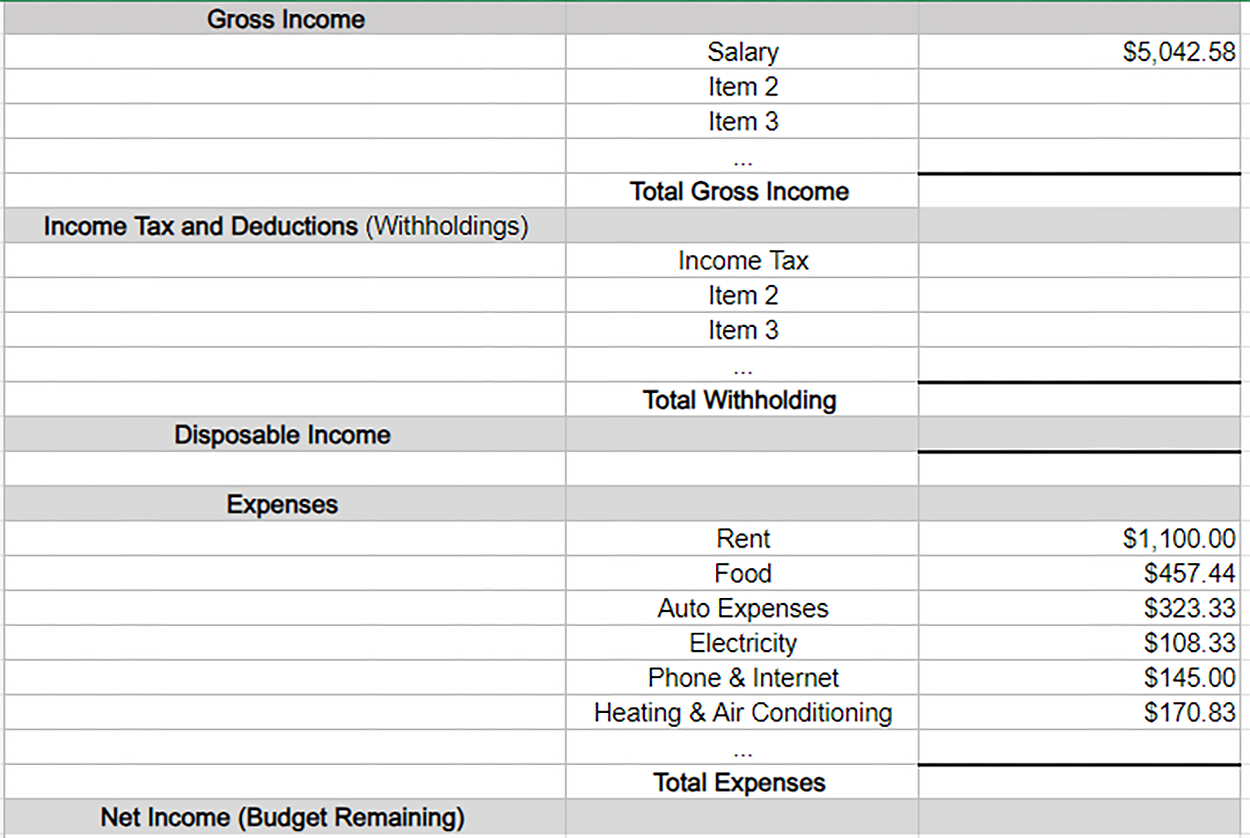
Since Raychel’s annual salary is $60,511, she needs to divide it by 12 to convert it to a monthly salary. This gives Raychel a monthly income of $5,042.58, and she will enter that in the Gross Income section.
-
If you only know your total income for the year, divide the total by 12 to obtain your monthly income and then enter that into the budget worksheet.
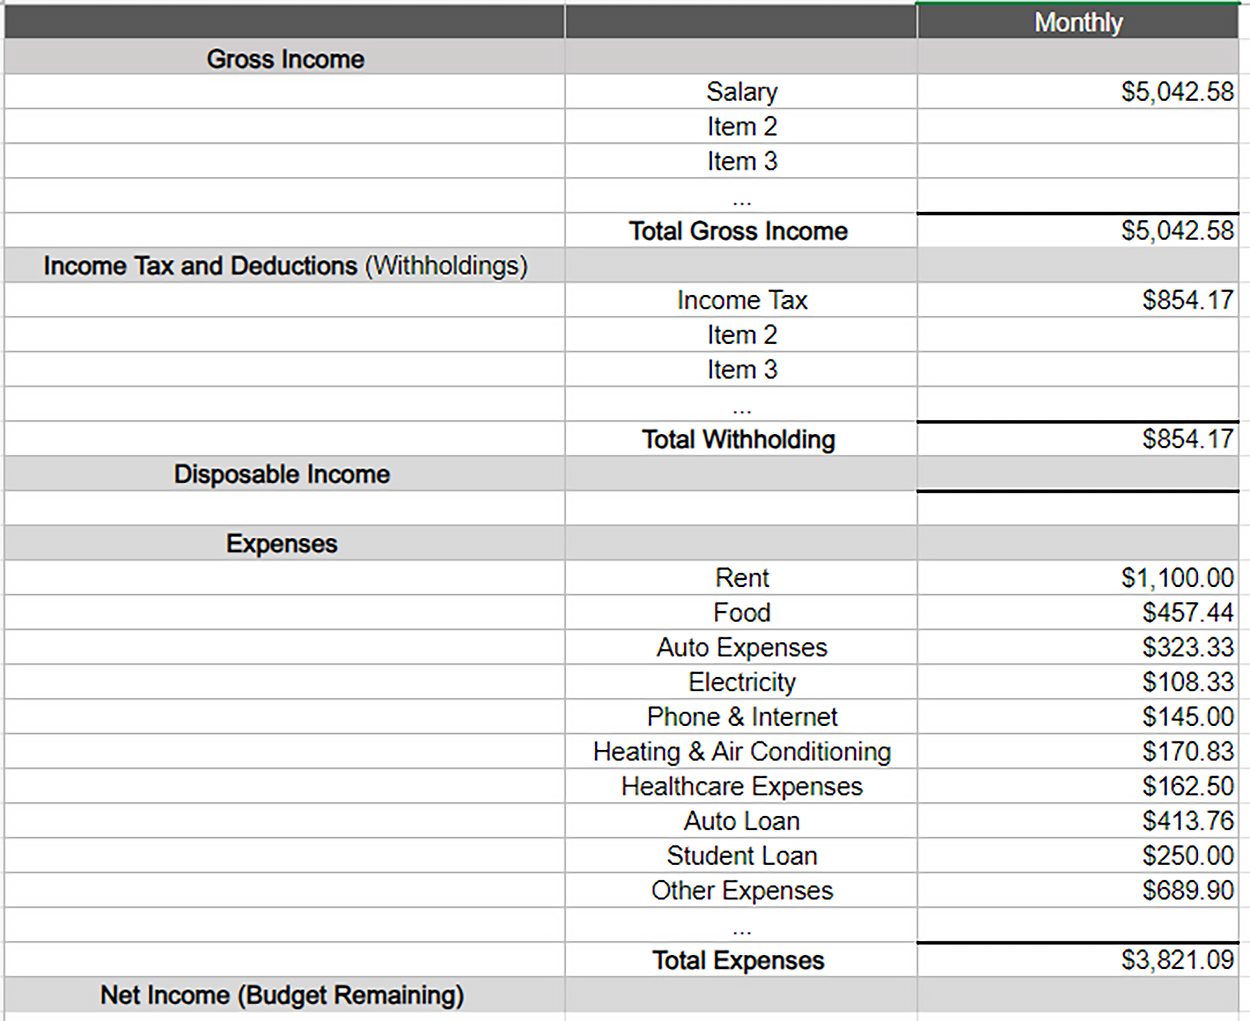
Raychel’s Personal Budget
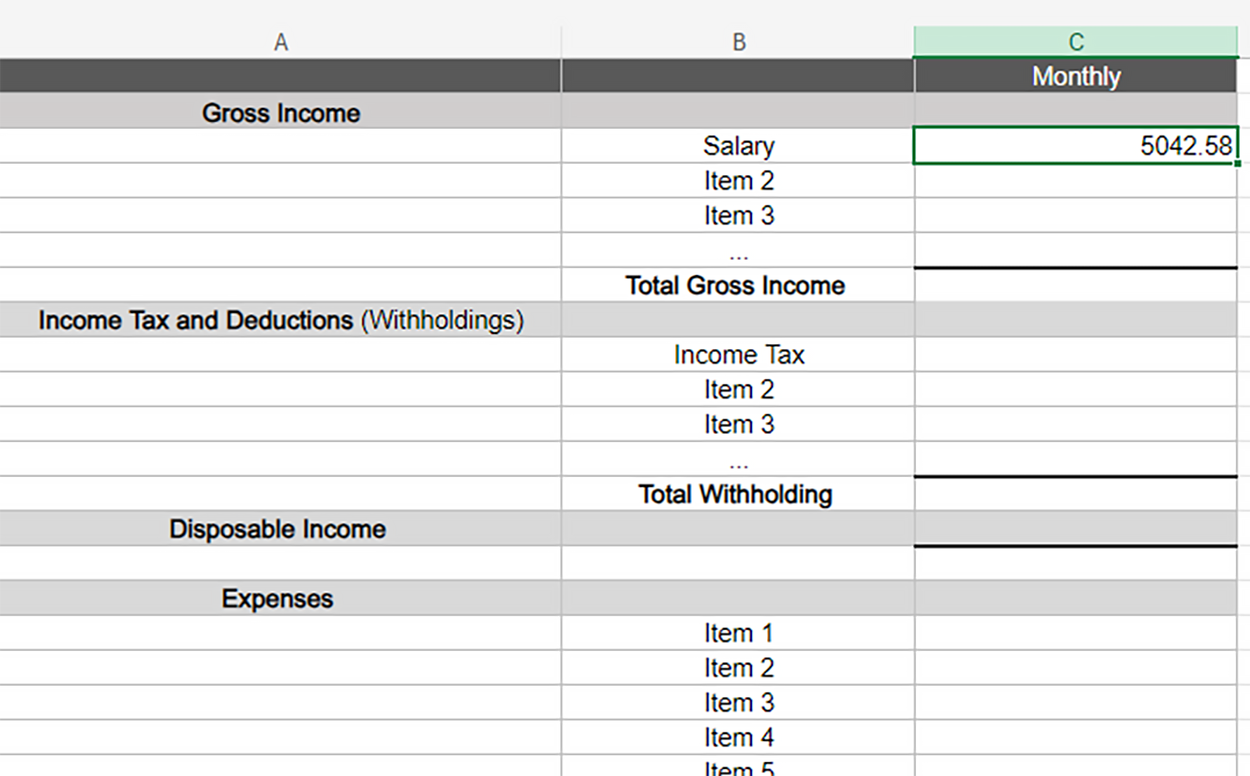
Raychel did not have side jobs last month, so she does not enter any income on the other rows for Gross Income (Item 2, Item 3, ...)
-
Your turn!
Download the Personal Budget spreadsheet and enter Raychel’s monthly salary in the Gross Income section; remember to label the row “Salary.” Raychel currently has no other income sources.
Link:
Personal Budget Worksheet.xlsx
Raychel notices that the input cell is not formatted correctly; it is not showing as currency. This can affect the calculations since she wants dollars and cents to be added and subtracted in her spreadsheet. She needs to format the column cells correctly to do that, so she uses the steps shown below. There is also a video on changing the cell format in a Microsoft Excel spreadsheet.
-
Changing Cell Format in a Microsoft Excel Spreadsheet
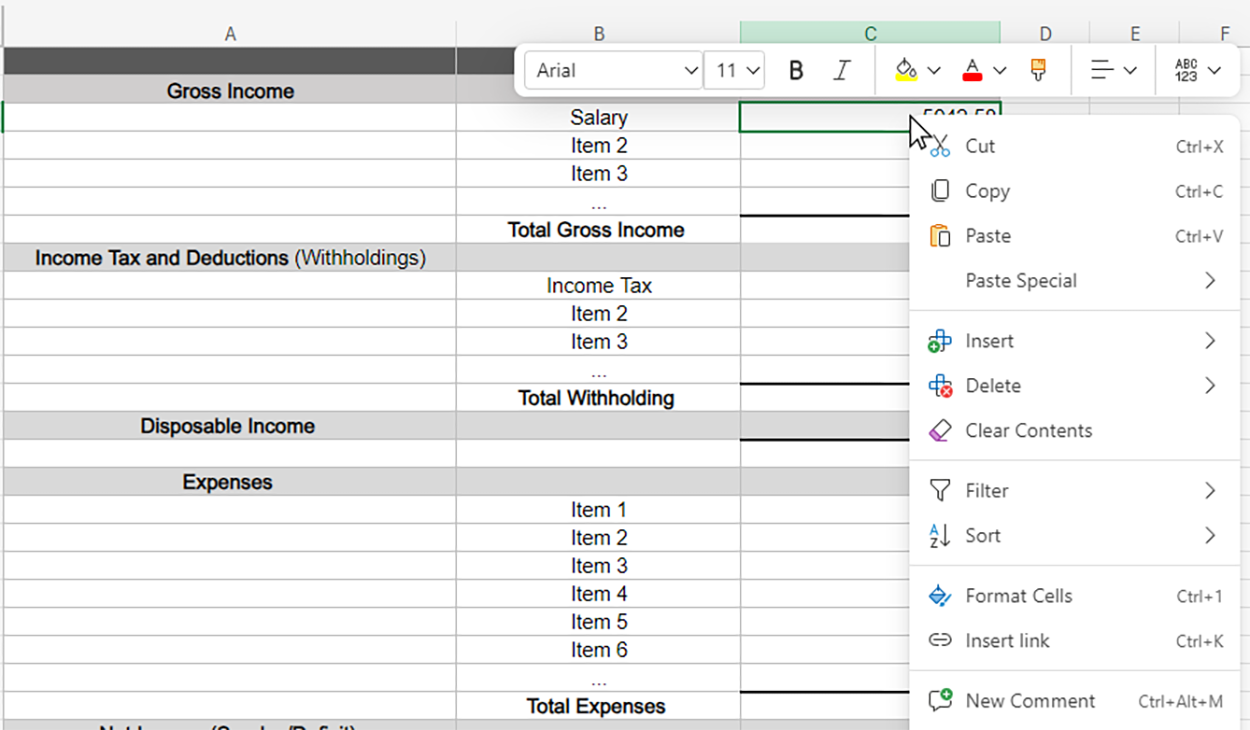
Step 1: In the cell where Raychel placed her monthly income, she right-clicks on the cell.
 Step 2:
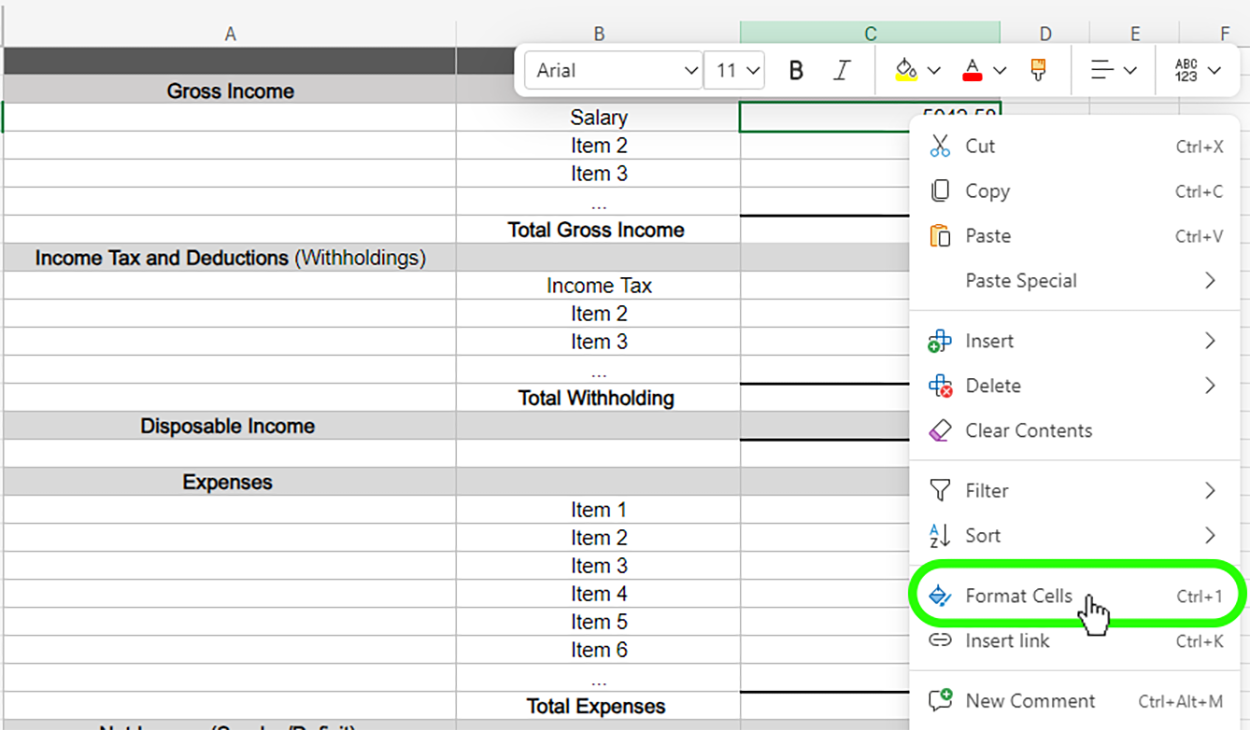
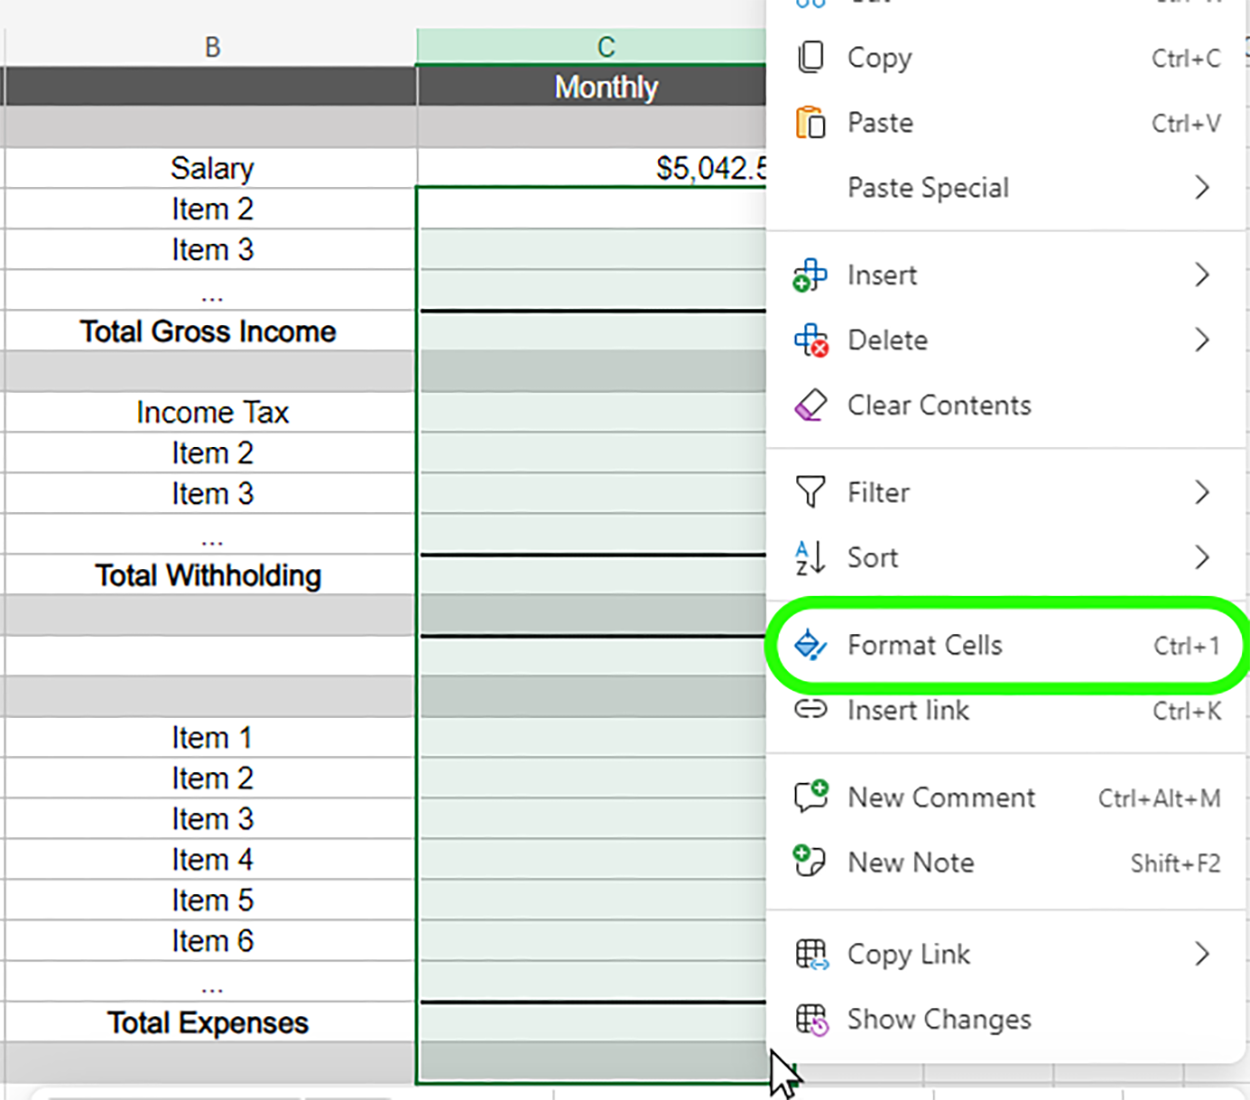
 She selects “Format Cells” from the option menu.
 Step 3:
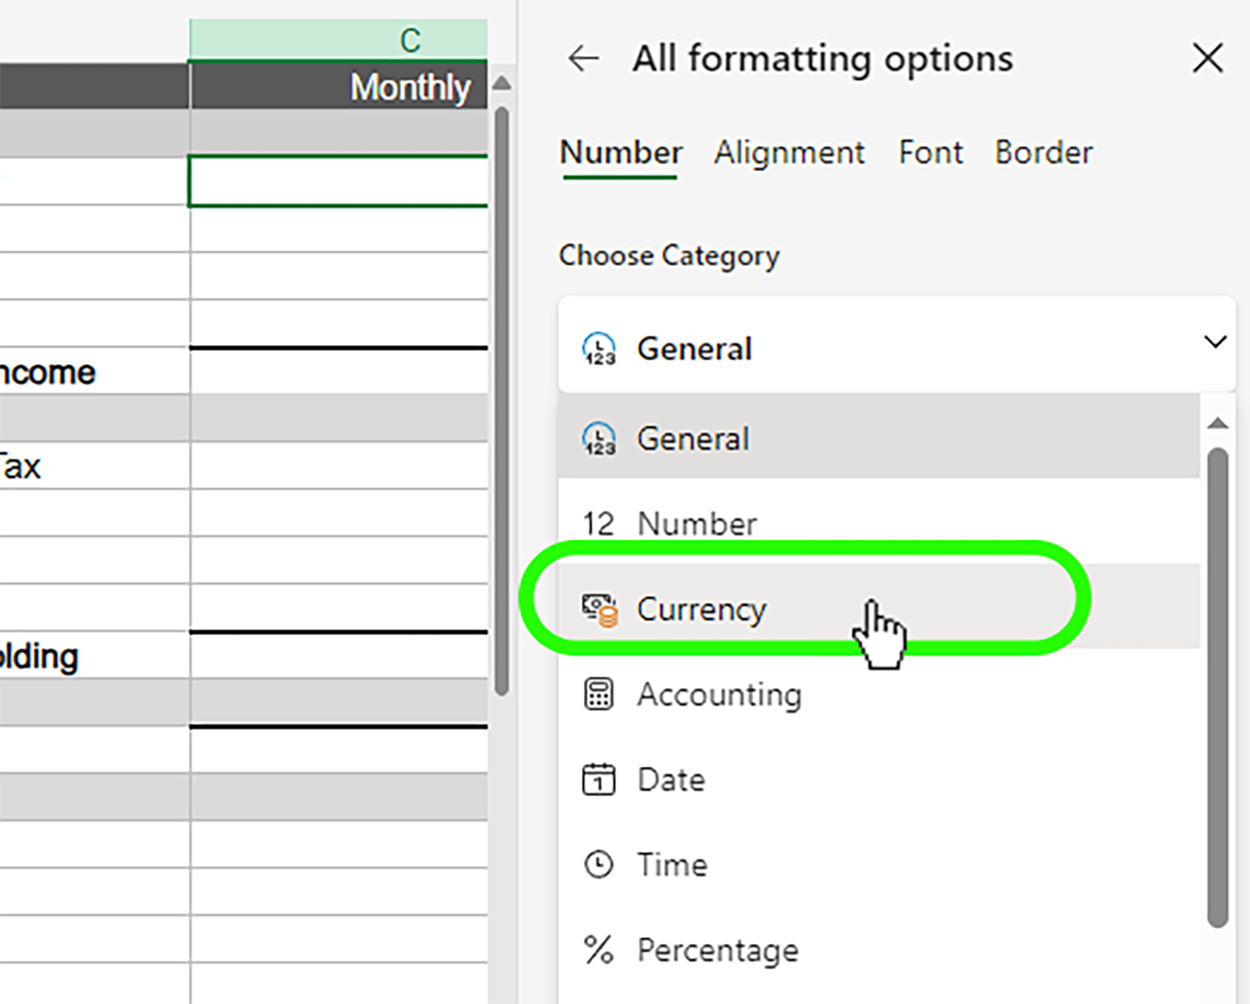
 She selects "Currency” from the formatting options.
 Note:
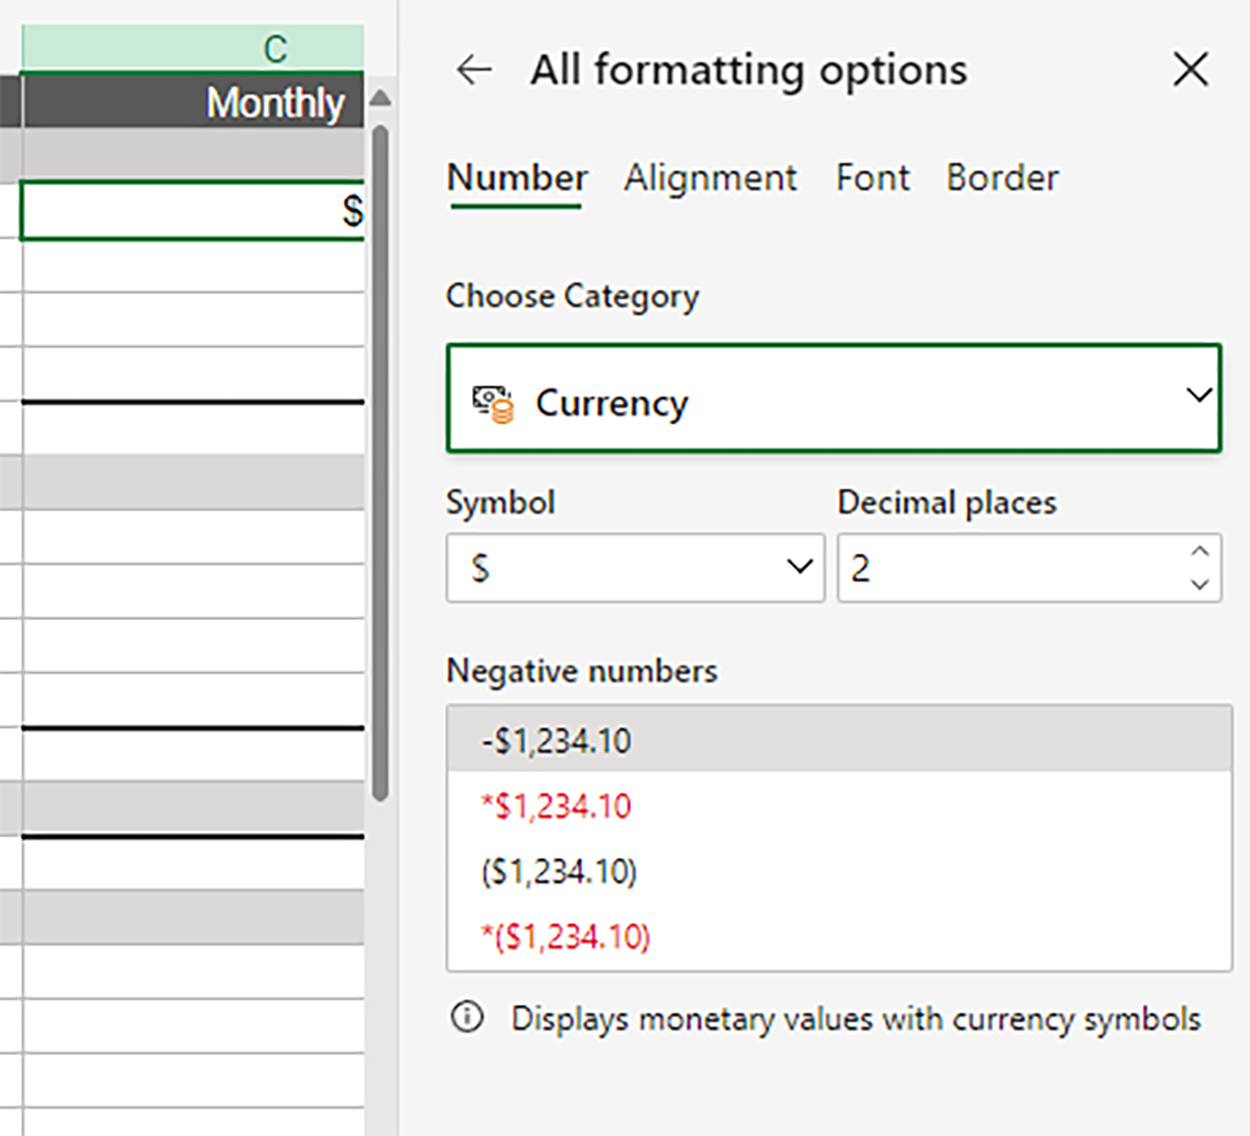
Note: Once she selects “Currency,” another option window appears. This window allows her to change decimal places and choose whether or not she wants the dollar sign to appear to the left of the number and how to handle negative numbers. Raychel keeps the defaults, so she just selects the “X” at the top right.
 Step 4:
 Since Raychel wants all the numbers that will appear in the Monthly column to be formatted as currency, she highlights the rest of the rows in that column and right-clicks again.
As before, she selects “Format Cells” and then “Currency.” Now all the Column C cells are formatted as currency.
-
Changing Cell Format in a Microsoft Excel Spreadsheet
-
Go ahead and change the format of your cells in the Personal Budget spreadsheet. Remember to format all cells in the Monthly column.
Note: The link to the Personal Budget spreadsheet is provided above in the first task. You only need to download it once.
1b. Adding Expenses and Adding Rows
Next, Raychel enters her expenses.
-
A personal budget is an estimation tool. How do you know how much you expect to pay for groceries in a few months? Or how much gas will you need next month? Sometimes, it is tough to determine the monthly or even annual expenses for a particular item.
It may be helpful to put specific expenses, such as the money spent on food, on a credit card so that you can accurately track these each month (but be sure to pay the entire credit card balance off each billing cycle to avoid interest). Many banks, financial services institutions, and online resources also provide tools that categorize transactions by type of expense to help track spending. Then, once you know how much is normally spent on items each month, it is easier to estimate them in the future.
-
Remember, if you only pay an expense once a year, divide the total by 12 to obtain your monthly expense.
Raychel adds the following six items as expenses in the expense area:
|
Rent
|
$1,100.00
|
|
Food
|
$457.44
|
|
Auto Expenses
|
$323.33
|
|
Electricity
|
$108.33
|
|
Phone & Internet
|
$145.00
|
|
Heating & Air Conditioning
|
$170.83
|
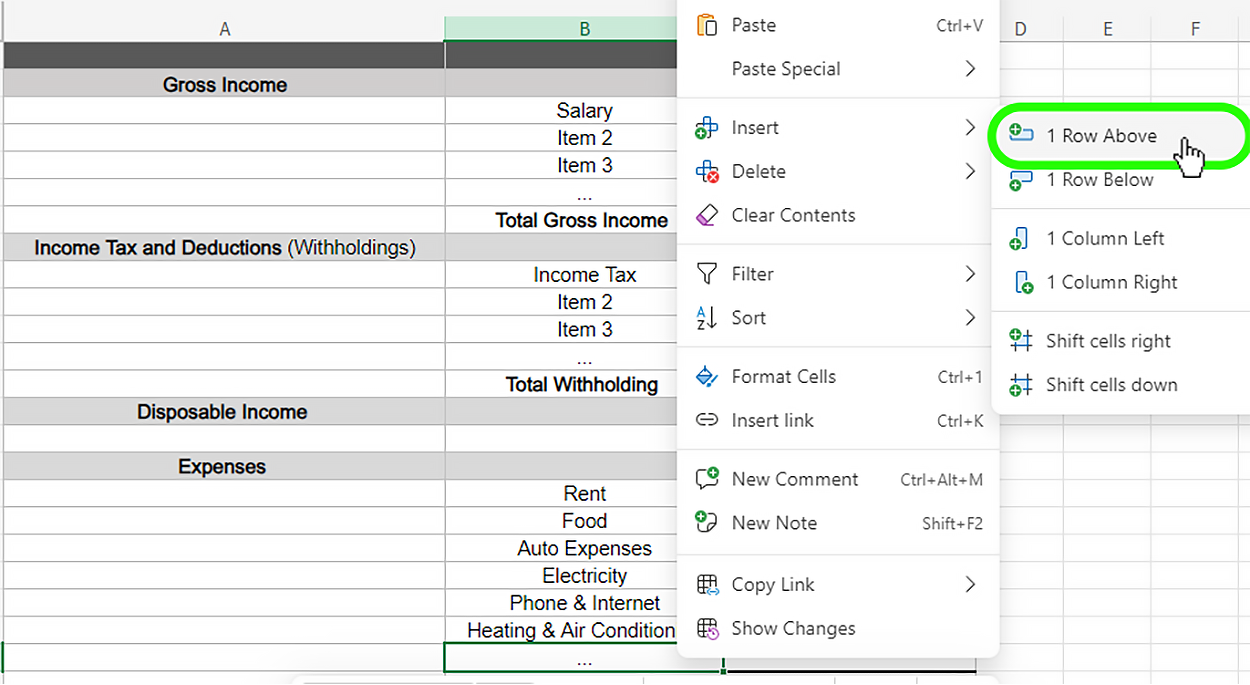
Raychel realizes there are more expenses than she originally allowed in the Excel spreadsheet. She will need to make a few more rows using the steps shown below. There is also a video on adding rows to a Microsoft Excel Spreadsheet.
-
Adding Rows to a Microsoft Excel Spreadsheet
Step 1: In the cell with the three dots (“...” or Row 23), Raychel right-clicks and selects “Insert” and then “1 Row Above.”
 Step 2:
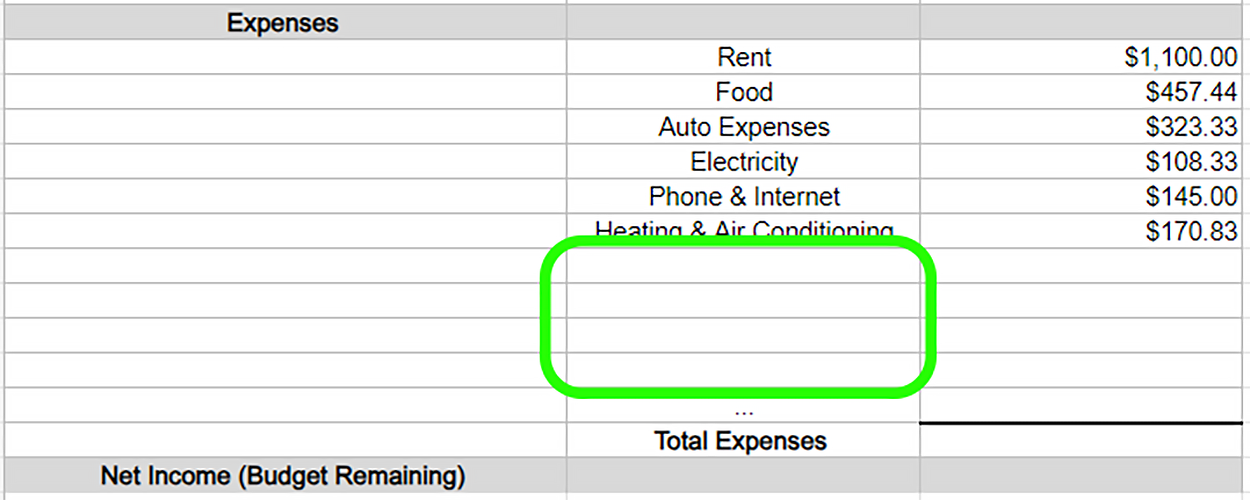
 Raychel adds three more expense rows (total of four).
 Step 3:
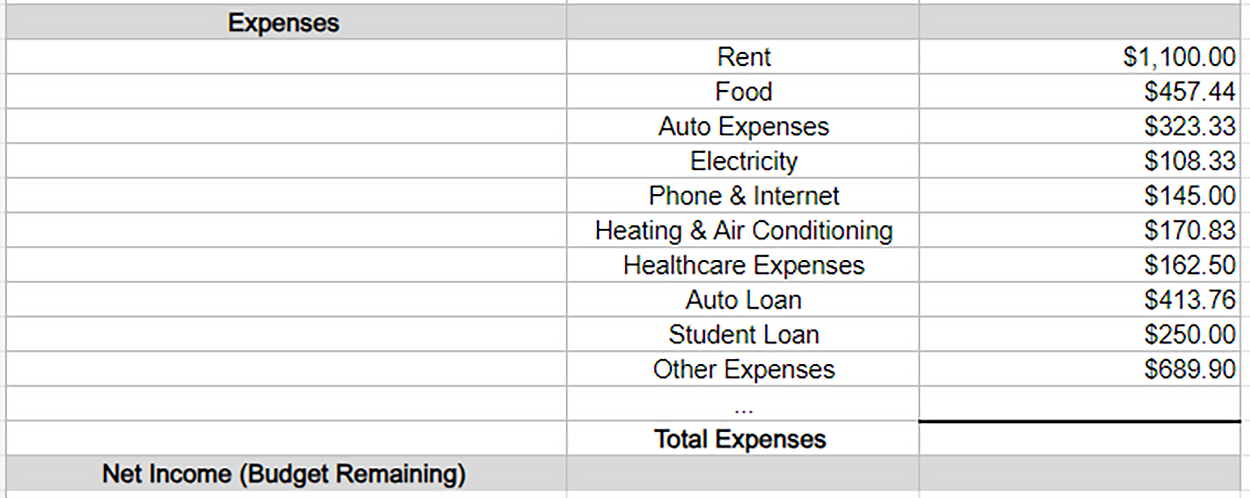
 Raychel adds the following four items she originally missed.
|
Health Care Expenses
|
$162.50
|
|
Auto Loan
|
$413.76
|
|
Student Loan
|
$250.00
|
|
Other Expenses
|
$689.90
|
 Note:
Note: Raychel uses the “Other Expenses” line item as a bucket of various expenses. These expenses could include a retirement account, subscriptions, pet food and care, clothing and personal upkeep, and life insurance. She could list each in its own line or group some together. Regardless of the method, she needs to make sure every monthly expense is accounted for.
Note: One nice aspect of inserting rows is that the new row will take the formatting of the copied row. So, the currency formatting will be copied into the new rows.
Now, Raychel believes she has captured all her monthly expenses.
-
Adding Rows to a Microsoft Excel Spreadsheet
-
Go ahead and add the expenses, including the additional four, to your worksheet.
Note: The link to the Personal Budget spreadsheet is provided above in the first task. You only need to download it once.
1c. Calculating Totals
The next thing Raychel needs to do is sum up her Total Gross Income and Total Expenses rows. Even though she only had one income item last month, she would need to add additional income items if she ever had side jobs. To sum up these cells, she needs to calculate the totals using the steps shown below. There is also a video on using the SUM function in a Microsoft Excel spreadsheet.
-
Using the SUM function in a Microsoft Excel Spreadsheet
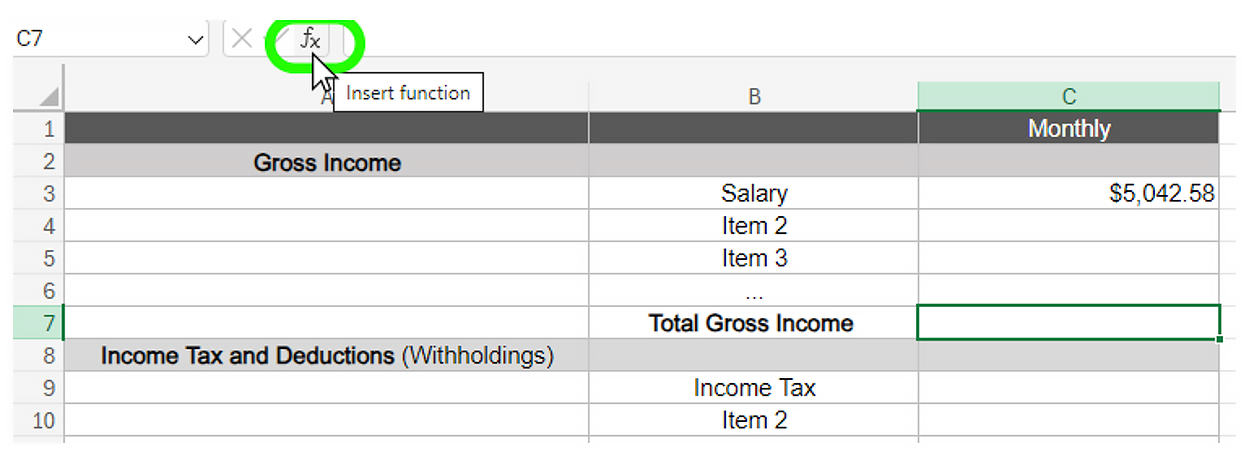
Step 1: Raychel clicks on the empty Total Gross Income cell (making sure it is highlighted).
Step 2: With the cell highlighted, she clicks on the “Insert function” button (“fx”).
 Step 3:
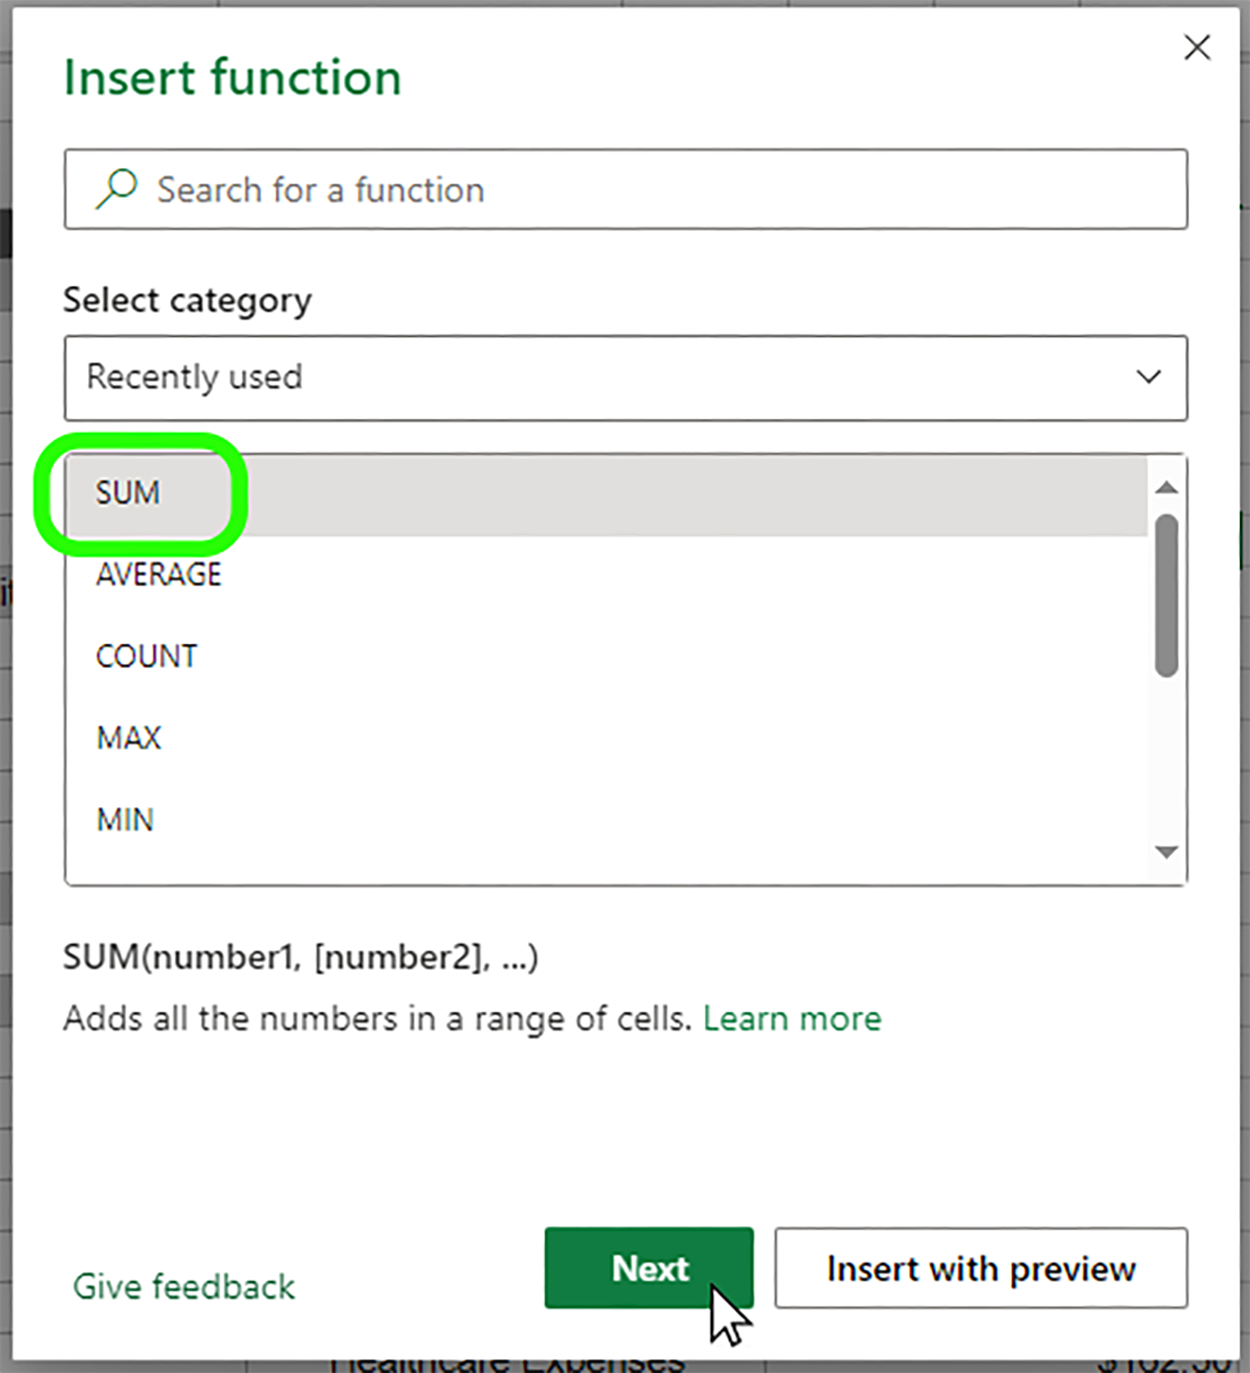
 The “Insert function” window appears; it has many functions available for Excel spreadsheets. For this task, Raychel selects the “SUM” function and clicks “Next.”
 Step 4:
 Now, the “Insert function” window asks for function arguments. This lets Excel know every cell you wish to include in the calculations (SUM). Raychel has two ways she can enter information:
- She can enter the cells to calculate by typing in, for example, “C3:C6,” which tells the spreadsheet to sum up the values in Cells C3 through C6. The colon (“:”) tells Excel that we want one cell to another cell, including any cells in between in the calculation.
- She can move the “Insert function” window out of the way (just drag it around) and select and highlight the cells she wishes to include. This can be an easier way to “collect” all cells.
Either way, the argument for Total Gross Income will be “C3:C6.”
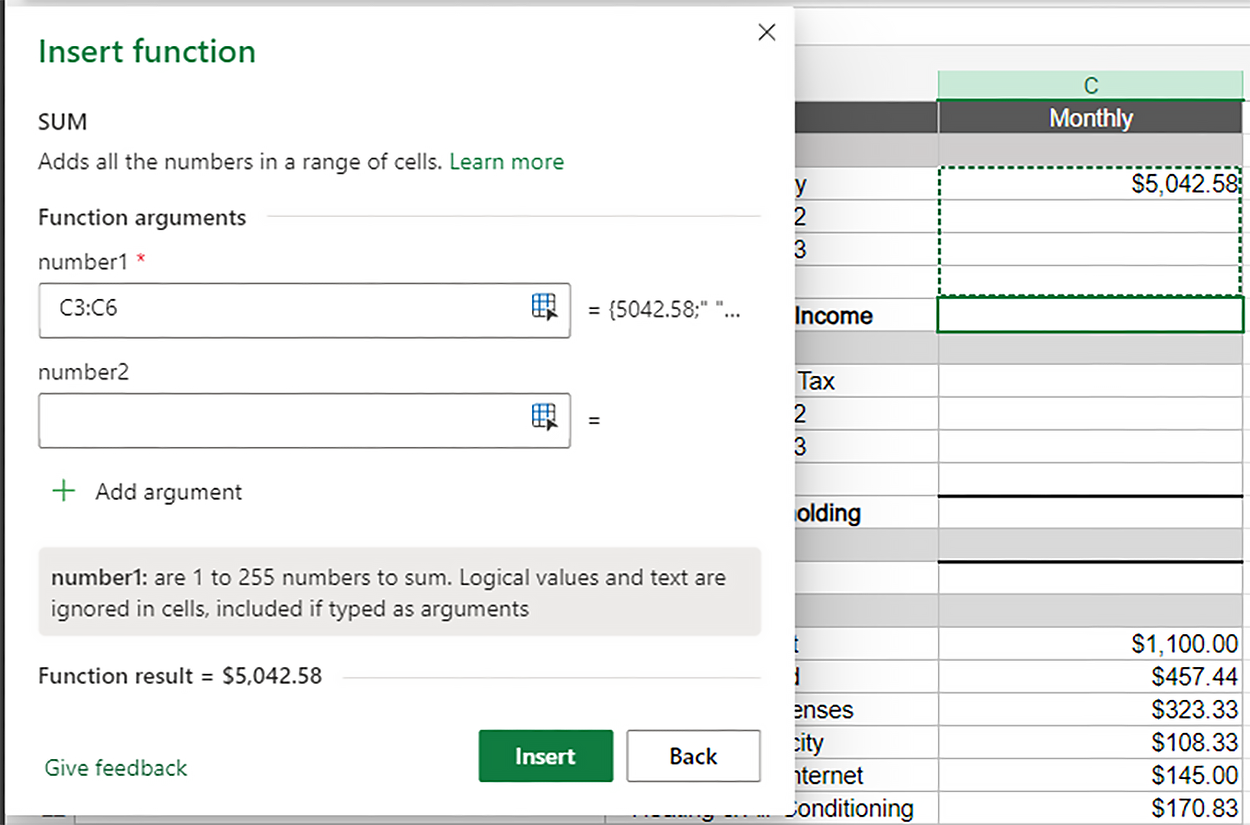
You should now see the Total Gross Income as $5,042.58 since there was no additional income added than straight salary.
Step 5: Now, Raychel highlights the Total Expenses cell and selects the “Insert function” button (“fx”) again. She selects “SUM” and clicks on the “Next” button, this time moving the “Insert function” window out of the way and highlighting all the expenses in the sheet.
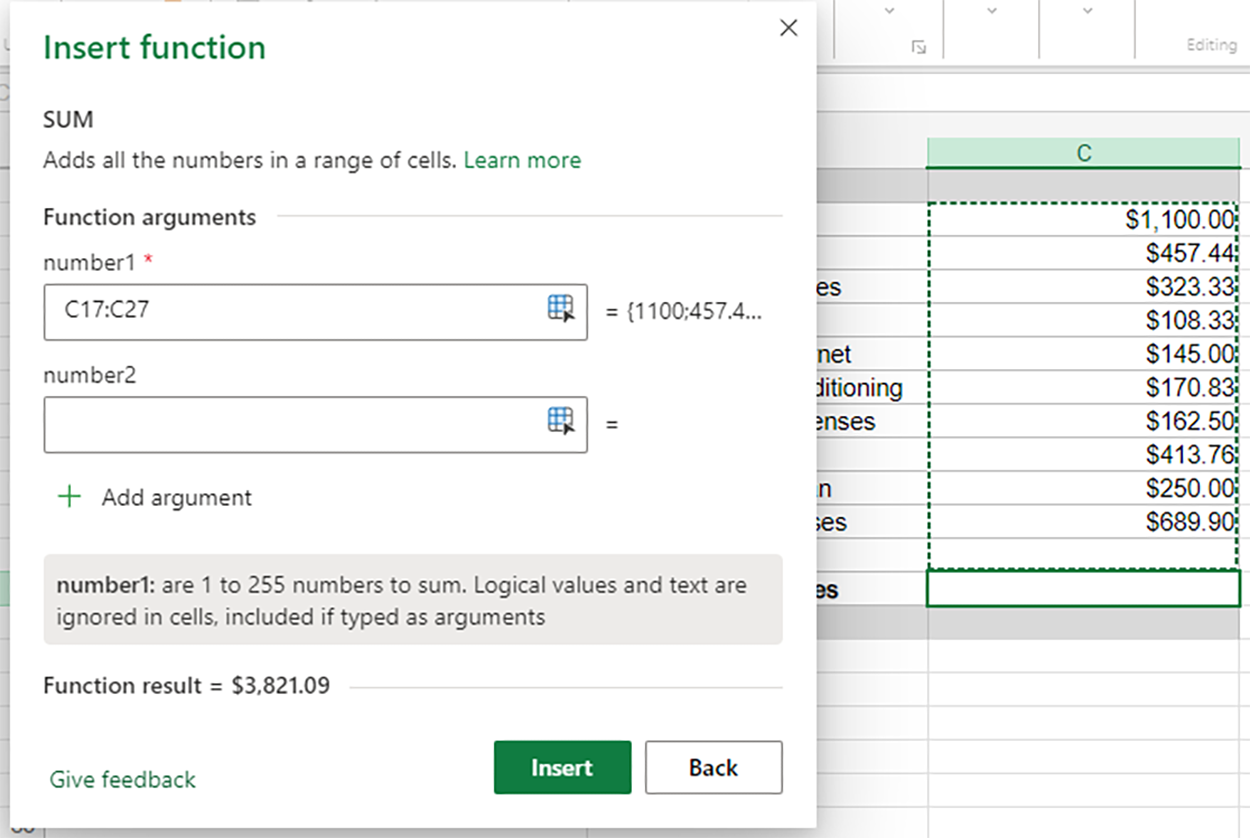
She now has totals for the Total Gross Income and Total Expenses cells.
 Note:
Note: For simplicity, you may have noticed that we populated the Income Tax cell and then calculated the SUM for the Total Withholding, which is the amount that Raychel has withheld from her Gross Income each month. We need to get the Disposable Income amount to be able to finish this spreadsheet, so it was automatically entered. You will learn more about taxes and deductions in a later lesson.
-
Using the SUM function in a Microsoft Excel Spreadsheet
-
Go ahead and SUM up the Total Gross and Total Expenses. You should get the same totals. Do the same for the Total Withholding total (just total the same as the Income Tax we automatically added to Raychel’s spreadsheet).
Note: The link to the Personal Budget spreadsheet is provided above in the first task. You only need to download it once.
1d. Determining the Disposable Income
Now, Raychel wants to calculate her disposable income (also known as take-home pay), or the money you receive that is available to spend. She needs to subtract the Total Withholding from the Total Gross Income amount. To do that, Raychel needs to subtract the totals using the steps shown below. There is also a video on adding and subtracting cells in a Microsoft Excel spreadsheet.
-
Adding and Subtracting Cells in a Microsoft Excel Spreadsheet
Step 1: Since Raychel is subtracting two cells from each other, she doesn’t need to enter the formula window to do that. It’s as easy as entering a formula manually on the formula bar (blank line to the right of the “fx” button. Since Total Gross Income is larger than Total Withholding, Raychel can indicate that one cell is subtracted from the other using the minus sign (“-”). Raychel types in “C7-C13”. Nothing happens! When she manually adds a formula, she needs to add an equal sign (“=”) at the beginning of the formula. So, now she enters “=C7-C13.”
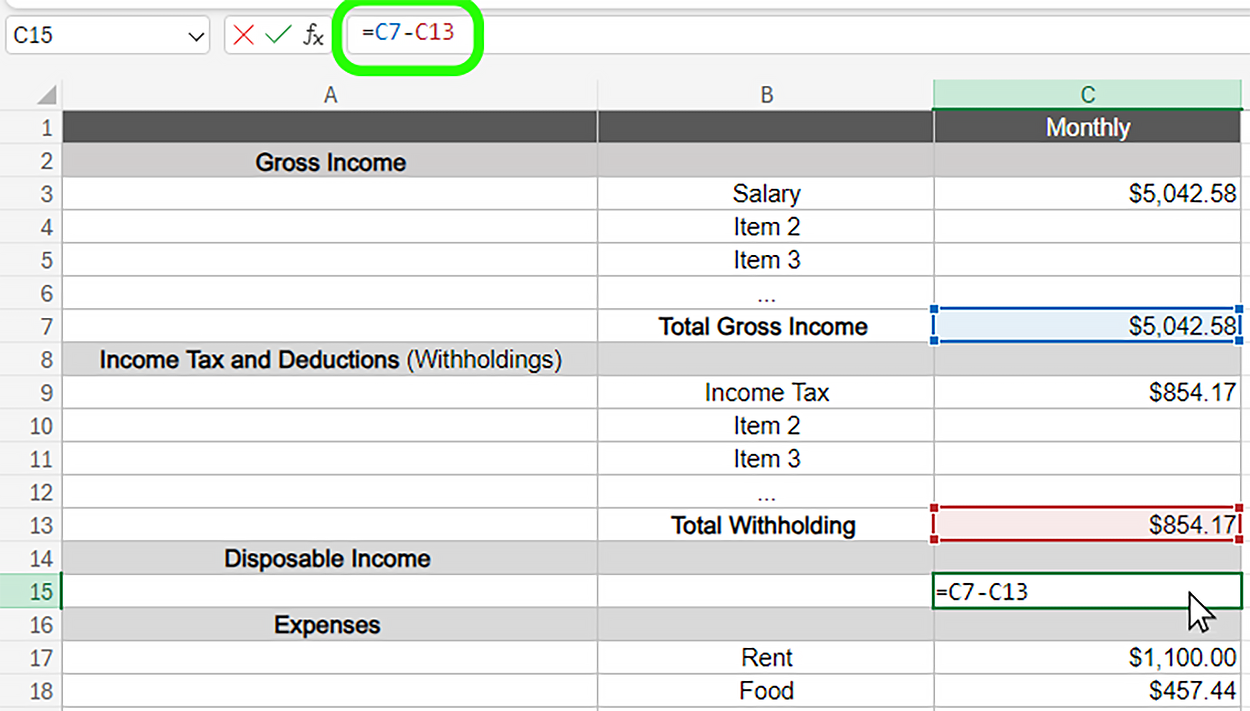
Notice that the cell being subtracted is highlighted in red and the cell you are subtracting from is highlighted in blue. You also notice that the formula is shown in the formula window and in the cell you are making the formula for. Once Raychel selects the “Enter” button on the keyboard, the Disposable Income is shown.

Now, she knows her available monthly disposable income, or take-home pay (after taxes), is $4,188.41. This is the net amount that Raychel receives in a monthly paycheck.
Note: You just saw two cells being subtracted from each other. Adding cells works the same way; just add a plus sign (“+”).
-
Adding and Subtracting Cells in a Microsoft Excel Spreadsheet
-
Your turn: Subtract Total Gross Income from the Total Withholding to see if you get the same Disposable Income.
Note: The link to the Personal Budget spreadsheet is provided above in the first task. You only need to download it once.
1e. Determining the Net Income
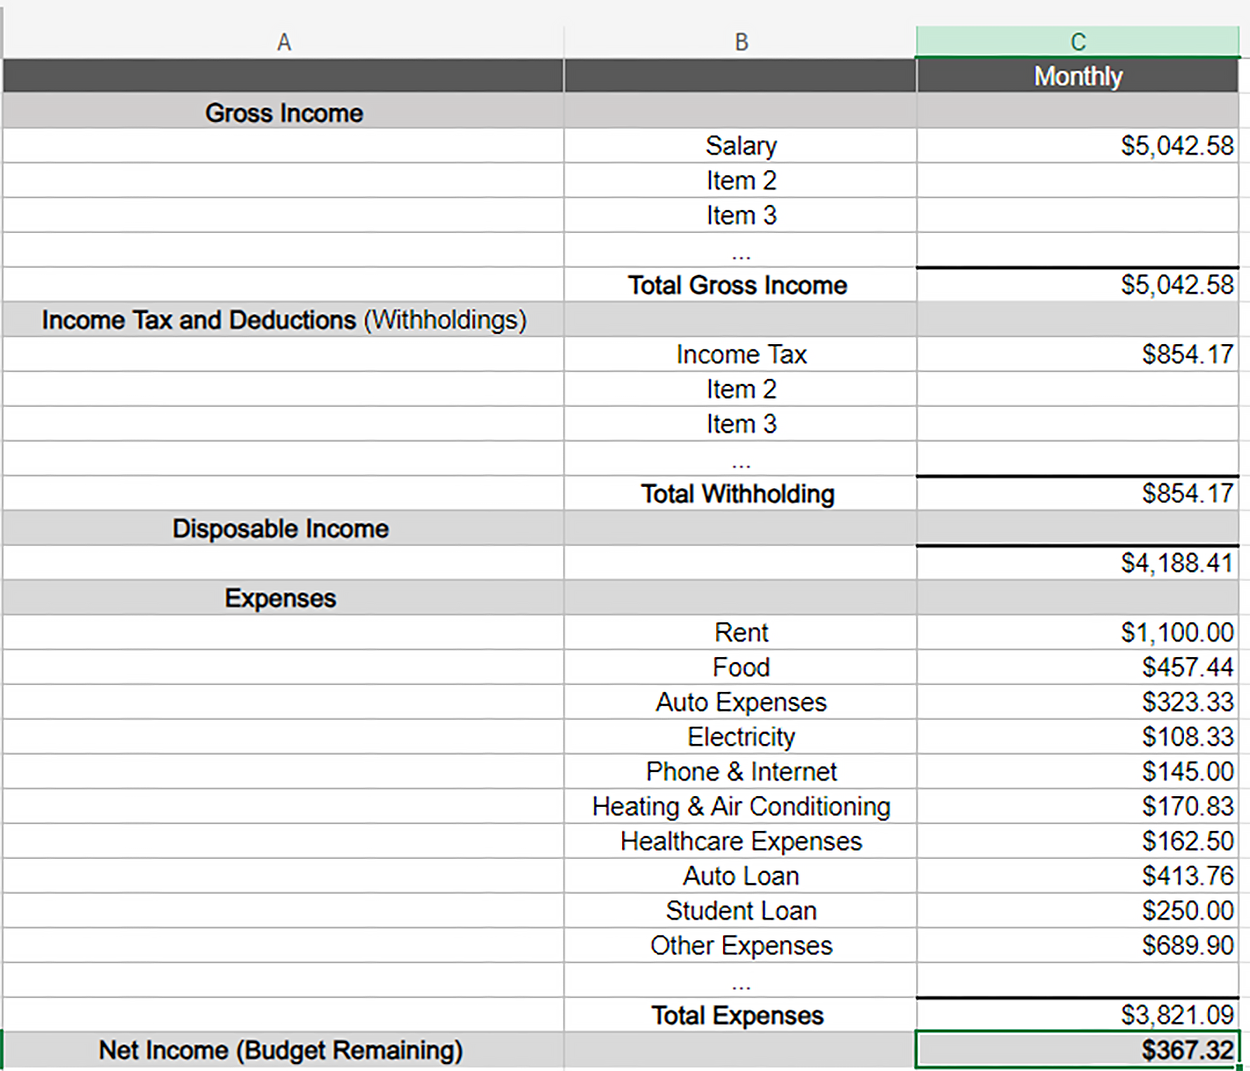
The last step for Raychel is to find her Net Income (also known as the budget remaining after expenses) by subtracting her Total Expenses from her Disposable Income.
-
Adding and Subtracting Cells in a Microsoft Excel Spreadsheet again ...
Step 1: Just like Raychel did in the previous task, she selects the Net Income (Budget Remaining) blank cell and subtracts C15 (Disposable Income) from C28 (Total Expenses) in the formula bar. She types in “=C15-C28" (always remember to include the equal sign). After using the “Enter” button on the keyboard, she sees her completed personal budget.
-
Finally, subtract Disposable Income from the Total Expenses to see if you get the same Net Income.
Note: The link to the Personal Budget spreadsheet is provided above in the first task. You only need to download it once.
-
- Gross Income
- Income before taxes or other deductions, such as health care costs, are subtracted.
- Disposable Income
- Income after deductions, such as federal, state, and local taxes and health care costs. The money you receive that is available to spend. Also known as take-home pay.
2. Budget Surplus or Budget Deficit
-
 Note:
Note: Surpluses or deficits are also called variances or “budget variances” since they are basically any deviation (surplus “up” or deficit “down”) from the planned budget.
Once all the expenses are entered, the total expenses are subtracted from our total disposable income to obtain net income, or income after all taxes, withholding, and expenses are deducted. If your disposable income exceeds your expenses, you have a budget surplus. Having a surplus is the best situation to be in since having extra money allows you to invest in your future.
When the budgeting process reveals that you have a surplus or income remaining after paying living expenses and debt obligations, you have extra cash for additional purchases of assets, such as a home, property, or another major purchase. These additional large assets are called capital expenditures. After capital expenditures are subtracted from net income, the remaining amount is called free cash flow (FCF). Investing your free cash flow can help you achieve a long-term goal, such as financing a child’s education or building wealth for your retirement.
On the other hand, if you discover your expenses are greater than your income, you have a budget deficit, which means you are spending more money than you earn and are short of cash before the end of the month. If this is the case, it is highly likely you are not paying credit card bills, utilities, car payments, or rent fully and on time. These actions cannot continue and will lead to poor credit, eviction, or much worse. You will need to make some sacrifices and change your spending behavior by developing a realistic plan to reverse your budget deficit. We will learn more about poor credit and seeking help to get out of debt in a later lesson.
By completing a budget and listing all her monthly expenses, Raychel now sees that her expenses of $3,821.09 eat up most of her disposable income of $4,188.41, leaving a monthly net income of $367.32. Although her expenses are high, Raychel should feel good that she has a surplus.
-
What if Raychel’s total expenses each month were higher than her disposable income?
If this were the case, she would have a deficit. Suppose her monthly budget looked like the table below with higher expenses:
|
|
|
Monthly
|
|
Gross Income
|
|
|
|
|
Total Gross Income
|
$5,042.58
|
|
Income Tax and Deductions (Withholdings)
|
|
|
|
|
Total Withholding
|
$854.17
|
|
Disposable Income
|
|
|
|
|
|
$4,188.41
|
|
Expenses
|
|
|
|
|
Total Expenses
|
$4,769.31
|
|
|
|
|
|
Net Income (Surplus/Deficit)
|
|
−$580.90
|
Note: Raychel’s detailed expenses are hidden to more simply illustrate a deficit.
Note: Also, notice the change to the last row’s title. Instead of “Net Income (Budget Remaining),” we changed it to “Net Income (Surplus/Deficit).” This resembles an actual personal budget; some may not have “budget remaining” (in a deficit), so this title will satisfy both conditions.
As you can see in the table above, Raychel’s expenses are greater than her income, creating a monthly budget deficit of −$580.90. To address this deficit, Raychel will need to either lower her expenses or find ways to increase her income by working side jobs.
-
In the personal budget above, the budget deficit is shown as −$580.90 (with a negative or minus symbol before the deficit amount). In the financial world, a deficit can be shown two ways:
- −$580.90: This is what we see above; it is more commonly used in personal financing.
- ($580.90): The amount is within parentheses to indicate a negative amount. This is most common in commercial financing and accounting. However, be advised that all outflows of cash may not be noted in parentheses if they are individual items that have not been totaled, such as an itemized list of expenses.
Just keep in mind that if the Net Income row shows an amount with either a minus symbol or inside parentheses, it indicates a deficit amount.
-
Now, it’s your turn to create your own personal monthly budget. The most effective way to create an accurate and useful budget is by reviewing your bank and credit card statements, which show exactly how you spend your income. The budget worksheet you just worked on (with Raychel) lists several expenses; however, you may not have all those listed, or you may have expenses that are not on the list. If an expense is not on the list, add a new row for the expense. You should also add new rows in the income section if you have multiple streams of income. If it is easier, you can download the blank budget sheet again.
Link:
Personal Budget Worksheet.xlsx
Once you have finished entering all your income and expenses, calculate if you have a monthly budget surplus or deficit. This exercise will help you see where your money goes and identify steps toward improving your financial situation.
Keep in mind that you have choices whether you have a budget surplus or deficit. Some options to reduce a deficit or save money are decreasing credit card purchases to get your expenses under control, taking on an additional part-time job, or reducing your living expenses such as rent. Separating your emotions from the financial planning process may be difficult, especially if you must make sacrifices, but doing so will help you make better decisions. The budgeting process is meant to help you see how you can live a better life through money management.
-
The following is a good website to get expense references and other budget sheets:
Financial Workbook.
-
- Net Income
- Income after all taxes, withholding, and expenses are deducted.
- Surplus
- When your income exceeds your expenses and you have extra money available to save or invest.
- Capital Expenditures
- Long-term assets like real estate, automobiles, and other major purchases that require planning and saving.
- Free Cash Flow (FCF)
- The positive cash amount remaining after the deduction of all expenses available for capital expenditures or investment. Also known as net income.
- Deficit
- When your expenses exceed your income and you are spending more than you earn.
In this lesson, you learned the importance of a financial plan and budgeting. You were able to create a monthly budget using Excel by entering income and formatting cells, adding expenses and rows, calculating totals, and determining disposable and net incomes. Next, you learned the difference between a budget surplus or deficit. Remember, after determining your cash surplus or deficit, you should consider your next steps of either reducing your expenses if you have a budget deficit or investing if you have a budget surplus.