In this lesson, you will learn how to apply the Poisson distribution to find probabilities that solve business data analytics problems. Specifically, this lesson will cover:
-
This lesson builds on key concepts from an Introduction to Statistics course. Specifically, we will cover Poisson distributions, assuming familiarity with this foundational idea.
1. Introduction to the Poisson Distribution
The Poisson distribution is a probability distribution that describes the likelihood of a given number of events happening within a fixed interval of time or space. It’s particularly useful for modeling events that occur randomly and independently.
Consider that you manage a small retail store and want to understand how many customers visit your store per hour. If you know that, on average, 10 customers visit your store every hour, you can use the Poisson distribution to find the probability of different numbers of customers arriving at any given hour. The Poisson distribution is ideal for modeling the number of events (in this case, customer arrivals) that occur within a fixed interval of time (one hour), especially when these events happen independently of each other.
Other applications of the Poisson distribution are:
-
Website traffic. Suppose you run an e-commerce website and want to analyze the number of orders placed per minute. If, on average, you receive 5 orders per minute, the Poisson distribution can help you find the probability of receiving a certain number of orders in the next minute.
-
Call center operations. In a call center, the Poisson distribution can be used to model the number of incoming calls per minute. For instance, if a call center receives an average of 20 calls per hour, the Poisson distribution can help in staffing decisions by determining the probability of receiving a specific number of calls in an hour.
-
- Poisson Distribution
- A discrete probability distribution that models a given number of events occurring within a fixed interval of time or space.
1a. Benefits of Understanding the Poisson Distribution
Understanding the Poisson distribution offers several benefits, especially in business data analytics. Here are some key advantages:
-
Risk Management in Insurance: Insurance companies use the Poisson distribution to model the number of claims within a certain period, helping them set premiums and reserves accurately.
-
Risk Management in Quality Control: In manufacturing, it can be used to model the number of defects in a batch of products, aiding in quality control processes.
-
Marketing Campaigns: Poisson distribution can be applied to anticipate the response rate to marketing campaigns, allowing for better allocation of marketing resources.
-
Customer Behavior Analysis: Understanding customer visit patterns or purchase frequencies can provide deeper insights into customer behavior, enabling more personalized marketing strategies.
1b. Poisson Distribution
The Poisson distribution is a type of probability distribution that explains the chances of a certain number of events happening within a set period of time or space.
Below are some key characteristics of the Poisson distribution:
-
Discrete events over a time interval: It deals with discrete events, meaning it counts occurrences that occur in a fixed time period or space (for example, the number of emails received in an hour). These events are distinct and separate from each other.
-
Mean and variance: In a Poisson distribution, the mean (average number of events) and the variance (measure of the spread of the distribution) are both equal to a parameter known as λ (pronounced “lambda).
The probability of observing
k events in a fixed interval is given by:

where

is the probability of
k events in the interval
λ is the average number of events (rate parameter)
e is the base of the natural logarithm (approximately equal to 2.71828)
k is the number of events, and
k ! is the factorial of
k.
1c. Steps to Apply the Poisson Distribution
Applying the Poisson distribution to an actual problem involves several steps. Here’s a general guide to help you through the process:
1. Identify the Event and Interval.
- Determine the event you want to model (for example, customer arrivals, website hits, machine failures).
- Define the fixed interval of time or space (for example, per hour, per day, per square mile).
2. Calculate the Average Rate λ.
- λ is the average number of events occurring in the given interval. This can be calculated from historical data.
- For example, if a store receives an average of 10 customers per hour, then
 .
.
3. Use the Poisson Formula.
- The Poisson probability formula is
This formula calculates the probability of observing exactly
k events in the interval.
1d. Finding Exact Probabilities Using the Poisson Probability Distribution
Let’s look at how you apply the Poisson probability distribution in several real-world business data analytics scenarios.
-
EXAMPLE
You are assisting the manager of a retail store to analyze the flow of customers in their store. From historical data, you know that 10 customers visit the store every hour. You want to find the probability that exactly 8 customers will visit the store in one hour. You will report this probability and provide a practical interpretation of this probability to the manager.
Let’s use the steps from the previous section to apply the Poisson probability distribution.
1. Identify the Event and Interval.
- Event: customer arrivals
- Interval: one hour
2. Calculate the Average Rate λ.
λ = 10 customers per hour.
3. Use the Poisson formula.

While you could calculate this probability using hand calculations, it is more realistic that you will use Excel. Excel has a built-in Poisson distribution named POISSON.DIST() that makes this calculation straightforward.
To find the probability of exactly 8 customers arriving in an hour, use the Excel formula POISSON.DIST(k, mean, cumulative), which has three arguments.
The arguments are described below.
-
k is the number of events (customers), which is 8.
- mean is the average rate, λ, which is 10.
- cumulative should be FALSE because we want the probability of exactly 8 events, not the cumulative probability.
Open a blank Excel workbook, select any cell where you would like the result to appear, and enter the following formula.
=POISSON.DIST(8,10,FALSE)
The value 0.1126 (rounded) should appear in the cell.
The probability that exactly 8 customers will arrive in one hour is 11.26%.
A probability of 0.1126 (or 11.26%) means that there is an 11.26% chance of exactly 8 customers arriving in an hour when the average rate is 10 customers per hour. Understanding this probability can assist the store manager in several ways, such as:
- If you know there’s an 11.26% chance of having exactly 8 customers in an hour, the manager can plan your staffing levels accordingly. For example, the manager might decide to have more staff during peak hours when the probability of higher customer arrivals is greater.
- Knowing the likelihood of customer arrivals can assist the manager in managing inventory more effectively. If the manager expects a certain number of customers, he or she can ensure there is enough stock to meet demand without overstocking.
- The manager can use this information to plan promotions or special offers during times when customer traffic is expected to be lower, thereby attracting more customers during those periods.
-
You are analyzing data for a customer support team at an online retail store. From historical data, you know that, on average, 15 customer support tickets are submitted per hour. To help plan staffing levels, you want to find the probability of receiving exactly 20 support tickets in the next hour.
-
Given that the probability of receiving exactly 20 customer support tickets in an hour is 4.18%, what does this tell you about the customer support operations, and how might you use this information to make decisions about staffing and resource allocation?
Now, let's look at a real-world scenario of using the Poisson distribution in which you must calculate the average rate, λ, from historical data that a company has collected. This is the real-world scenario!
-
You are analyzing data for a manager of an e-commerce website and want to analyze the number of orders received per hour. Analyze the e-commerce order historical data to calculate the probability that the website will receive exactly 15 orders. The data in the
hourly_order_data.xlsx file contains the number of orders received each hour over the past 7 days, presuming there are 24 hours in a day.
- Calculate the average number of orders per hour (λ).
- Use the Poisson distribution to find the probability of receiving exactly 15 orders in a given hour.
The completed Excel worksheet is shown in the screenshots below.
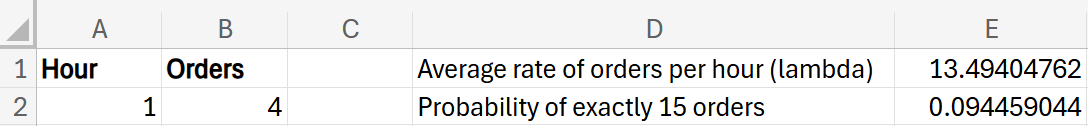
There are two columns in the Excel file.
-
Hour: specific hour an order was received.
-
Orders: number of orders received in a particular hour.
Answer: 9.45%
1. Calculate the average rate, λ, which is the average rate of orders per hour. Perform the following in Excel.
Enter
Average rate of orders per hour (lambda) in cell D1.
In cell E1, enter the following formula:
=AVERAGE(B2:B169)
2. Calculate the probability of receiving exactly 15 orders using the POISSON.DIST() Excel function.
Enter
Probability of exactly 15 hours in cell D2.
In cell E2, enter the following formula:
=POISSON.DIST(15,E1,FALSE)
For guidance, use the provided screenshot with Excel formulas:

-
Follow along with this video to calculate the probability that the website receives exactly 15 orders.
1e. Finding Cumulative Probabilities Using the Poisson Probability Distribution
Finding cumulative probabilities in a Poisson distribution is performed in a similar fashion as for the binomial distribution. It involves summing individual probabilities up to a certain point. For the binomial distribution, it is the sum of probabilities of successes in a number of trials or activities. For the Poisson distribution, it’s the sum of probabilities of events happening in a given interval.
The table below provides a comparison of the POISSON.DIST() function in Excel, focusing on the cumulative argument. The table displays how setting the cumulative argument to TRUE or FALSE affects the output of the function. Additionally, the table provides guidance on how to handle “at least” and “at most” scenarios.
|
Argument
|
TRUE
|
FALSE
|
|
Description
|
Returns the cumulative probability, which is the probability of having up to and including x events
|
Returns the probability of having exactly x events
|
|
Example
|
=POISSON.DIST(8, 10, TRUE)
|
=POISSON.DIST(8, 10, FALSE)
|
|
Result
|
Probability of receiving 0, 1, 2, …, up to 8 events when the average rate is 10
|
Probability of receiving exactly 8 events when the average rate is 10
|
|
"At least" Situation
|
Use 1 - POISSON.DIST(x-1, mean, TRUE) to find the probability of at least x events
|
|
|
"At most" Situation
|
Use POISSON.DIST(x, mean, TRUE) to find the probability of at most x events
|
|
-
-
Follow along with this video to calculate the probability that the website receives at most 15 orders.
-
-
Follow along with this video to calculate the probability that the website receives at least 15 orders.
In this lesson, we examined the Poisson distribution, which is a discrete probability distribution that provides the probability of a given number of events occurring within a fixed interval of time or space. The Poisson distribution is particularly useful in business data analytics for scenarios involving analyzing the rate at which customers visit a store or the rate at which customer support tickets are entered for a help desk. Additionally, you explored the cumulative probabilities from a Poisson distribution to find probabilities of outcomes up to a certain point. Using an example of the number of orders an online e-commerce website receives per hour, you were able to evaluate the probability of at most a certain number of orders per hour. Then, you computed the probability of achieving at least a certain number of orders per hour. These cumulative probabilities assist businesses in making informed decisions by evaluating the likelihood of various outcomes.
