In this lesson, you will learn about point estimation for means and proportions, with a review of sample statistics and population parameters. Specifically, this lesson will cover:
1. Introduction to Point Estimation
In the last tutorial, you learned that samples can provide good estimates of the whole group. This means that a well-chosen sample can reflect the characteristics of the entire population. This is where point estimators come into play.
A point estimator is a statistic that provides an estimate of a population parameter. For example, if you want to know the average height of students in a school, you might take a sample of 50 students and calculate the average height of those 50 students. This average is a point estimator of the true average height of all students in the school.
Sampling is linked to point estimators in several ways, such as:
-
Representativeness: A good sample should be representative of the population. If the sample is representative, the point estimator (like the sample mean) will be close to the true population parameter (like the population mean).
-
Unbiasedness: An unbiased point estimator means that, on average, it hits the true population parameter. Random sampling methods, like simple random sampling, help ensure that our point estimators are unbiased.
-
Precision: The larger and more representative the sample, the more precise the point estimator will be. Precision refers to how much the estimates vary from sample to sample. Larger samples tend to give more precise estimates.
Imagine you want to estimate the average spending of customers in a store. You cannot ask every customer, so you take a random sample of 100 customers and find their average spending. This average spending is your point estimator. If your sample is representative, this point estimator will be a good estimate of the average spending of all customers.
By using proper sampling methods, as you learned previously, you can ensure that the point estimators are accurate and reliable. This allows us to make informed decisions based on the data collected from a sample, rather than needing to survey the entire population.
Let’s now look at several common point estimators.
-
- Point Estimators
- Statistics used to provide a single best guess or estimate of an unknown population parameter based on sample data.
1a. Key Concepts for Point Estimations
Distinguishing between population and sample information is a review of content covered earlier in the course, but these are key concepts in understanding point estimators. As a reminder:
Population vs. Sample:
- Population: The entire group you are interested in.
- Sample: A subset of the population used to make inferences about the whole group.
Parameter vs. Statistic:
- Parameter: A value that describes a characteristic of a population.
- Statistic: A value that describes a characteristic of a sample.
1b. Point Estimations for Means and Standard Deviations
A point estimator for the population mean, μ, is a statistic that estimates the entire population's true mean based on a sample. The most common point estimator for the population mean is the sample mean,  .
.
-
estimates μ
To estimate the population standard deviation, σ, use the sample standard deviation,
s.
-
s estimates σ
-
EXAMPLE
You are a data analyst at a financial firm. Your manager has asked you to analyze the daily closing prices of a particular stock to understand its performance and volatility. You are going to use point estimators to provide this information.
You take a random sample of 30 daily closing stock prices for stock XYZ from last year. You find

and
 Mean closing price:
 The mean closing price of stock XYZ over the past month is estimated to be $151. This value is a point estimate of the population mean, μ, which represents the average closing price of the stock in the entire population of trading days. The sample mean,

is used as a point estimator because it provides a single, best guess of the population mean based on the sample data.
The point estimate of the mean closing price provides a concise summary of the stock’s average performance over the past year. It helps investors understand the typical price level of the stock.
Standard Deviation: The standard deviation of the closing prices is approximately $5.88. This value is a point estimate of the population standard deviation, σ, which measures the volatility of the stock’s closing prices in the entire population of trading days. The sample standard deviation, s, is used as a point estimator because it provides a single, best guess of the population standard deviation based on the sample data.
The point estimate of the standard deviation gives insight into the stock’s volatility. A higher standard deviation indicates greater variability in the stock prices, suggesting higher risk. Conversely, a lower standard deviation indicates more stable prices.
-
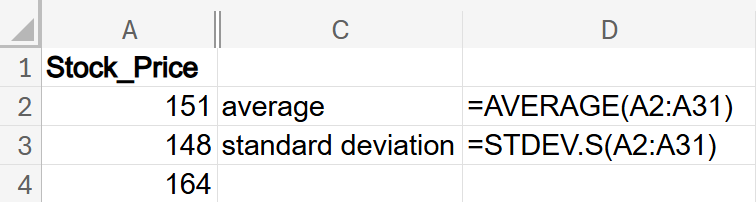
Using the
stock_prices_sample.xlsx Excel file, develop point estimators for the population mean and standard deviation closing stock price.
You can use the AVERAGE() and STDEV.S() Excel functions. Below are the formulas to create the point estimators in Excel.
Remember,
estimates μ; that is, the sample average,
, is the point estimator for the population mean, μ. By calculating the average of the stock prices in this sample using the AVERAGE() function in Excel, you are estimating what the average closing price would be if you had data for every possible closing stock price in the population. This point estimator is useful because it provides a single value that estimates the central tendency of the stock prices in the population.
Likewise,
s estimates σ; that is, the sample standard deviation,
s, is the point estimator for the population standard deviation, σ. By calculating the standard deviation of the stock prices in your sample using the STDEV.S() function in Excel, you are estimating what the standard deviation of the closing stock prices would be if you had data for every possible closing stock price in the population. This point estimator is useful because it provides a single value that summarizes the variability of the stock prices in the population.
1c. Point Estimators for Proportions
A point estimator for a population proportion uses the proportion from a sample to estimate the true proportion of the entire population. Let’s think about this concept in simple terms. A proportion is a part of a whole. For example, if you have a survey of 100 customers and 60 of them say they are satisfied with your product, the proportion of satisfied customers is 60 out of 100, or 60%. A point estimator is a single value that gives us an estimate of a population parameter. In this case, the population parameter is the true proportion of satisfied customers in the entire customer base.
To estimate the population proportion, denoted as p, you use the sample proportion, denoted as  . The sample proportion is calculated using the formula:

where
x is the number of favorable outcomes and n is the total number of observations in the sample.
Suppose you surveyed 200 customers and 150 of them said they were satisfied with your product. The sample proportion is found with the following calculation:

This means that 75% of the surveyed customers are satisfied. 75% is the point estimate of the true proportion of satisfied customers in the entire population,
p.
Understanding point estimators for proportions helps businesses make informed decisions. For example, if a high proportion of customers are satisfied, the business might continue with its current strategies. If the proportion is low, the business might look for ways to improve customer satisfaction. The point estimator for the proportion helps businesses make educated guesses about the larger population proportion based on sample data.
-
A proportion and a probability are closely related concepts, but they are not the same. Below are some key differences and how they relate to point estimation.
-
Proportion: A proportion is a measure that represents the fraction of a sample or population that has a particular characteristic. For example, if 150 out of 200 surveyed customers are satisfied, the proportion of satisfied customers is 75%. When you use the sample proportion, , to estimate the population proportion, p, you are using a point estimator.
-
Probability: Probability is a measure of the likelihood that a particular event will occur. For example, if you randomly select a customer from the surveyed group, the probability that the customer is satisfied is 75%, assuming the sample is representative of the population.
Let’s take a look at an example that distinguishes between the concepts of proportion and probability.
-
EXAMPLE
You are a data analyst at a healthcare clinic that is concerned about the high rate of patient no-shows for scheduled appointments. To address this issue, you collected data from a sample of 500 scheduled appointments over the past month.
Proportion:
After analyzing the data, you found that 75 out of the 500 scheduled appointments resulted in no-shows. The proportion of no-show appointments is:

This means that based on your sample, you estimate that 15% of all scheduled appointments at the clinic result in no-shows. This proportion is a point estimate of the population proportion, p.
Probability:
If you randomly select one appointment from the 500 appointments you sampled, the probability that this appointment will be a no-show is 15%. This probability assumes that your sample is representative of the entire population of scheduled appointments at the clinic.
Why This Matters:
Understanding the proportion of no-show appointments helps the clinic assess the overall impact of no-shows on its operations. A high proportion of no-shows can lead to inefficiencies, lost revenue, and longer wait times for other patients. By identifying the extent of no-shows, the clinic can implement strategies to reduce them, such as sending appointment reminders, offering flexible scheduling, or implementing a no-show policy.
On the other hand, knowing the probability helps in making predictions about individual appointments. For instance, if the clinic wants to predict the likelihood that a randomly chosen appointment will be a no-show, they can use the probability derived from the sample data.
Let’s look at an example of how a point estimate of a proportion can be used in a real-world business data analytics scenario.
-
EXAMPLE
You are a data analyst at a large corporation. The company is concerned about the amount of food waste generated in its corporate cafeteria. To address this, you collected data from a sample of 100 meals served in the last month in the cafeteria and noted whether each meal resulted in significant food waste.
The point estimate for the proportion of meals that result in significant food waste is 25%. This means that based on your sample, you estimate that 25% of all meals served in the corporate cafeteria result in significant food waste.
Understanding the proportion of food waste is crucial for the corporation. A high proportion of food waste indicates inefficiencies and potential cost savings opportunities. By identifying the extent of food waste, the company can implement strategies to reduce waste, such as better portion control, improved menu planning, or employee education programs.
-
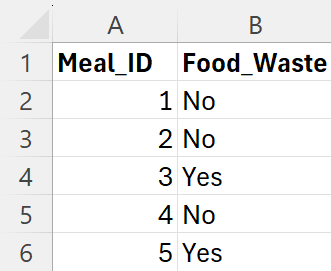
Using the data in the
food_waste.xlsx file, determine the point estimator for the proportion of food waste for the entire company. A snapshot of the data is provided below. There are two columns: a unique identifier for the meal,
Meal_ID, and an indicator variable,
Food_Waste, that specifies whether the meal had significant waste or not.
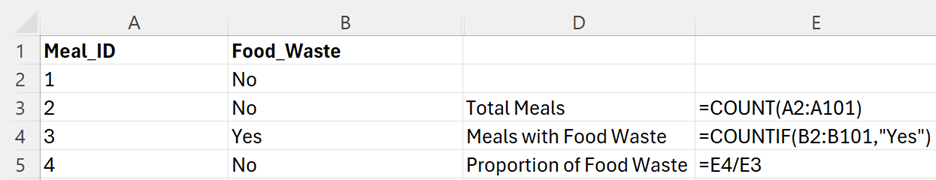
Perform the following.
1. In cell D3, enter
Total Meals. In cell E3, enter the following formula:
=COUNT(A2:A101)
The COUNT() function will count the total number of meals.
2. In cell D4, enter
Meals with Food Waste. In cell E4, enter the following formula:
=COUNTIF(B2:B101,”Yes”)
The COUNTIF() function will count the total number of meals with significant food waste.
3. In cell D5, enter
Proportion of Food Waste. In cell E5, enter the following formula:
=E4/E3
This is the point estimator for the proportion of food waste for the company,

The Excel worksheet with the formulas used is shown below.
-
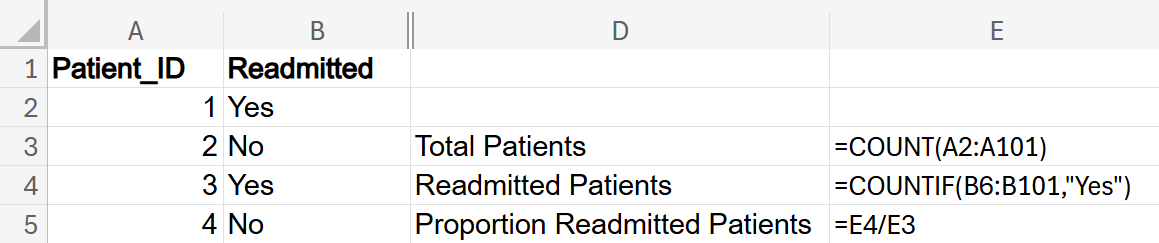
Using the
hospital_readmissions.xlsx Excel file, determine the point estimator for the proportion of all patients that were readmitted. This file contains a random sample of patients that have been readmitted to a hospital.
Solution:

The Excel worksheet with the formulas used is shown below.
1d. Proportions vs. Means
Ensuring you understand the difference between means and proportions is important in data analytics because it will ensure that you select the appropriate analytical technique going forward. Below is a table that summarizes the differences between proportions and means.
|
Aspect
|
Proportions
|
Means
|
|
Type of Data
|
Categorical (yes/no, success/failure, regions of the country)
|
Quantitative data (test scores, sales)
|
|
Purpose
|
Understand the relative frequency of a category
|
Measures the central tendency (average) of quantitative data
|
|
Examples
|
Defect rates: proportion of defective items in a batch
|
Sales figures: average sales per day
|
In business data analytics, point estimation helps in making informed decisions by providing single best estimates of population parameters based on sample data. For example, estimating the proportion of satisfied customers can guide improvements in customer service, while estimating average sales can help in forecasting and inventory management.
While point estimators are useful for providing a single value estimate, they do not convey the uncertainty or variability around the estimate. You are going to learn about other methods that can be used to understand the range within which the true population parameters are likely to fall.
In this lesson, you were introduced to the concept of point estimators. A point estimator is a statistic used to provide a single best guess or estimate of an unknown population parameter based on sample data. Point estimators allow companies to be efficient in their data decision making because they do not need to survey an entire population. Instead, they can rely on a well-chosen sample to provide accurate estimates of key metrics. This approach saves time and resources while still delivering valuable insights. This efficiency is crucial in fast-paced environments where timely decisions can lead to competitive advantages. Point estimators differ based on whether you are dealing with means or proportions. Point estimators for means typically use sample averages to estimate the population mean, while point estimators for proportions use sample proportions to estimate the population proportion.