Use Sophia to knock out your gen-ed requirements quickly and affordably. Learn more
×

Outliers and Influential Points

Author: Sophia

what's covered
This tutorial is going to teach you about outliers and influential points. Our discussion breaks down as follows:

Table of Contents

1. Outliers

You may recall the term "outliers" when talking about univariate data. However, in bivariate data, outliers are a little bit different.

An outlier is any point that deviates substantially from the overall form of the remainder of the data points.

EXAMPLE

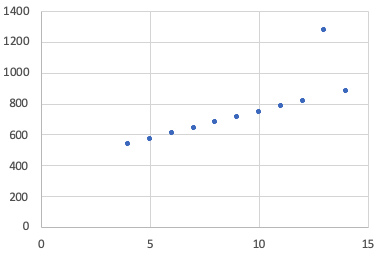
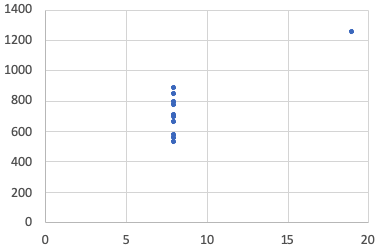
Let's take a look at these two data sets. One thing that you might realize is that the ones on the left seem quite random, whereas in the ones on the right, all the x's except one are 8, which might be a clue to something.
Table 1
Table 2
x y
x y
10 746
8 658
8 677
8 576
13 1274
8 771
9 711
8 884
11 781
8 847
14 884
8 704
6 608
8 525
4 539
19 1,250
12 815
8 556
7 642
8 791
5 573
8 689

However, if you calculate the mean and standard deviation, you will find that they have the same mean for the x's, the same mean for the y's, the same standard deviation for the x's, and the same standard deviation for the y's. Also, their correlations are the same, at 0.816 in a positive direction.

Based on that information, one would think that these two graphs will look fairly similar. Let's take a look:

Graph 1 Graph 2
A scatterplot with the x-axis ranging from 0 to 15 at intervals of 5 and the y-axis ranging from 0 to 1,400 at intervals of 200. The data points marked are (10, 746), (8, 677), (13, 1,274), (9, 711), (11, 781), (14, 884), (6, 608), (4, 539), (12, 815), (7, 642), and (5, 573). A scatterplot with the x-axis ranging from 0 to 15 at intervals of 5 and the y-axis ranging from 0 to 1,400 at intervals of 200. The data points marked are (8, 658), (8, 576), (8, 771), (8, 884), (8, 847), (8, 704), (8, 525), (19, 1,250), (8, 556), (8, 791), and (8, 689).

Both graphs have an outlier that does not follow the overall trend of the graph. Depending on the pattern, the outlier could be an extreme x-value, an extreme y-value, extreme for both the x- and y-values, or neither.

Types of Outliers Example
Extreme x-values A scatterplot with the x-axis ranging from 0 to 2,000 and the y-axis ranging from 0 to 400 at intervals of 100. Most data points form an upward trend, clustered between approximately 10 and 85 on the x-axis and 60 and 300 on the y-axis. One additional point at approximately (1,600, 90) appears far to the right of the main cluster and is labeled with an arrow and the text 'Outlier'.

This is an outlier in the x-direction because it's so much further to the right of the other pack of points but not in the y-direction. If you look horizontally, it's sort of in the middle lower part of the y-direction. It's an outlier in the x-direction but not the y-direction.
Extreme y-values A scatterplot with the x-axis ranging from 0 to 140 at intervals of 20 and the y-axis ranging from 0 to 500 at intervals of 100. There is a loose upward pattern of points, which spread between approximately 20 and 110 on the x-axis and 90 and 260 on the y-axis. One data point at approximately (70, 500) lies much higher than the rest and is marked with an arrow labeled ‘Outlier’.

This is an outlier in the y-direction because it's so much higher than the other y-direction, but not the x-direction.
Extreme x- and y-values A scatterplot with the horizontal axis ranging from 0 to 2,000 and the vertical axis ranging from 0 to 500. Most points are clustered near 80 on the horizontal axis, with values around 170, 190, 200, 240, 250, 280, 300, and 320 on the vertical axis. One additional point at approximately (1,800, 450) is far to the right, higher than the rest, and labeled as an outlier.

This is an outlier in both the x- and y- direction because it's so much farther to the right and also higher than the rest of the points.
Neither extreme x- or y-values A scatterplot with the horizontal axis ranging from 0 to 1,600 and the vertical axis ranging from 0 to 400 at intervals of 100. The points form an inverted U shape, with values increasing from left to right from about (35, 170) to peak at (90, 460) and then decreasing to reach (145, 120). One point near (90, 300) sits inside the curve and is labeled with an arrow as an ‘Outlier’.

Even though it is not extreme in either the x- or y- direction, it doesn't fit the overall trend established by the rest of the data.

term to know
Outlier
Point that deviates substantially from the overall form of the remainder of the data points.


2. Influential Points

Influential points are points that, if removed, significantly change a statistical measure. Usually, the measure that we're talking about changing is correlation, but it could also affect other measurements such as the mean of x or y and the standard deviation of x or y.

Some outliers are influential, and some are not.

EXAMPLE

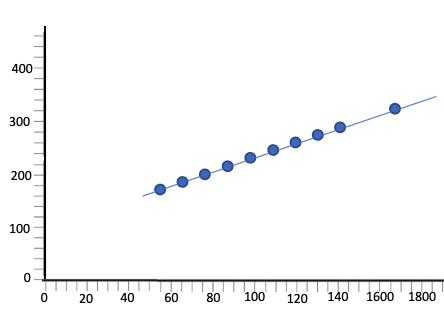
When the scatterplot on the left includes the outlier, the correlation coefficient is 0.816. However, when we remove the outlier, the correlation coefficient changes to 1. Since this dramatically changes the correlation, this outlier would be considered an influential point.
A scatterplot with the horizontal axis ranging from 0 to 1,800 and the vertical axis ranging from 0 to 400 at intervals of 100. Most data points follow a perfect linear pattern from about (55, 170) to (140, 290), with one additional point near (1,700, 320). Another point near (145, 450) lies above the pattern and is labeled ‘Influential Point’. A scatterplot with the horizontal axis ranging from 0 to 1,800 at intervals of 20 and the vertical axis ranging from 0 to 400 at intervals of 100. Most data points follow a perfect line pattern from about (55, 170) to (140, 290), with one additional point near (1,700, 320). A straight line rises upward, passing through the data points.
With outlier:
r = 0.816
Without outlier:
r = 1

EXAMPLE

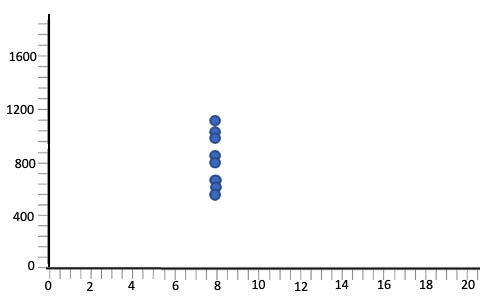
When the scatterplot below includes the outlier, the mean of x is 9, the standard deviation of x is 3.3, and the correlation is 0.816. However, when we remove the outlier, the mean becomes 8 because now all the x-values are 8, the standard deviation is 0 because they never deviate from 8, and the correlation is 0. Therefore, it changes all of these measures very substantially by being there. That outlier is certainly influential.
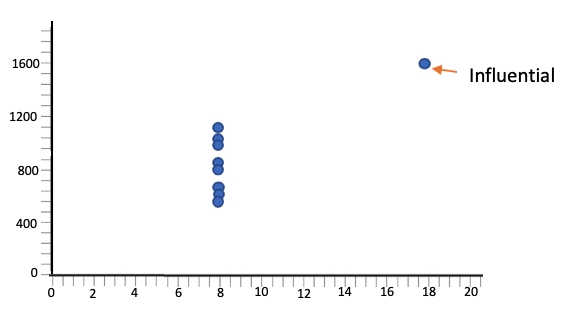
A scatterplot with the horizontal axis ranging from 0 to 20 at intervals of 2 and the vertical axis ranging from 0 to 1,600 at intervals of 400. The data points are clustered vertically around x equals 8, with y-values ranging roughly from 500 to 1,100. A point near (18, 1,600) lies above the pattern to the right and is marked with an arrow labeled ‘Influential’. A scatterplot with the horizontal axis ranging from 0 to 20 at intervals of 2 and the vertical axis ranging from 0 to 1,600 at intervals of 400. The data points are clustered vertically around x equals 8, with y-values ranging roughly from 500 to 1,100.
With outlier:
mean = 9
standard deviation = 3.3
r = 0.816
Without outlier:
mean = 8
standard deviation = 0
r = 0

EXAMPLE

The outlier in the scatterplot below is not going to have a great effect on the correlation or the least squares regression line that these data sets create. In this case, a line is an inappropriate model, but if you did make a line, having this point versus removing this point wouldn't affect that line or the correlation very much.
A scatterplot with the horizontal axis ranging from 0 to 1,600 at intervals of 20 and the vertical axis ranging from 0 to 400 at intervals of 100. Most points follow an upward curve pattern and are approximately at (5, 30), (15, 35), (40, 50), (50, 55), (65, 75), (80, 120), (95, 175), (105, 220), (110, 270), and (120, 380). One additional data point at approximately (35, 230) is marked with an arrow labeled ‘Not Influential’.

term to know
Influential Point
An observation that, if removed, significantly changes a statistical measure.

summary
Important points on a scatterplot are influential points and outliers. Influential points substantially change at least one statistical measure. Outliers simply are points that deviate from the overall form of the rest of the points. They may be outliers in the x- or y-direction but don't have to be, according to this definition. Be aware that different people use different definitions of outliers for scatterplots, so there's not one hard-and-fast definition.

Good luck!

Source: THIS TUTORIAL WAS AUTHORED BY SOPHIA LEARNING. PLEASE SEE OUR TERMS OF USE.

Terms to Know
Influential Point

An observation that, if removed, significantly changes a statistical measure.

Outlier

Point that deviates substantially from the overall form of the remainder of the data points.