Table of Contents |
Hypothesis testing is a method used to make decisions or draw conclusions about a population based on sample data. In the context of hypothesis testing for proportions, the focus is on the percentage of a certain characteristic within a group. For instance, if a company wants to determine if more than 50% of its customers are satisfied with their service, hypothesis testing can be employed. This process involves setting up a hypothesis, collecting data, and using statistical methods to analyze whether the data supports the hypothesis.
In a similar fashion as in the last tutorial, the steps to perform a hypothesis test are as follows:
Just like with population means, there are three types of hypothesis tests for population proportions, based on the direction of the test. A description of each type of test is provided below.
1. Two-Tailed Test:
 either higher or lower.
  (the population proportion is equal to a hypothesized population proportion)
  (the population proportion is not equal to a hypothesized population proportion)
 EXAMPLE
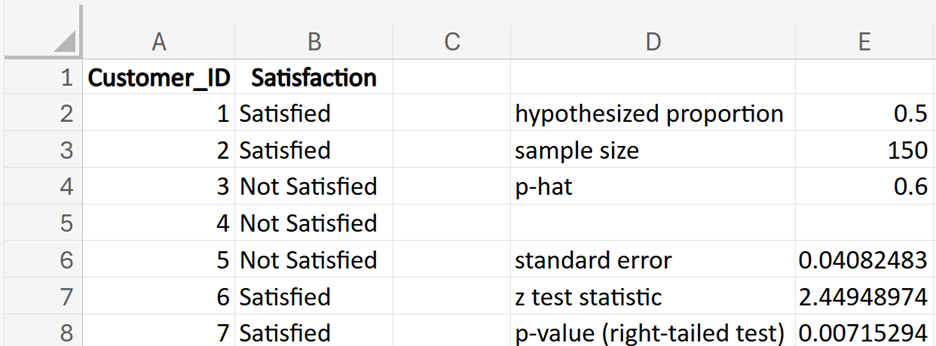
A company wants to test if the proportion of satisfied customers is different from 50%.2. Right-Sided (One-Tailed) Test:
(the population proportion is equal to a hypothesized population proportion) (the population proportion is greater than a hypothesized population proportion)
EXAMPLE
A company wants to test if more than 60% of its customers are satisfied with their service.3. Left-Sided (One-Tailed) Test:
(the population proportion is equal to a hypothesized population proportion) (the population proportion is less than a hypothesized population proportion)
EXAMPLE
A company wants to test if less than 40% of its customers are dissatisfied with their service.In the upcoming sections, you will explore the different types of hypothesis tests used in hypothesis tests for proportions: two-tailed, right-tailed, and left-tailed tests. You will discover the purpose of each test, how to perform the test, and how to interpret the results. Whether you are analyzing financial metrics or customer satisfaction surveys, mastering these tests will enhance your analytical skills and decision-making capabilities.
Let us walk through a practical example of performing a two-tailed hypothesis test for a proportion.
EXAMPLE
SavvyShoppers, a retail company, has recently launched a new customer loyalty program aimed at increasing customer retention and sales. The program offers various incentives, such as discounts, exclusive offers, and reward points for frequent purchases. The company wants to evaluate whether the new loyalty program has significantly changed the customer conversion rate compared to the historical conversion rate. (conversion rate is equal to the historical conversion rate of
  the hypothesized proportion,
  )
) (conversion rate is not equal to the historical conversion rate of
  )
) (the sample proportion of customers who converted (made a purchase) after the loyalty program was implemented)

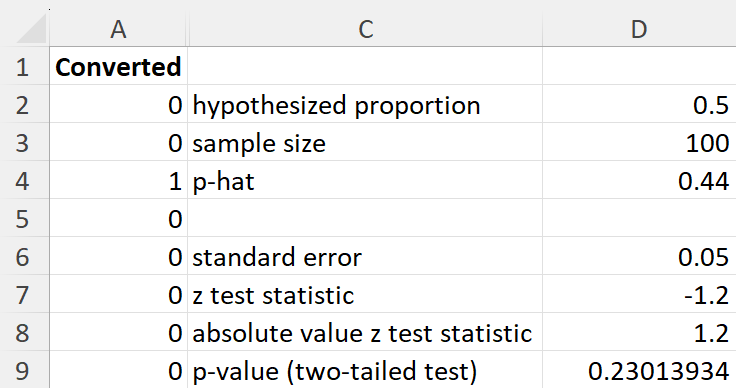
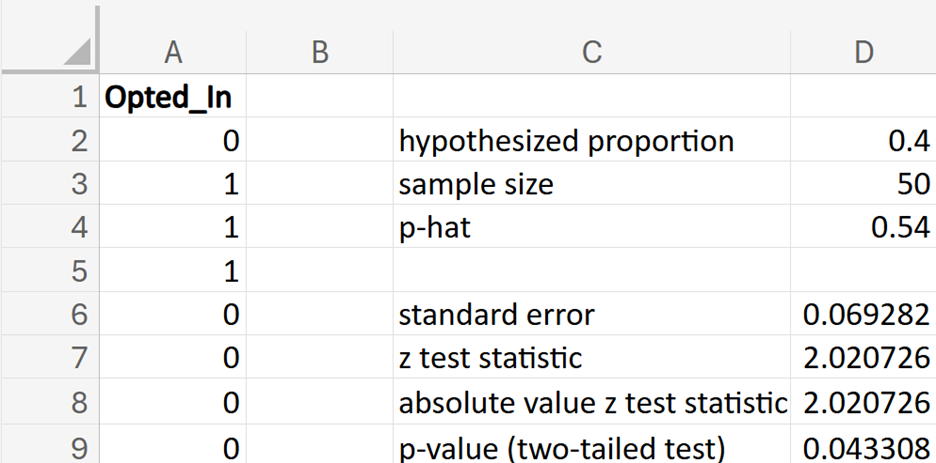
 where is the hypothesized proportion in the null hypothesis, which is 0.50, and
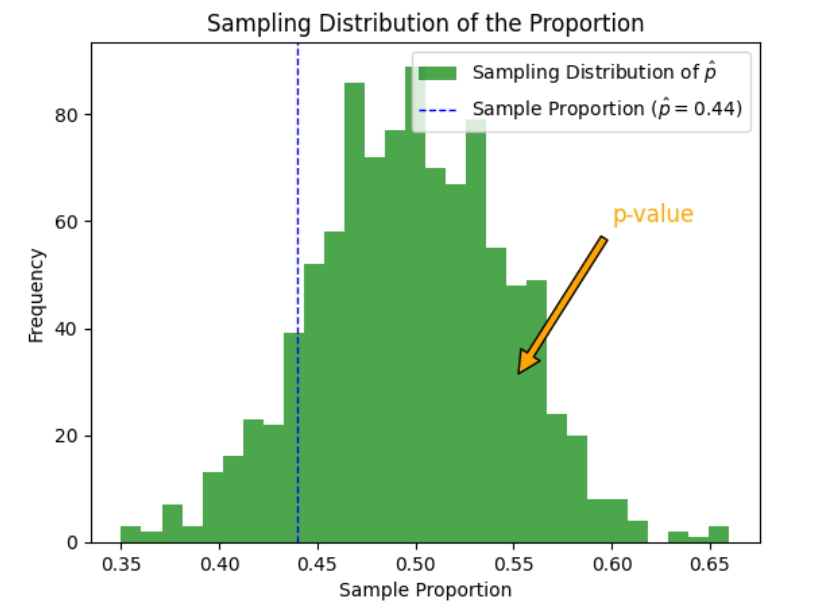
  is the sample proportion, which is 0.44 in this example. The test statistic tells you how many standard deviations the sample proportion is from the hypothesized proportion of 0.50.

 showing how the proportions of buyers from numerous samples of 100 people each form a distribution. The distribution is centered around the hypothesized population proportion,
  and has a standard error calculated using:

 is from the hypothesized population proportion,
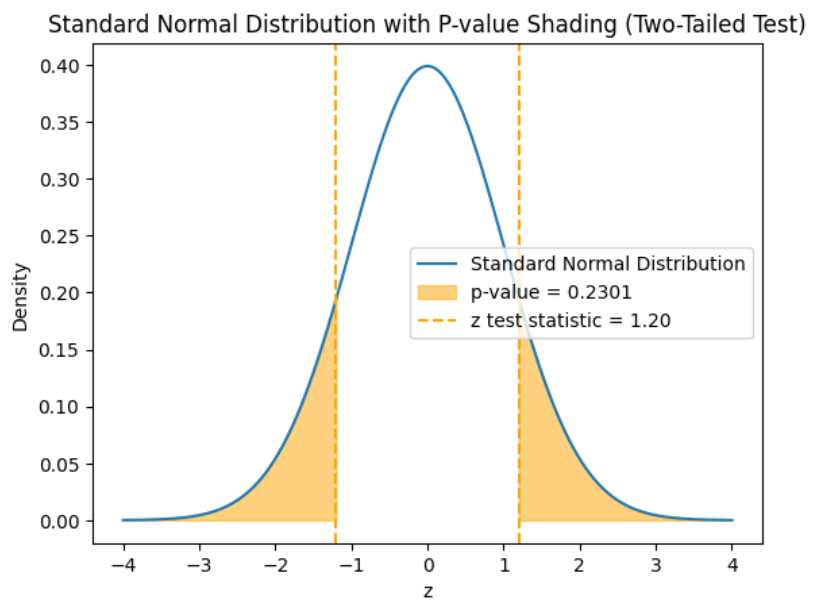
  You use the standard normal distribution to find the p-value for the hypothesis test. The graph below shows the standard normal distribution for a two-tailed hypothesis test. The orange dashed lines at
  and
and  show the observed test statistics. The orange shaded areas represent the p-value, indicating the probability of observing test statistics as extreme as
  or more extreme, under the null hypothesis.
 for the high end.
  for the low end.
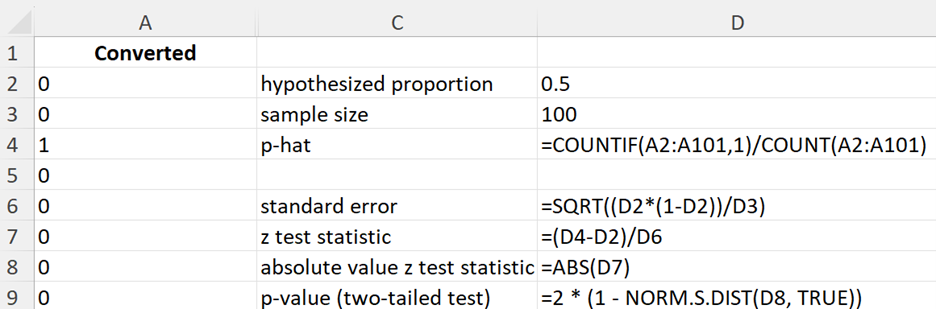
 (level of significance), you fail to reject the null hypothesis.


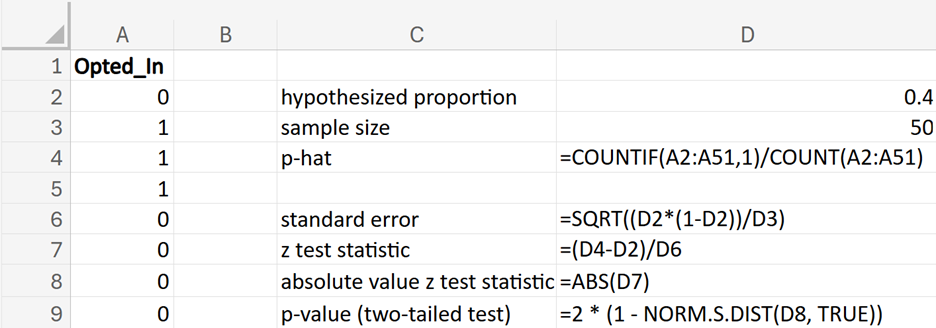
This table provides a guide on which Excel NORM.S.DIST() function to use for calculating p-values in different types of z-tests. It includes functions for two-tailed, right-tailed, and left-tailed tests, specifying the appropriate function and a brief description of each. The value of z in the table represents the test statistic.
| Type of Test | Excel Function | Description |
|---|---|---|
| Two-Tailed Test | =2 * (1 - NORM.S.DIST(ABS(z), TRUE)) | This function calculates the p-value for a two-tailed test by doubling the area in one tail. ABS(z) ensures the z-test statistics is positive, and NORM.S.DIST(z, TRUE) gives the cumulative probability up to the z-test statistic. |
| Right-Tailed Test | =1 - NORM.S.DIST(z, TRUE) | This function calculates the area to the right of the z-test statistic for a right-tailed test. NORM.S.DIST(z, TRUE) gives the cumulative probability up to the z-test statistic, and subtracting from 1 gives the right tail area. |
| Left-Tailed Test | =NORM.S.DIST(z, TRUE) | This function calculates the cumulative probability up to the z-test statistic for a one-tailed test. If the test is left-tailed, use the z-test statistic directly. No absolute value is needed. |
Let’s walk through a practical example of a right-tailed hypothesis test for a proportion.
EXAMPLE
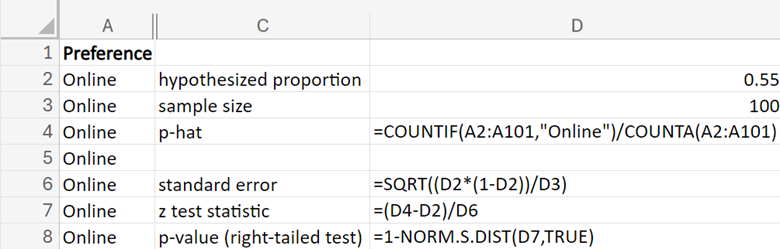
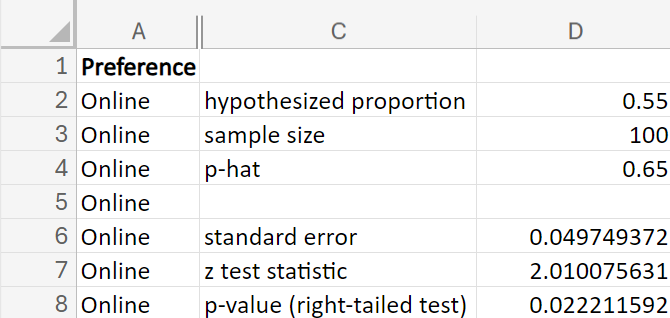
A university wants to determine if the new online class format has significantly increased student preference for online classes, compared to a historical preference rate of 55%. After implementing the new online class format, the university conducted a survey of 100 students to see if the preference rate has increased. (student online preference rate for online classes is equal to the historical preference rate of
  the hypothesized proportion, )
 (student online preference rate is not equal to the historical online preference rate of
  )
) (the sample proportion of students who prefer the online class format)
where is the hypothesized proportion in the null hypothesis, which is 0.55, and is the sample proportion, which is 0.65 in this example. The test statistic tells you how many standard deviations the sample proportion is from the hypothesized proportion of 0.55.
(the sample proportion of students who prefer the online class format)
where is the hypothesized proportion in the null hypothesis, which is 0.55, and is the sample proportion, which is 0.65 in this example. The test statistic tells you how many standard deviations the sample proportion is from the hypothesized proportion of 0.55.

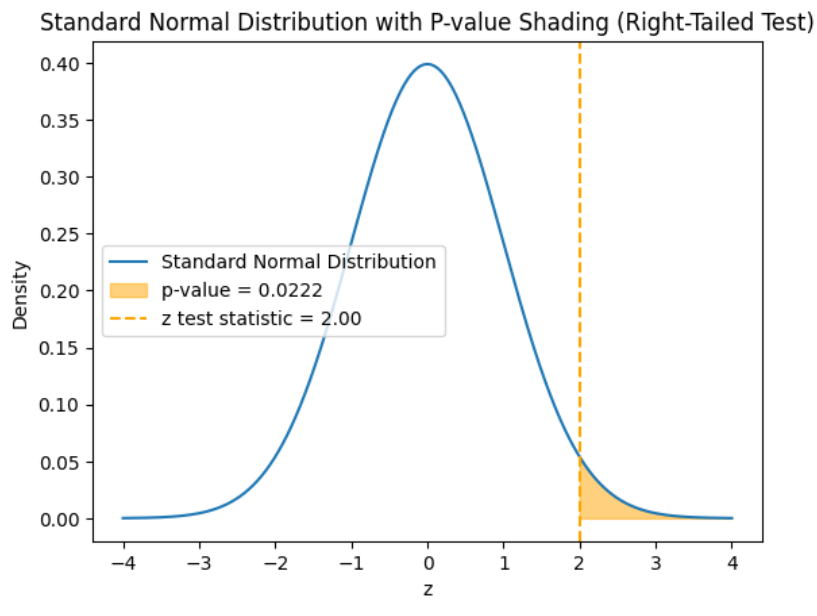
 shows the observed test statistic. The orange shaded area represents the p-value, indicating the probability of observing the test statistic, or something more extreme, if the null hypothesis is true.
 (level of significance), you reject the null hypothesis.
Let’s walk through a practical example of a left-tailed hypothesis test for a proportion.
EXAMPLE
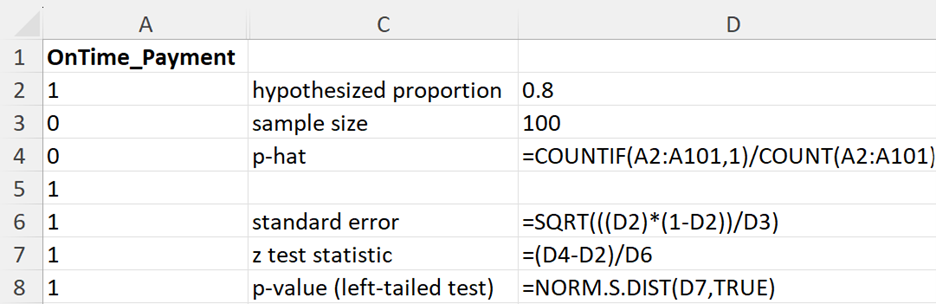
You are working as a data analyst for BrightPay Credit, a credit card company. Historically, 80% of customers pay their credit card bills on time. Recently, there have been concerns that the proportion of on-time payments might have decreased. To investigate this claim, you take a sample of 100 customers and record whether each customer paid their bill on time. You need to conduct a left-tailed hypothesis test to determine if the company’s concern is valid. (proportion of on-time payments is equal to the historical rate of
  the hypothesized proportion, )
 (proportion of on-time payments is less than the historical rate of
  )
) (the sample proportion of customers who have paid their bill on time)
where is the hypothesized proportion in the null hypothesis, which is 0.80, and is the sample proportion, which is 0.70 in this example. The test statistic tells you how many standard deviations the sample proportion is from the hypothesized proportion of 0.80.
(the sample proportion of customers who have paid their bill on time)
where is the hypothesized proportion in the null hypothesis, which is 0.80, and is the sample proportion, which is 0.70 in this example. The test statistic tells you how many standard deviations the sample proportion is from the hypothesized proportion of 0.80.

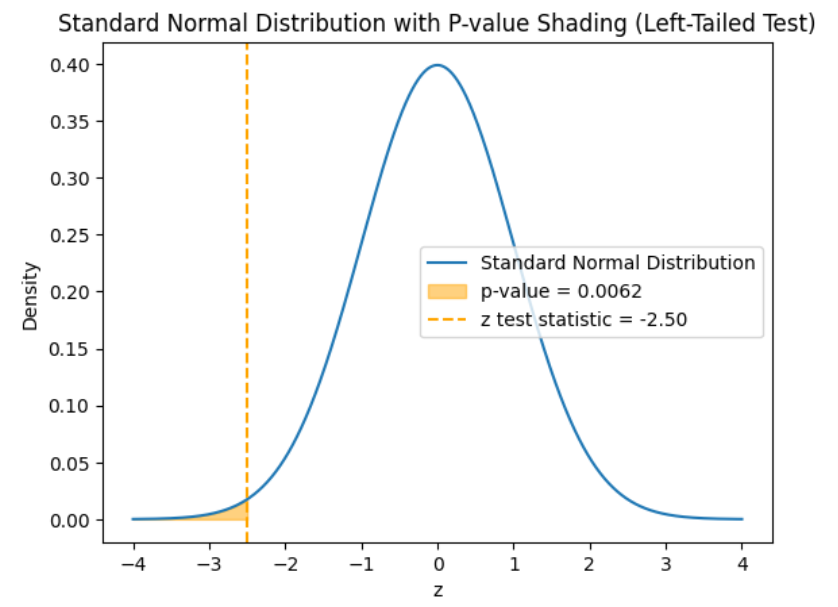
 shows the observed test statistic. The orange shaded area represents the p-value, indicating the probability of observing the test statistic, or something more extreme, if the null hypothesis is true.
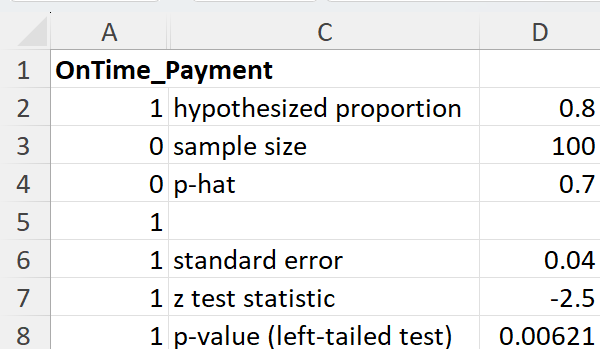 (level of significance), you reject the null hypothesis.

Source: THIS TUTORIAL WAS AUTHORED BY SOPHIA LEARNING. PLEASE SEE OUR TERMS OF USE.