Table of Contents |
The most commonly used network troubleshooting tools include many accessed via a command line interface, or shell, in a Windows, Unix, or Linux network operating system. The sections that follow will introduce you to some of these tools.
The ping utility is the most basic TCP/IP utility, and it is included with the TCP/IP stacks for most platforms, including Windows, Linux, Unix, and Cisco IOS operating systems. In most cases, ping is a command-line utility, although there are GUI implementations available.
EXAMPLE
Here is the syntax. Either command can be used:If you ping any station that has an IP address, the Internet Control Message Protocol (ICMP), a network-layer protocol used by network devices to diagnose network communication issues, that is part of that particular host’s TCP/IP stack, will respond to the request.
EXAMPLE
The ICMP test and response looks something like this:ping 204.153.163.2Pinging 204.153.163.2 with 32 bytes of data:Reply from 204.153.163.2: bytes=32 time<10ms TTL=128Reply from 204.153.163.2: bytes=32 time=1ms TTL=128Reply from 204.153.163.2: bytes=32 time<10ms TTL=128Reply from 204.153.163.2: bytes=32 time<10ms TTL=128Because you have received a reply from the destination station (204.153.163.2, in this case), we know that we can reach the host and that it is responding to basic IP requests.
EXAMPLE
Do not forget that you can use name resolution and ping to a name, such asping www.sophia.org
As long as that name can be resolved, you will receive a reply.
Most versions of ping work the same way, but there are some switches you can use to specify certain information, like the number of packets to send, how big a packet to send, and so on.
Here is a table showing what each ping option does:
| Option | Description |
|---|---|
| -t | Pings the specified host until stopped. To see statistics and continue, press Ctrl+Break; to stop, press Ctrl+C. |
| -a | Resolves addresses to hostnames |
| -n count | Specifies the number of echo requests to send |
| -l size | Sends the buffer size |
| -f | Sets the Don’t Fragment flag in the packet (IPv4 only) |
| -i TTL | Specifies the Time to Live of the packet |
| -v TOS | Specifies the type of service (IPv4 only) |
| -r count | Records the route for count hops (IPv4 only) |
| -s count | Specifies the timestamp for count hops (IPv4 only) |
| -j host-list | Uses a loose source route along the host list (IPv4 only) |
| -k host-list | Uses a strict source route along the host list (IPv4 only) |
| -w timeout | Specifies the time-out to wait for each reply in milliseconds |
| -R | Uses the routing header to test the reverse route also (IPv6 only) |
| -S srcaddr | Specifies the source address to use |
| -4 | Forces using IPv4 |
| -6 | Forces using IPv6 |
The TCP/IP traceroute (tracert with Windows) command-line utility enables us to see the IP addresses of all router interfaces a TCP/IP packet passes through on the way to its destination.
Traceroute displays the path a packet takes to get to a remote device by using something we call IP packet Time to Live (TTL) time-outs and Internet Control Message Protocol (ICMP) error messages. And it is also a handy tool for troubleshooting an internetwork because we can use it to figure out which router along a path through that internetwork happens to be causing a network failure when a certain destination machine or network is, or suddenly becomes, unreachable.
To use tracert, at a Windows command prompt, type tracert, a space, and the Domain Name Service (DNS) name or IP address of the host machine to which you want to find the route. The tracert utility will respond with a list of all the DNS names and IP addresses of the routers that the packet is passing through on its way. Plus, tracert uses TTL to indicate the time it takes for each attempt.
EXAMPLE
Following is the tracert output from a workstation in Boulder, Colorado, to the Lammle.com server in Dallas, Texas:C:\Users\tlammle>tracert www.lammle.comTracing route to lamme.com [206.123.114.186
over a maxim of 30 hops:1 1 ms <1ms <1ms dslmodem.domain.actdsltmp [192.168.0.1]2 53 ms 52ms 52ms hlrn-dsl-gw36-228.hlrn.qwest.net [207.225.112.228]3 52 ms 53ms 52ms hlrn-agwl.inet.qwest.net [71.217.189.25]4 75 ms 75ms 74ms dal-core-01.inet.qwest.net [67.14.2.53]5 76 ms 76ms 76ms dap-brdr-01.inet.qwest.net [205.171.225.49]6 76 ms 76ms 76ms 205.171.1.1107 75 ms 76ms 106ms xe-0-0-0.er2.dfw2.us.above.net [64.125.26.206]8 76 ms 76ms 76ms 209.249.122.74.available.above.net [209.249.122.74]9 76 ms 76ms 76ms 65.99.248.25010 76 ms 76ms 76ms pageuppro.pageuppro.com [206.123.114.186]Trace complete
Notice that the packet bounces through several routers before arriving at its destination. This utility is useful if you are having problems reaching a web server on the internet and you want to know if a wide area network (WAN) link is down or if the server is just not responding. What this means to you is that, basically, wherever the trace stops is a great place to start troubleshooting. Notice in the output the ms (milliseconds), which is a measure of latency (delay) of each hop. Traceroute is a great troubleshooting tool you can use to find out where your network bottlenecks are.
The console application programs ipconfig and ifconfig display a computer’s TCP/IP configuration. You can also use these tools to refresh Dynamic Host Configuration Protocol (DHCP) and Domain Name System (DNS) settings. Use the ipconfig utility on Windows and Mac machines and the ifconfig utility for Linux and Unix machines. There is also an alternative to “ifconfig” in recent Linux distributions called “ip” which provides more detailed information than ifconfig.
EXAMPLE
The ipconfig display, as shown below, provides information crucial to troubleshooting a machine’s network configuration:C:\Users\tlammle>ipconfigWindows IP ConfigurationEthernet adapter Local Area Connection:Connection-specific DNS Suffice. . : domain.actdsltmpLink-local IPv6 Address. . . . . . : fe80::2836:c43e:274b:f08c%11IPv4 Address . . . . . . . . . . . : 192.168.0.6Subnet Mask. . . . . . . . . . . . : 255.255.255.0Default Gateway . . . . . . . . . . . : fe80::21b:63ff:fef3:3694%1010.0.1.1Tunnel adapter Local Area Connection* 6:Media State . . . . . . . . . . : Media DisconnectedConnection-specific DNS Suffix . :Tunnel Adapter Local area Connection* 7:Media State. . . . . . . . . . . : Media DisconnectedConnection-Specific DNS Suffix . : [output cut for brevity]When configuring DNS, it’s a very good thing to be able to test what IP address DNS is returning to ensure that it’s working properly. The nslookup utility allows you to query a name server and quickly find out which name resolves to which IP address.
The primary job of nslookup is to tell you the many different features of a particular domain name, the names of the servers that serve it, and how they’re configured. To get that, just type nslookup and a domain name at the > prompt, and the nslookup utility will then return this information:
> nslookup www.sophia.org
Server: aem6.capella.edu
Address: 74.81.185.84
Aliases: www.sophia.org
Using netstat is a great way to check out the inbound and outbound TCP/IP connections on your machine. You can also use it to view packet statistics like how many packets have been sent and received, the number of errors, and so on.
EXAMPLE
This utility is a great tool to use to determine the status of outbound network connections as shown below:C:\Users\tlammle>netstatActive ConnectionsProto Local Address Foreign Address StateTCP 10.10010.54.49545 gnt-exchange:epmap TIME_WAITTCP 10.10010.54.49548 gnt-exchange:epmap TIME_WAITTCP 10.10010.54.49551 gnt-exchange:1151 ESTABLISHEDTCP 10.10010.54.49557 gnt-exchange:1026 ESTABLISHEDTCP 10.10010.54.49590 gmt-exchange:epmap TIME_WAITTCP 127.0.0.1:49174 globalnet_todd:62514 ESTABLISHEDTCP 127.0.0.1.62514 globalnet_todd:49174 ESTABLISHEDTCP 192.168.0.6:2492 blugro2relay:2492 ESTABLISHEDTCP 192.168.0.6:2492 blugro2relay:2492 ESTABLISHEDTCP 192.168.0.6:49170 64.12.25.26.5190 ESTABLISHEDTCP 192.168.0.6:49171 OAM-D85C:5198 ESTABLISHEDTCP 192.168.0.6:49473 205.128.92.124:http CLOSED_WAITTCP 192.168.0.6:49625 64-190-251-21:ftp ESTABLISHEDTCP 192.168.0.6:49628 210-11:http ESTABLISHEDTCP 192.168.0.6:49629 varpl:http ESTABLISHEDTCP 192.168.0.6:49630 varpl:http ESTABLISHEDTCP 192.168.0.6:49631 varpl:http ESTABLISHEDTCP 192.168.0.6:49632 varpl:http ESTABLISHEDTCP 192.168.0.6:49635 199.93.62.125:http ESTABLISHEDTCP 192.168.0.6:49636 ml:http ESTABLISHEDTCP 192.168.0.6:49638 spe:http ESTABLISHEDYou can see that this machine is connected to an Exchange server and an FTP server and that we have some HTTP sessions open; by the way, all of them use TCP at the Layer 4 (Transport).
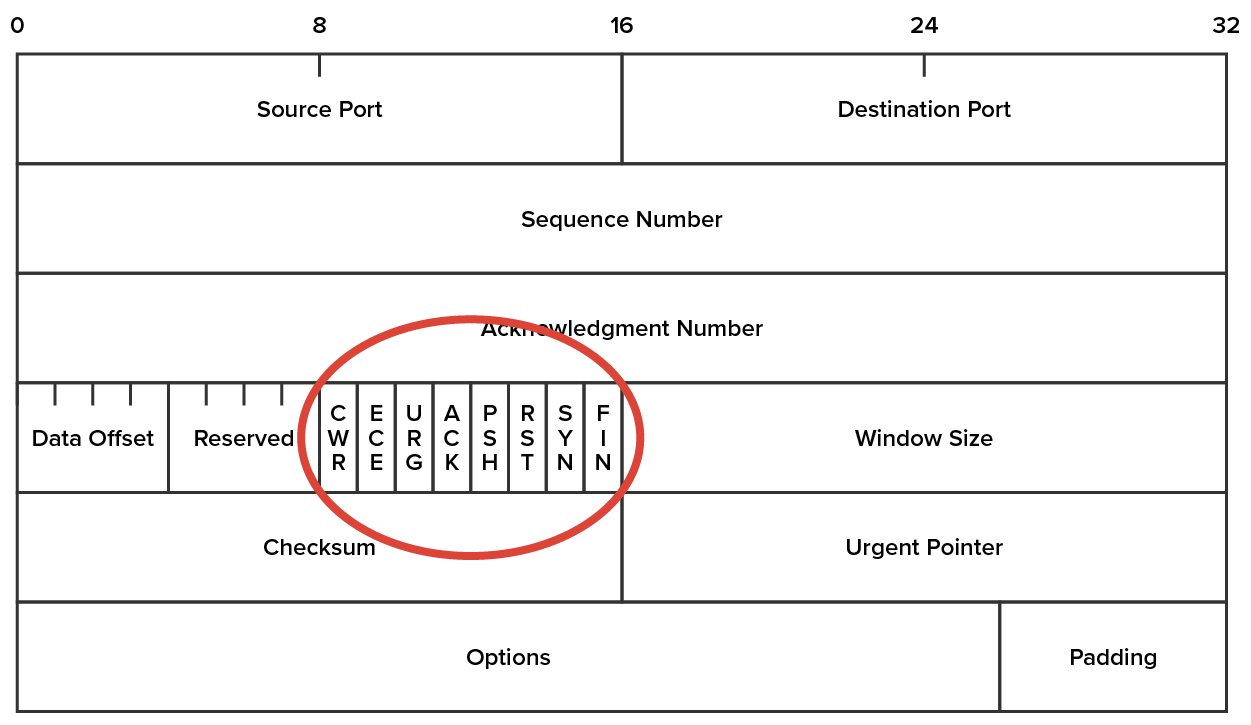
Nmap is a popular tool for port scanning. After performing scans with certain flags set in the scan packets, security analysts (and hackers) can make certain assumptions based on the responses received. These flags are used to control the TCP connection process and so are present only in TCP packets. The diagram below shows a TCP header with the important flags circled. Normally, flags are “turned on” because of the normal TCP process, but hackers can craft packets to check the flags they want to check.
ARP is a protocol included in the TCP/IP suite that is used to resolve, or match up, an IP address to the MAC address of a destination device. When a TCP/IP device needs to forward a packet to a device on the local subnet, it first looks in its own table, called an ARP cache for an association between the known IP address of the destination device on the local subnet and the same device’s MAC address.
EXAMPLE
To view this, from a Windows DOS prompt, use the arp command like this:C:\Uses\tlammle>arp
Source: This content and supplemental material has been adapted from CompTIA Network+ Study Guide: Exam N10-007, 4th Edition. Source Lammle: CompTIA Network+ Study Guide: Exam N10-007, 4th Edition - Instructor Companion Site (wiley.com)