Use Sophia to knock out your gen-ed requirements quickly and affordably. Learn more
×

Network Protocols and Troubleshooting Basics

Author: Sophia

what's covered
In this lesson, you will see how the theories and protocols discussed so far apply in practice, as modern networks rely on diagnostic tools to verify whether devices are reachable and functioning as expected. This tutorial explores how common tools are used to observe and troubleshoot network traffic in real time.

Specifically, this lesson will cover the following:

Table of Contents

1. Introduction to DynamiteLab

As you move through this course, you’ll go from learning about networking concepts to applying them in real-world ways. One of the tools we’ll use is DynamiteLab, a free online platform for analyzing network traffic.

You can think of it as a powerful microscope for network communications. With it, you can open packet capture (pcap) files, which record the collected network traffic, including individual conversations between devices. Instead of only reading about protocols such as TCP or ICMP, you’ll actually see them in action.

In the workplace, analyzing packet captures is an important skill for troubleshooting problems, spotting security threats, and understanding how applications behave on a network. In this course, DynamiteLab will help you gain hands-on experience by examining real network traffic in a safe environment, build analytical skills by learning how to follow data flows and interpret raw traffic, and visualize abstract ideas by using graphs and timelines to see processes such as a TCP handshake or a DNS query.

It’s easy to get started.

Step 1: Create an account

Go to the DynamiteLab website and sign up for a free account. You can register with your email and a password, or use a Microsoft or Google account to connect directly.

Step 2: Explore the dashboard

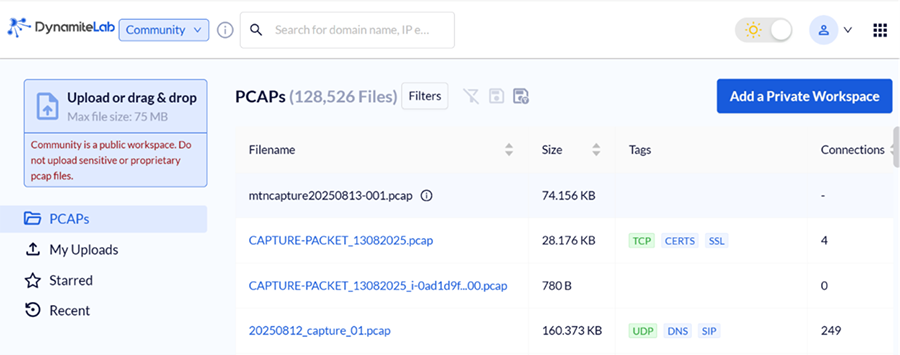
When you log in, you’ll see your main dashboard (screenshot provided). This is where you organize and access packet capture files in the following links:

  • Upload: Allows you to add new pcap files
  • PCAPs: Access all publicly available files on DynamiteLab
  • My Uploads: See the files you’ve uploaded
  • Starred: Mark favorite files for quick access
  • Recent: Return to the most recent files you’ve analyzed
ITN09

Step 3: Learn the analysis tools

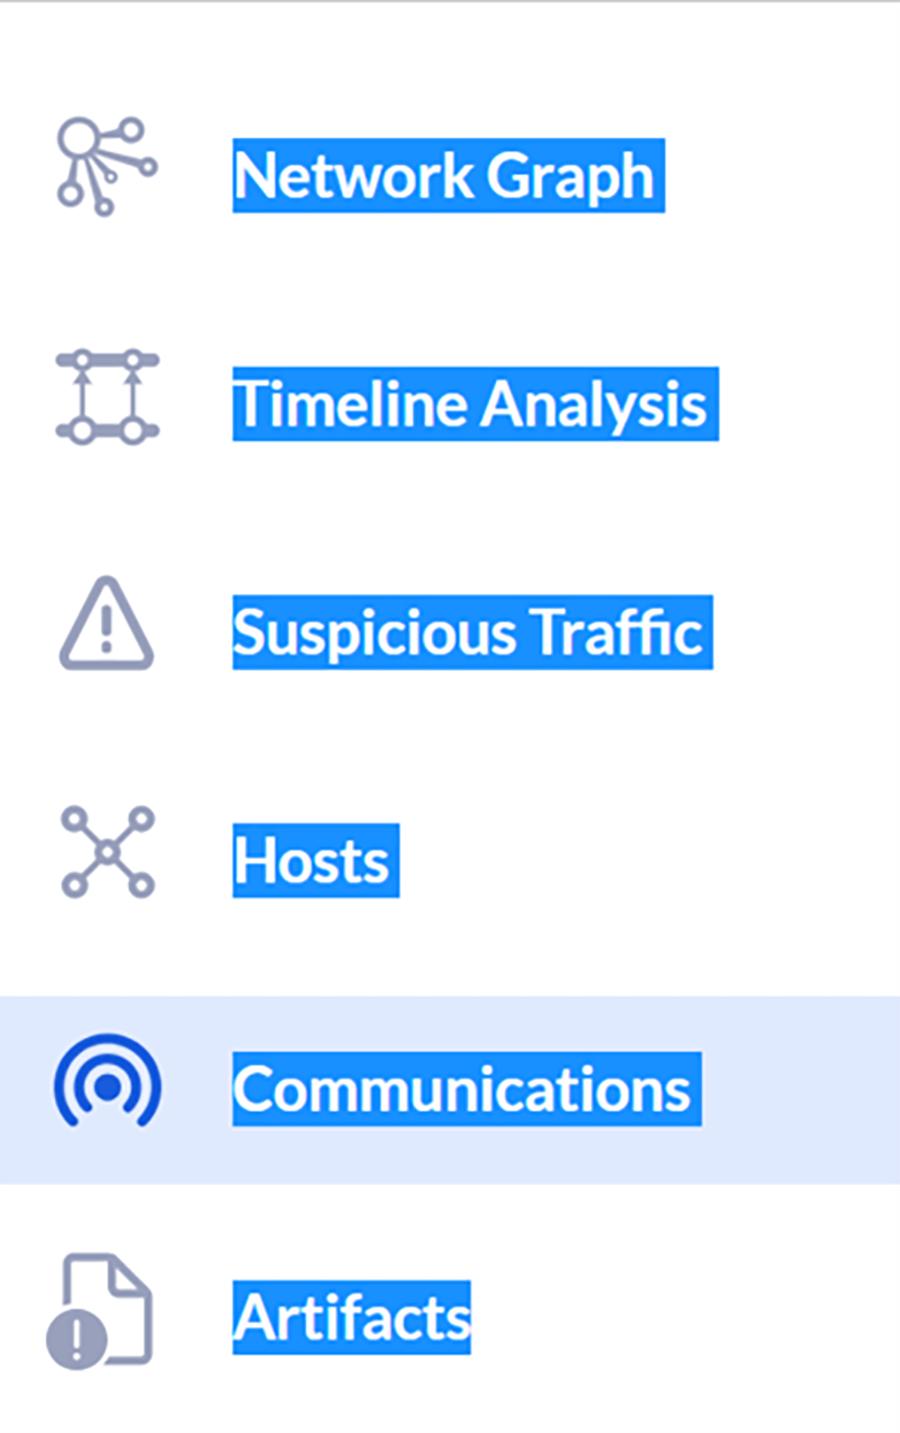
When you select a pcap file, six analysis options appear on the left (screenshot provided). Each tool highlights a different view of the traffic.

  • Network Graph: Visualizes communications between IP addresses
  • Timeline Analysis: Shows how traffic occurred over time
  • Suspicious Traffic: Highlights risks and threats in the capture
  • Hosts: Displays communications by individual devices
  • Communication: Summarizes protocol interactions
  • Artifacts: Groups and visualizes observed file transfers
ITN10

Step 4: Upload a packet capture file

For most assignments, you’ll receive a pcap file from the course materials. Follow these steps to upload:

  1. Download the provided file (e.g., EXAMPLE.pcap).
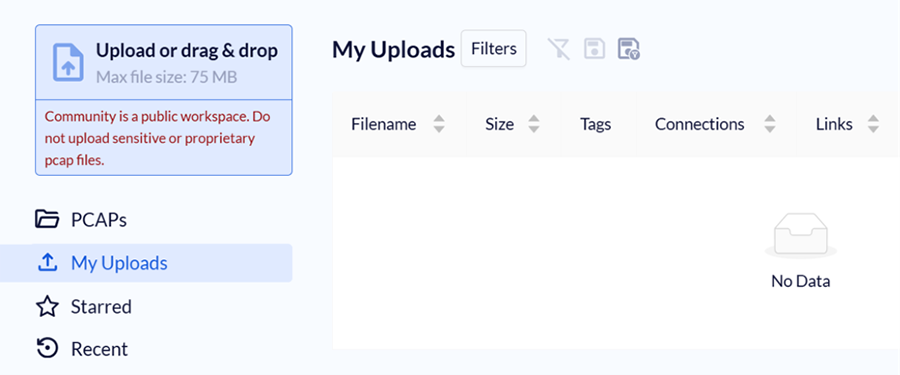
  2. Select Upload in DynamiteLab (see the screenshot provided).
  3. Select the file from your computer.
ITN12

For most assignments you will be provided a pcap file, which you will need to upload to DynamiteLabs.

Follow these steps to get started:

  1. Get the pcap file from the course materials and put it on your computer. For this, we can use this EXAMPLE.pcap.
  2. Select the Upload button in DynamiteLab as seen in the given image.
  3. To add the file you just downloaded to your lab environment, select it.
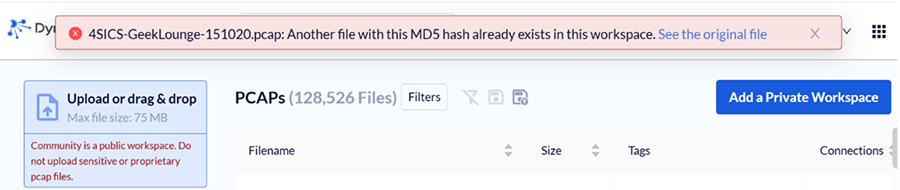
Since we are going to be working with standard pcap files, you may receive this alert when uploading a file. If you see this alert (screenshot provided), simply select the blue link to open the existing file.

ITN13

Step 5: Open the analysis view

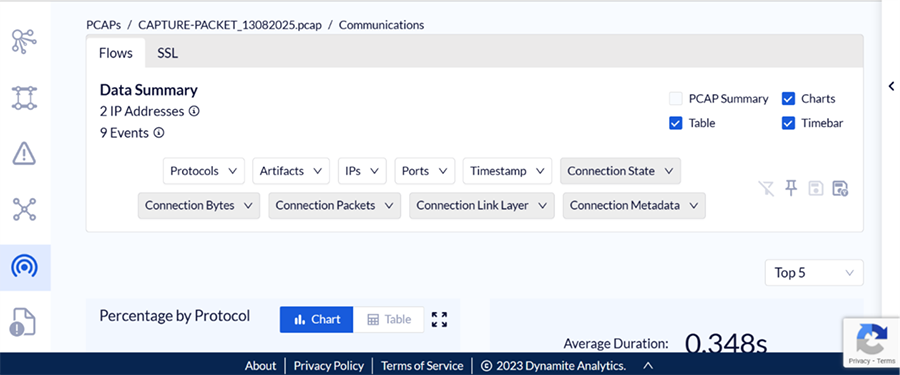
Once uploaded, select the file to open it. You’ll see the analysis view (screenshot provided), which contains all the tools needed for exploring network traffic.

ITN11

Throughout the course, you’ll receive specific directions on how to use these tools for different activities.

term to know
Packet Capture (pcap)
A file that stores network traffic data collected during packet sniffing. These files can be opened with analysis tools to inspect individual packets and communication patterns.


2. Network Traffic

So far, you’ve explored the models that explain how networks are built, how data is structured, and how devices communicate. You’ve also learned how data is prepared for travel and how devices such as NICs and routers move it along.

Now it’s time to go deeper. Instead of just imagining how data flows through a network, you’ll see it in action.

When something goes wrong, professionals often use a technique called packet sniffing to view the actual data moving between devices. Packet sniffing uses special tools to capture and examine the small units of data that travel across a network. These units are stored in a pcap file, which records the collected traffic.

By reviewing a capture, you can inspect details such as source and destination addresses, the protocols being used, and whether responses were received. This makes packet sniffing one of the most powerful ways to investigate how data moves across a network.

term to know
Packet Sniffing
The process of capturing and analyzing data packets as they travel across a network, often used for troubleshooting or monitoring traffic.


3. TCP

When analyzing network traffic, one of the most common and important protocols you’ll see is TCP, or Transmission Control Protocol. TCP is part of the Transport Layer in the TCP/IP model, and it is responsible for making sure data is delivered accurately, in the correct order, and without duplication. It supports many everyday activities, such as loading webpages, sending emails, or downloading files.

Unlike faster but less reliable protocols such as UDP, TCP is connection oriented. This means it creates a stable, two-way link between devices before any data is exchanged. This initial setup, known as the TCP handshake, is the first sign of a reliable connection and something you’ll learn to identify in a packet capture.

To keep communication reliable, TCP breaks up the data into smaller parts called segments. A segment is a unit of data created at the Transport Layer that includes part of the original message, along with control information, such as a sequence number. These sequence numbers help the receiving device reassemble the data in the correct order, even if the segments arrive separately or out of order. If segments are missing or duplicated, TCP can detect the issue and request retransmission.

A key part of this reliability is error checking. Each segment includes a checksum, a calculated value based on the data in the segment. The receiving device recalculates the checksum and compares it to the one sent. If the values do not match, the segment has likely been corrupted, and TCP discards it and requests that it be sent again.

TCP also helps manage the speed of communication using a method called flow control. It adjusts the amount of data sent based on how much the receiving device can process at one time. If the receiver is processing data slowly, TCP slows the sending rate to prevent overload.

In addition to flow control, TCP uses congestion control to respond to network conditions. Network congestion happens when too much data is sent at once, overwhelming routers or links and causing delays or lost packets. TCP detects signs of congestion, such as missing acknowledgments or increased delays, and reduces its sending rate to ease pressure on the network. It then gradually increases the rate again once conditions improve.

Together, these mechanisms make TCP a reliable, flexible, and self-correcting protocol. When you analyze a network capture, you can often tell whether a connection succeeded or failed just by examining how TCP behaved, especially during the handshake.

Before two devices can exchange data using TCP, they go through a structured process called the TCP handshake. This process confirms that both sides are ready to communicate and agree on how to exchange data. It also helps establish a reliable, stateful connection, meaning the devices will track their communication and respond to each other in order.
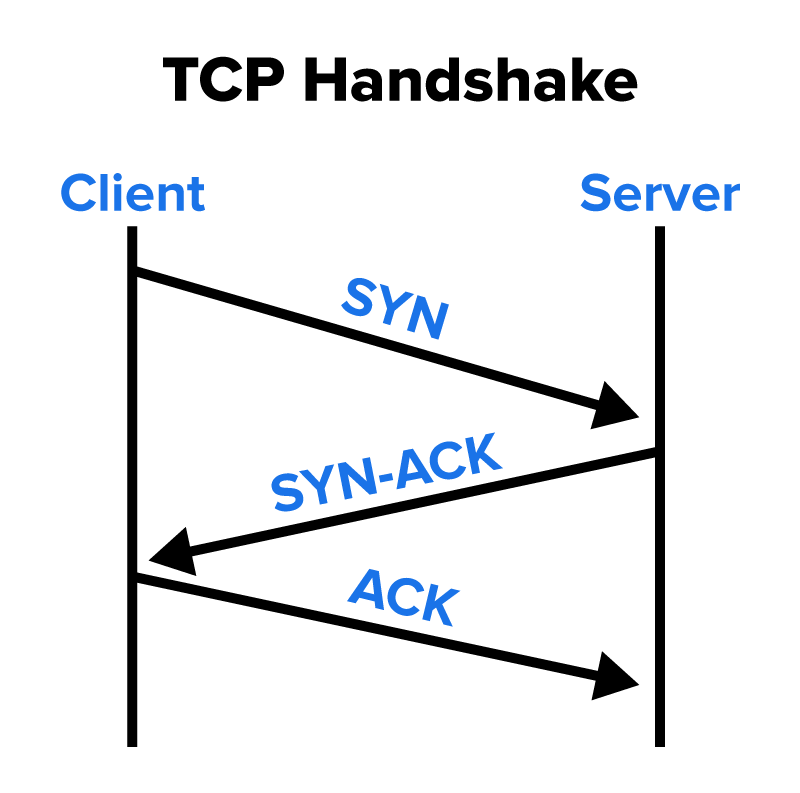
ITN14

  1. The client sends a TCP SYN (Synchronize) segment to initiate a connection with the server. This segment includes a starting sequence number and a flag indicating that it is a synchronization request. It is the first step in the TCP three-way handshake, which establishes a reliable connection between two devices.
  2. The server responds with a SYN-ACK (Synchronize-Acknowledge) segment, which acknowledges the client’s SYN and includes the server’s own SYN with its initial sequence number. This response confirms that the server received the client’s request and is ready to establish a connection.
  3. The client completes the handshake by sending an ACK segment, acknowledging the server’s SYN. At this point, the TCP connection is established, and data transfer can begin. The three-way handshake ensures that both devices are synchronized and helps prevent issues such as replayed or delayed SYN segments from being accepted.
TCP also uses port numbers to direct traffic to the right application on a device. Think of an IP address as the street address of a building and ports as room numbers inside it. Here are a few examples:

  • Port 80 is used for regular web traffic (HTTP).
  • Port 443 is used for secure web traffic (HTTPS).
Each connection has a source port (chosen by the client) and a destination port (used by the server’s service). This combination helps match outgoing and incoming data to the right apps on each device.

Even if your packet sniffing tool does not label the handshake steps with terms such as SYN or ACK, you can still confirm that a TCP handshake occurred by looking at three key signs in the traffic:

  1. A TCP stream is established between two devices using unique source and destination ports.
  2. Data is successfully sent and received on that connection.
  3. The connection stays open long enough to allow meaningful communication (not instantly reset or refused).
These clues tell you that the handshake is completed, and the devices are communicating reliably. When you analyze the packet capture, you’ll use these observations to verify that TCP was used to set up and maintain a working connection.

EXAMPLE

  • Open DynamiteLab and upload this file: 00.pcap.
  • Go to the Communications. You’ll see a summary of TCP flows in a table.
  • Look at the State column:
    • SF means the TCP three-way handshake completed successfully.
    • S1 means the handshake failed.
    • RSTO/REJ means the connection was reset or rejected, and no handshake was successful.
Let’s first examine a successful connection.

ITN20

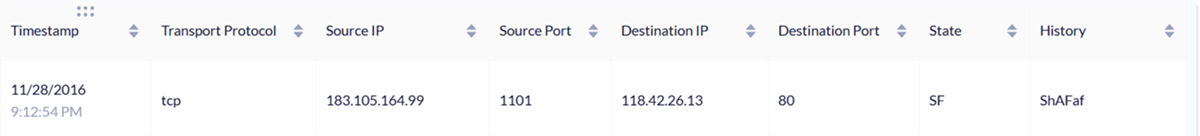
  • Client: 183.105.164.99 (source)
  • Server: 118.42.26.13 on port 80
    • Port 80 is the well-known port for HTTP (web traffic).
    • This shows the client was connecting to a web service.
  • State = SF: Handshake completed and closed normally
By looking at the History column, we can learn more information.

History = ShAFaf

  • S = SYN (client starts)
  • h = SYN-ACK (server replies)
  • A = ACK (client confirms) → handshake is complete
  • F/f = (both sides end politely)
In this screenshot, the History column has been moved next to the State column for easier viewing. In DynamiteLab, the History column normally appears about eight columns to the right, so you may need to scroll over to find it.

Let’s look at an unsuccessful connection.

  • Upload the file handshake.pcap to DynamiteLab.
  • Go to the Communications tab. You’ll see a summary of TCP flows.
Here is a connection summary that shows what happens when a client tries to connect to a port where no service is listening.

ITN21

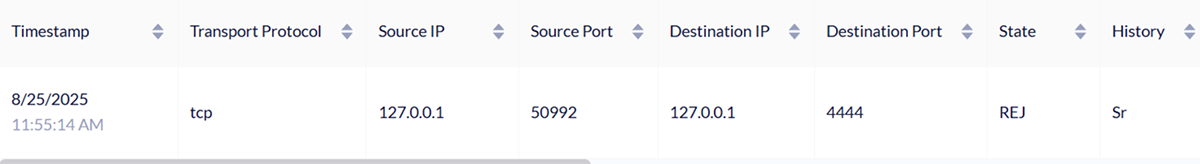
  • Client: 127.0.0.1 using port 50992
  • Server: 127.0.0.1 on port 4444
  • State = REJ
    • The connection was rejected. No handshake was completed.
  • History = Sr
    • S = SYN from the client, trying to start the handshake.
    • r = Reset from the server, refusing the request.
What is port 4444?

  • Port 4444 is not one of the common “well-known” ports such as 80 (web) or 443 (secure web).
  • It’s just a high-numbered port often used for testing or sometimes by certain tools or malware.
  • In this example, nothing was listening on port 4444, so the connection was refused. Therefore, a handshake never happened, and no data was exchanged.

try it
Use DynamiteLab to examine a 1.1.4_2.pcap file with TCP traffic. Use the TCP connection summary to answer the following questions:
3. In your own words, explain the difference between a successful connection and an unsuccessful one.
A successful connection means the client reached a listening service and completed the handshake. An unsuccessful connection means the handshake failed because the destination refused or reset the request.

ITN100

watch
TCP Handshake Analysis with DynamiteLab

In real life, this happens in milliseconds. When you open Netflix, your app handshakes with servers to stream reliably. TCP connections are designed to be made and broken down quickly and efficiently so that necessary information can be passed to systems with as little downtime as possible.

terms to know
Segment
A unit of data created by the Transport Layer that includes part of the original message along with control information, such as sequence numbers and a checksum.
Sequence Number
A number assigned to each TCP segment that allows the receiving device to reassemble data in the correct order.
Checksum
A calculated value included in each TCP segment to detect errors. If the received value does not match, the segment is discarded and retransmitted.
Flow Control
A method used by TCP to prevent the sender from overwhelming the receiver by adjusting how much data can be sent at a time.
Congestion
A network condition where too much data is transmitted at once, causing delays or dropped packets because devices or links are overloaded.
TCP Handshake
The initial setup process (SYN, SYN-ACK, ACK) that creates a reliable, two-way connection between devices before data is exchanged.
SYN (Synchronize)
A TCP segment sent by a client to request a connection and share its starting sequence number.
SYN-ACK (Synchronize-Acknowledge)
A TCP segment sent by a server that acknowledges the client’s SYN and provides its own sequence number.
ACK (Acknowledge)
A TCP segment used to confirm the receipt of a SYN or other data, completing the handshake and supporting reliable communication.
Port Number
A numerical identifier that directs traffic to the correct application on a device, such as port 80 for HTTP or port 443 for HTTPS.
Source Port
A port number chosen by the client to identify its side of a TCP connection.
Destination Port
A port number used by the server’s service to receive traffic and match it to the correct application.
SF (Successful Finish)
A state in packet capture analysis that shows a TCP handshake completed successfully and the session ended normally.
REJ (Rejected Connection)
A state in packet capture analysis that shows a TCP handshake attempt was refused, usually because no service was listening on the destination port.


4. ICMP

So far, you have seen how TCP establishes reliable connections between devices using a handshake process. However, what happens when things do not go as planned, such as when you cannot reach a server or a connection fails partway through?

That is where network diagnostic tools such as ICMP, Ping, and Traceroute come into play. These tools do not carry data like TCP does. Instead, they help you detect and understand problems. Whether you are checking if a device is online or tracing how your data travels, these tools give you visibility into how networks behave when things go right and when they go wrong.

4a. Echos

Imagine sending a package across town. Instead of it simply disappearing, you receive a note back that says, “Address not found” or “Delivery delayed.” In networking, ICMP works in a similar way. It does not carry your data, but it sends helpful messages about what is happening to that data on the network.

Internet Control Message Protocol, ICMP, is a companion to IP. ICMP works alongside the Internet Protocol (IP) at the Network Layer. While TCP makes sure your data is delivered reliably, IP is responsible for addressing and routing that data. ICMP supports IP by sending messages when things go wrong. For example, if a router cannot forward a packet or if a destination is unreachable, ICMP sends a message back to the sender to report the issue. These messages can be observed using packet sniffing tools.

Some of the most common ICMP messages are called echo messages. These include the following:

  • Echo Request: A device sends this message to ask another device if it is reachable.
  • Echo Reply: If the other device is available, it responds to confirm that it received the request.
These two message types are used by the Ping tool, which you will explore in the next section. When you use Ping, you send an Echo Request and wait for an Echo Reply.

ICMP can also send other types of error messages. Here are a few examples:

  • If the destination is unreachable, ICMP sends a “destination unreachable” message.
  • If a packet takes too long to reach its destination, ICMP sends a “time exceeded” message to let the sender know the packet expired.
Although ICMP is not responsible for sending actual files or images, it plays an important role in helping devices understand when and why communication fails. It gives your computer the ability to respond to network problems instead of staying in the dark.

Some network devices or firewalls may block ICMP messages to prevent abuse, which can make troubleshooting more difficult. Still, ICMP remains a core part of network diagnostics and an essential part of tools such as Ping and Traceroute.

terms to know
ICMP (Internet Control Message Protocol)
A Network Layer protocol used for sending error messages and diagnostic information, such as “destination unreachable” or “time exceeded.” It supports tools such as Ping and Traceroute to help identify and fix network problems.
Echo Request
An ICMP message (Type 8) sent from one device to another to check if the destination is reachable. Commonly used in the ping command.
Echo Reply
An ICMP message (Type 0) sent in response to an Echo Request, confirming that the destination is active and responding.

4b. Ping

The term ping comes from sonar technology, where a sound pulse is sent out and its echo is measured when it returns. In networking, Ping works the same way. It sends an ICMP Echo Request to a device and waits for an Echo Reply.

When you run the ping command, your computer sends a small message to another device, such as a server or router. If that device is online and reachable, it responds. Your computer then measures how long the round trip took. This simple exchange helps you answer an important question: Can my device reach the destination?

Here is what Ping can tell you:

  • If you receive replies, the device is reachable and responding.
  • If the request times out, the device may be offline, too busy, or blocked by a firewall.
  • If some replies are missing or delayed, the network may be unstable or overloaded.
You can use Ping to test a website, a server, or even your local network. For example, if your internet is not working, you can ping your router to see if your computer is connected to the network. You can also ping a public server such as Google’s DNS (8.8.8.8) to check if the issue is with your provider.

EXAMPLE

Let’s use the Ping tool to determine whether Google’s DNS (8.8.8.8) is reachable.

For Mac users:
  1. Open Terminal.
    1. Open search by pressing CMD + Spacebar.
    2. Type Terminal and press Return, or find it in Applications > Utilities.
    3. A window with a command line will appear.
  2. Run Ping.
    1. Type the command ping 8.8.8.8 and press Return.
    2. Observe the results.
For Windows users:
  1. Open Command Prompt.
    1. Select the Start menu (Windows icon), or press the Windows key.
    2. Type cmd in the search bar and press Enter.
  2. Run Ping.
    1. Type the following command and press Enter ping 8.8.8.8.
  3. Observe the results.
When you run a ping command, you will see output similar to this:

Pinging 8.8.8.8 with 32 bytes of data:
Reply from 8.8.8.8: bytes=32 time=40ms TTL=117
Reply from 8.8.8.8: bytes=32 time=43ms TTL=117
Reply from 8.8.8.8: bytes=32 time=41ms TTL=117

Ping statistics for 8.8.8.8:
     Packets: Sent = 4, Received = 4, Lost = 0 (0% loss),
Approximate round trip times in milli-seconds:
     Minimum = 40ms, Maximum = 43ms, Average = 41ms

Here is what each part tells you:

  • Reply from 8.8.8.8 means the destination responded.
  • bytes=32 shows the size of the ICMP Echo Request and Reply.
  • time=40ms is the round-trip time, or how long it took for the message to go to the destination and back.
  • TTL=117 stands for Time To Live, which is a value that decreases with each router the message passes through. TTL gives a sense of how far the packet traveled.
Below that, you see a summary:

  • Packets sent and received show whether anything was lost in transit.
  • 0% loss means every request received a reply.
  • Minimum, maximum, and average times help measure network stability. A small range means the connection is steady.

Ping is most useful when something is not working and you want to know whether the problem is with your device, your network, or the destination. If all requests time out, the destination may be down, unreachable, or blocking ICMP.

Ping is a helpful starting point when you want to know if a device is reachable. However, it only shows part of the picture. It does not tell you how many packets were actually sent, if any were delayed, or whether replies were missing. You also cannot see which IP addresses were involved without looking behind the scenes.

To really understand how ICMP Echo Requests and Replies behave on a network, it helps to examine the traffic using a tool that can capture and summarize it.

EXAMPLE

Investigate the file ICMP pcap file with DynamiteLab.

In this pcap file, there are several rows of traffic, but focus on the ones that use the ICMP protocol. These represent the familiar “ping” exchange between two devices on the same network.

Let’s take a closer look at what they show.
  • The first line lists the Source IP as 10.67.5.1 and the Destination IP as 10.67.5.6. This means the device at 10.67.5.1 is sending traffic to 10.67.5.6. The Protocol column shows ICMP, and the Packets Sent column shows 8, with Packets Received also 8. These are ICMP Echo Requests—the “Are you there?” messages a device sends to test connectivity. Because the packets were both sent and received successfully, we know that the requests reached their destination and that replies came back.
  • A few lines later, you’ll see traffic flowing the opposite direction, where the Source IP is 10.67.5.6 and the Destination IP is 10.67.5.1. This is the reply traffic. Here again, Packets Sent equals Packets Received at 8, and both sides exchanged an equal number of bytes. These are the ICMP Echo Replies—the “Yes, I’m here” responses that confirm successful communication.
  • There is also an additional ICMP conversation between 10.67.5.1 and 10.67.5.60, which shows the same request-reply pattern. The equal packet counts and matching byte totals across these rows confirm that the network path between the devices is healthy and that ICMP messages are being exchanged reliably.
By matching the Source and Destination IPs across the two rows, you can see the request–reply pattern that makes up a successful ICMP exchange. This is the same process that happens when you run the ping command.
try it
Visit lab.dynamite.ai and analyze this pcap file that contains ICMP traffic. In this capture, you’ll notice that most rows use TCP or UDP. Only a handful of rows are marked with the ICMP protocol. Your task is to focus on those rows and analyze them. Use the connection summary to answer the following questions:
2. Look at the Source IP and Destination IP values. Which addresses are sending Echo Requests?
The devices 192.168.100.138, 4.68.101.162, 192.205.33.210, 12.122.133.137, 192.168.100.1, 12.153.21.202, 12.180.241.1, 12.86.61.157, and 12.122.133.110 all send Echo Requests.
3. Is there any successful ICMP reply in this capture? How do you know?
Yes. The only successful ICMP replies occur between 192.168.100.138 and 4.2.2.1. Since the summary shows 27 packets sent and 3 received. This indicates that three Echo Replies were returned successfully, confirming partial connectivity.
4. Initiator and Responder: Based on the data, which device is initiating the Echo Request, and which device is replying?
The device 192.168.100.138 is initiating the Echo Requests, while 4.2.2.1 is responding with Echo Replies.
5. Explanation: In your own words, describe the difference between an Echo Request and an Echo Reply. Use details from the ICMP rows in this dataset to support your answer.
ICMP Echo Requests ask, “Are you there?” and Echo Replies answer, “Yes, I’m here.” In this dataset, only 4.2.2.1 responds, showing that some destinations are reachable while others either block ICMP or are offline.

ITN101

watch
ICMP Analysis with DynamiteLab

term to know
Ping
A diagnostic tool that uses ICMP Echo Requests and Echo Replies to test whether another device is reachable and to measure how long it takes for a message to travel to that device and back.


5. Traceroute

While Ping tells you whether a destination is reachable, traceroute shows you the path your data takes to get there. It reveals each device your packet passes through along the way, including routers and gateways. This is especially helpful when something is slow or not working, and you want to know where the problem is happening.

Traceroute works by sending a series of packets with increasing TTL values. TTL is a number that limits how many steps, or hops, a packet can take through the network. The first packet is allowed to travel only one hop, the next is allowed two, and so on. Each time a packet expires, the router that discards it sends back an ICMP Time Exceeded message. Traceroute collects these replies and builds a list of all the points along the route.

The result is like a travel log for your data. You can see how far your packet gets before reaching its destination, and where delays or failures occur.

A normal Traceroute shows a list of IP addresses or hostnames, each representing a device in the path. Alongside each hop, you will see one or more response times measured in milliseconds.

  • If a hop replies quickly, that part of the network is healthy.
  • If a hop takes a long time, it may be overloaded or distant.
  • If a hop shows an asterisk (*), it did not respond. This is common for some routers that block ICMP messages.
You can use Traceroute to troubleshoot problems such as slow loading times or broken connections. For example, if you cannot reach a website and the trace fails halfway, the issue might be with a router outside your local network.

EXAMPLE

Using Traceroute, you can observe the path from a computer to a public server. If you would like to try it, you can follow these directions.

For Windows users:

  1. Open Command Prompt by searching for “cmd.”
  2. Type tracert google.com and press Enter.
For Mac or Linux users:

  1. Open Terminal.
  2. Type traceroute google.com and press Enter.
The screenshot shows an example of a completed Traceroute to Google.com from a Windows computer.

ITN15

Looking at the image, you can see the following:

  • Hop 1 shows all asterisks (*), meaning the local router or firewall didn’t respond. This is common and not a problem.
  • Hop 2 is the first visible router, with response times of 38–45 ms.
  • Hop 3 includes a hostname (e.g., zayo.com), showing the packet entered an ISP network.
  • Hops 4–5 timed out, likely due to ICMP being blocked. This is normal if the trace continues.
  • Hop 6 shows a Google hostname (1e100.net), indicating entry into Google’s network.
  • Hops 7–14 continue through Google’s infrastructure, with consistent times under 70 ms.
  • Hop 15 is the final destination, google.com (142.250.190.142), with stable times and a successful trace.
This Traceroute reveals the following:

  • The destination is reachable.
  • Most routers along the path responded, showing the full route.
  • Some routers did not reply, but this did not prevent the connection.
  • Response times are consistent, with no major delays or signs of congestion.

Protocols such as TCP and ICMP leave behind clues about whether communication is working as expected. These packet sniffing tools allow you to capture and inspect those clues in real traffic. By opening a packet capture file, you can observe handshake sequences, Echo Requests and Replies, and other protocol behavior directly. This deeper view confirms what tools such as Ping and Traceroute suggest and gives you the ability to troubleshoot with greater precision. Whether you are verifying that a TCP connection was completed or identifying dropped ICMP replies, packet sniffing helps make invisible communication visible.

terms to know
Traceroute
A network diagnostic tool that maps the path packets take to a destination by sending packets with increasing TTL values and receiving ICMP “time exceeded” messages from each router along the way.
Hop
A single step that a packet takes as it moves from one device (usually a router) to the next across a network. Traceroute measures each hop along the path to the destination.
ICMP Time Exceeded
A message sent by a router when a packet’s TTL reaches zero, used by Traceroute to reveal the router’s presence along the path.

summary
In this lesson, you explored the introduction to DynamiteLab, a powerful tool for capturing and analyzing network traffic through packet capture files. You examined how the TCP protocol ensures reliable communication using a three-way handshake, error detection, and congestion control. Then, you shifted to ICMP, a protocol designed not for data transfer but for network diagnostics, particularly through Echos—Echo Requests and Echo Replies—used to detect device availability. These echo messages formed the foundation of the Ping tool, which allowed you to measure reachability and round-trip time. Finally, you used Traceroute to map the path packets take through the network, using time-to-live (TTL) values and ICMP “time exceeded” messages to identify each hop between source and destination.

Source: THIS TUTORIAL WAS AUTHORED BY SOPHIA LEARNING. PLEASE SEE OUR TERMS OF USE.

Terms to Know
ACK (Acknowledge)

A TCP segment used to confirm the receipt of a SYN or other data, completing the handshake and supporting reliable communication.

Checksum

A calculated value included in each TCP segment to detect errors. If the received value does not match, the segment is discarded and retransmitted.

Congestion

A network condition where too much data is transmitted at once, causing delays or dropped packets because devices or links are overloaded.

Destination Port

A port number used by the server’s service to receive traffic and match it to the correct application.

Echo Reply

An ICMP message (Type 0) sent in response to an Echo Request, confirming that the destination is active and responding.

Echo Request

An ICMP message (Type 8) sent from one device to another to check if the destination is reachable. Commonly used in the ping command.

Flow Control

A method used by TCP to prevent the sender from overwhelming the receiver by adjusting how much data can be sent at a time.

Hop

A single step that a packet takes as it moves from one device (usually a router) to the next across a network. Traceroute measures each hop along the path to the destination.

ICMP (Internet Control Message Protocol)

A Network Layer protocol used for sending error messages and diagnostic information, such as "destination unreachable" or "time exceeded." It supports tools like Ping and Traceroute to help identify and fix network problems.

ICMP Time Exceeded

A message sent by a router when a packet’s TTL reaches zero, used by Traceroute to reveal the router’s presence along the path.

Packet Capture (pcap)

A file that stores network traffic data collected during packet sniffing. These files can be opened with analysis tools to inspect individual packets and communication patterns.

Packet Sniffing

The process of capturing and analyzing data packets as they travel across a network, often used for troubleshooting or monitoring traffic.

Port Number

A numerical identifier that directs traffic to the correct application on a device, such as port 80 for HTTP or port 443 for HTTPS.

REJ (Rejected Connection)

A state in packet capture analysis that shows a TCP handshake attempt was refused, usually because no service was listening on the destination port.

SF (Successful Finish)

A state in packet capture analysis that shows a TCP handshake completed successfully and the session ended normally.

SYN (Synchronize)

A TCP segment sent by a client to request a connection and share its starting sequence number.

SYN-ACK (Synchronize-Acknowledge)

A TCP segment sent by a server that acknowledges the client’s SYN and provides its own sequence number.

Segment

A unit of data created by the Transport Layer that includes part of the original message along with control information, such as sequence numbers and a checksum.

Sequence Number

A number assigned to each TCP segment that allows the receiving device to reassemble data in the correct order.

Source Port

A port number chosen by the client to identify its side of a TCP connection.

TCP Handshake

The initial setup process (SYN, SYN-ACK, ACK) that creates a reliable, two-way connection between devices before data is exchanged.

Traceroute

A network diagnostic tool that maps the path packets take to a destination by sending packets with increasing TTL values and receiving ICMP Time Exceeded messages from each router along the way.