Table of Contents |
There are many ways to find out what’s really going on within your network. Most administrators opt to directly keep tabs on network performance by looking at important factors like data rates and available bandwidth, using the many tools on the market designed to help with that.
When you hear people refer to things like load testing, connectivity testing, and throughput testing, they’re talking about network monitoring. You’ll also hear network monitors referred to as protocol analyzers.
Several third-party companies specialize in producing network monitors. One example is Fluke Networks, which makes some cool tools like the OptiView Network Analyzer. Microsoft had a graphical utility called Network Monitor that could be used to capture network traffic. It is now retired, but you can still download it here.
Some key network-monitoring tools and diagnostic utilities are software additions that run on an existing server operating system like Windows Server or Unix. Others are stand-alone hardware devices that you plug into your network. Both are versions of the packet sniffers we talked about in the previous tutorial.
Although it is true that hackers can and do use sniffers to capture network traffic and gather data for an attack, system administrators make good use of them too. And strange but true, being a bit of a hacker yourself can make you a much better system admin. Knowing your enemies and their methods can help you find the same holes they would use for evil, and you can use that knowledge to plug security holes and even optimize your network’s performance.
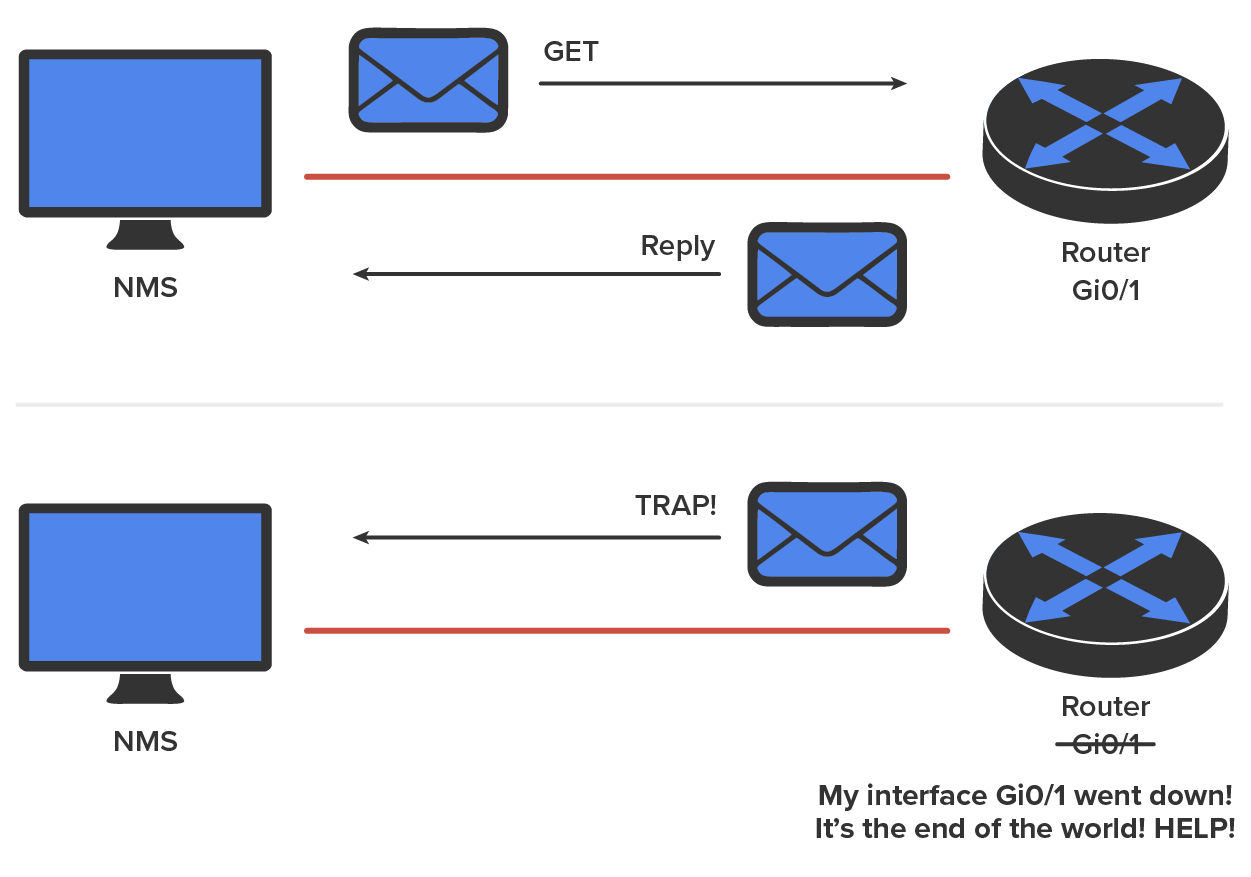
Simple Network Management Protocol (SNMP) is an Application Layer Protocol that provides a message format for agents on a variety of devices to communicate with network management stations (NMSs), for example, Cisco Prime or HP Openview. These agents send messages to the NMS station. The NMS station then reads or writes information in the database. The information is then stored on the management information base (MIB).
The NMS periodically queries or polls the SNMP agent on a device to gather and analyze statistics via GET messages. These messages can be sent to a console or alert you via email or SMS. The command snmpwalk uses the SNMP GET NEXT request to query a network for a tree of information. End devices running SNMP agents would send an SNMP trap to the NMS if a problem occurs. This is demonstrated in the figure below.
Admins can also use SNMP to provide some configurations to agents as well. These configurations are called SET messages. In addition to polling to obtain statistics, SNMP can be used for analyzing information and compiling the results in a report or even a graph. Thresholds can be used to trigger a notification process when exceeded. Graphing tools are used to monitor the CPU statistics of devices like a core router. The CPU should be monitored continuously, and the NMS can graph the statistics. Notification will be sent when any threshold you’ve set has been exceeded.
SNMP has three versions, with version 1 being rarely, if ever, implemented today. The table below shows a summary of these three versions.
| Version | Description |
|---|---|
| SNMPv1 | It supports plaintext authentication with community strings and uses only UDP. |
| SNMPv2c | It supports plaintext authentication with MD5 or SHA with no encryption but provides GET BULK, which is a way to gather many types of information at once and minimize the number of GET requests. It offers a more detailed error message reporting method, but it is not more secure than v1. It uses UDP even though it can be configured to use TCP. |
| SNMPv3 | It supports strong authentication with MD5 or SHA, providing confidentiality (encryption) and data integrity of messages via DES or DES-256 encryption between agents and managers. GET BULK is a supported feature of SNMPv3, and this version also uses TCP. |
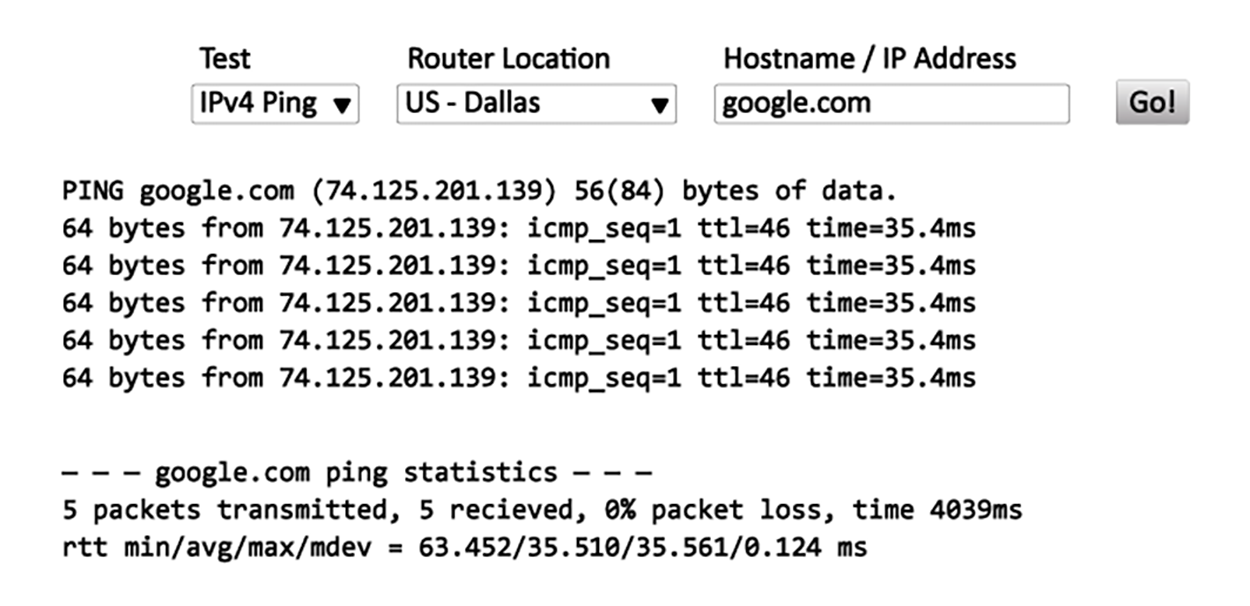
You can access a Looking Glass (LG) server remotely to view routing information. These are servers on the internet that run Looking Glass software that is available to the public. The servers are essentially read-only portals to the routers belonging to the organizations running them. They provide a ping or traceroute from a remote location for you. The following figure shows output from a Looking Glass server.
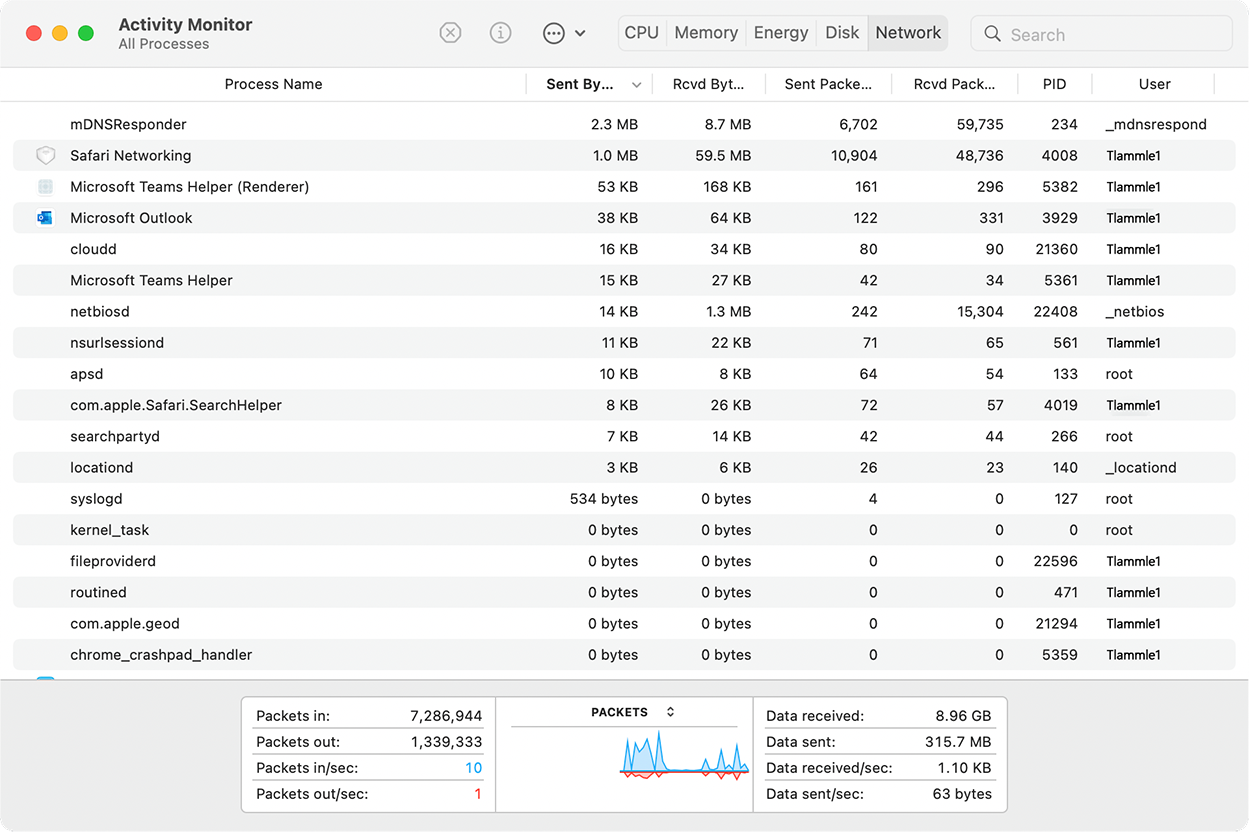
Wired and wireless analyzers can show you the bandwidth used on your network segments or wireless area. There are tools to help you find the stats on storage, network device CPU, and device memory for your servers and hosts.
For example, if you have a Mac, you can use the built-in activity monitor, which provides the CPU usage, memory statistics, energy used by the applications, disk usage, and network bytes sent and received, as shown in the screenshot below.
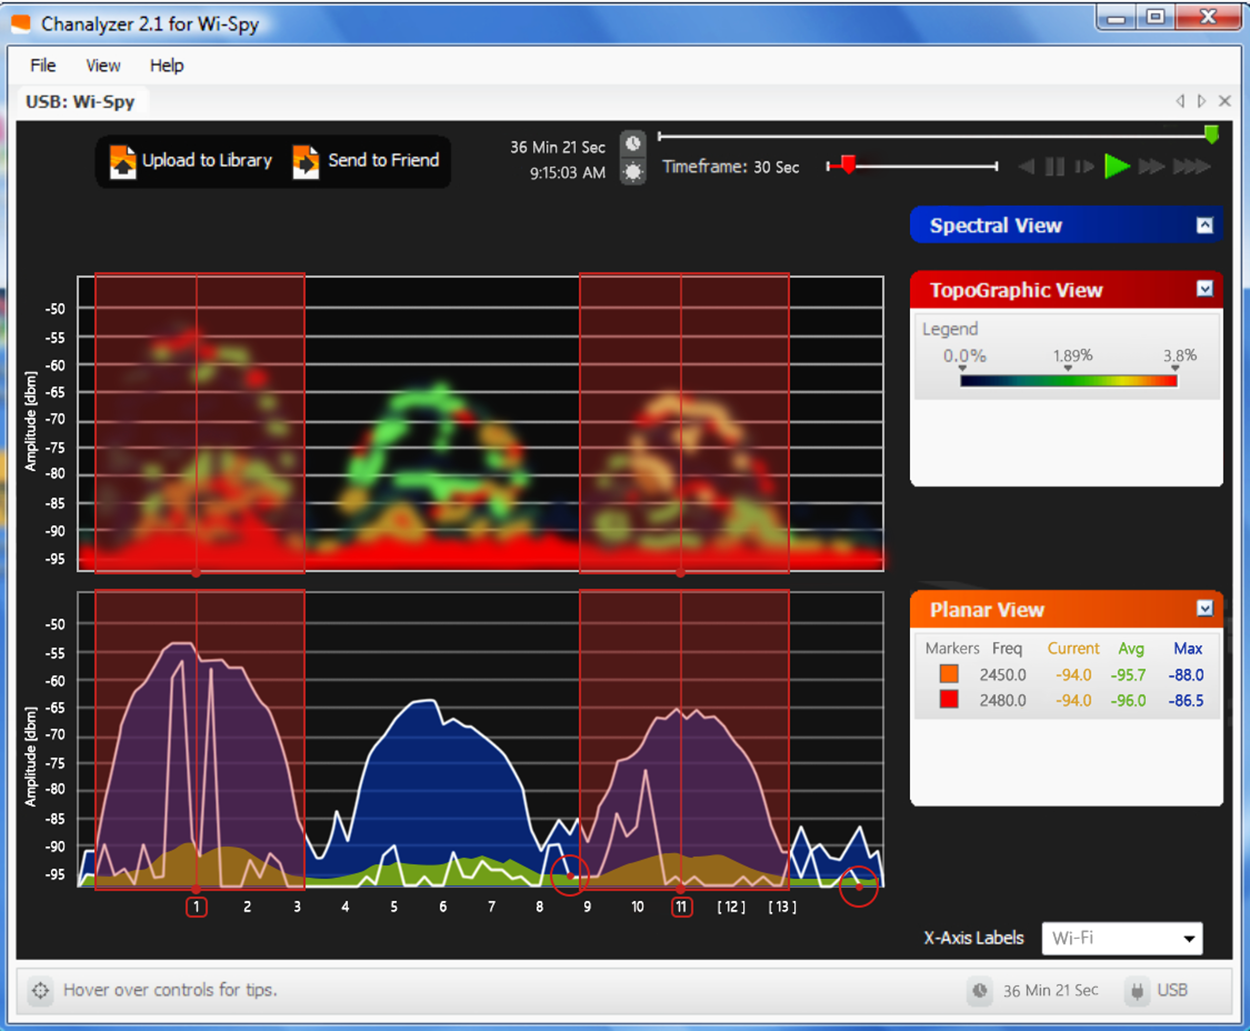
In addition to utilization information for your hosts, servers, networks, and so on, you need information about the wireless channel utilization on your network. To get this information, you can use a wireless analyzer. The wireless analyzer in the following screenshot shows channel utilization information. Notice that three channels—1, 6, and 11—are in use.
A protocol analyzer is often confused with a packet sniffer because some products really are both. Remember, a packet sniffer looks at all traffic on a network segment. On the other hand, a protocol analyzer (surprise!) analyzes protocols. These tools come in both software and hardware versions, but compared to the products discussed earlier, a network protocol analyzer is likely to give you more information and help than a sniffer will. This is because a bona fide protocol analyzer can actually help you troubleshoot problems, whereas most sniffers just provide information for you to have a ball deciphering.
A network protocol analyzer can perform the following functions:
Another good strategy for assessing a network’s health and well-being is via the more indirect route of monitoring the logs that your server operating systems keep. A log is a written record of activity. These can help you spot problems on your physical network as well as services or applications that aren’t running properly and could eventually bring the network or its resources down and make your users really unhappy.
Reading system messages from a switch’s or router’s internal buffer is a popular and efficient method of seeing what’s going on with your network at a particular time. But it’s even more useful to log messages to a syslog server, which stores messages from you and can even time-stamp and sequence them for you. The following figure depicts a syslog server and client in action.
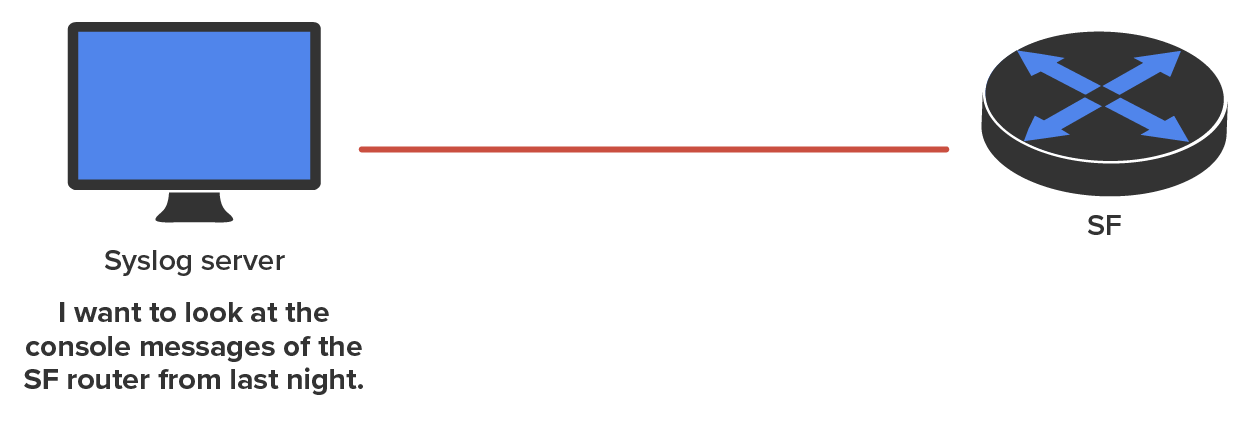
Syslog enables you to display, sort, and even search messages, all of which makes it a really great troubleshooting tool. The search feature is especially powerful because you can use keywords and even severity levels. Plus, the server can email admins based on the severity level of the message.
Network devices can be configured to generate a syslog message and forward it to various destinations. The following four examples are popular ways to gather messages from Cisco devices:
So, by default, we’d see something like this on our console line:
*Oct 21 17:33:50.565:%LINK-5-CHANGED:Interface FastEthernet0/0,
changed state to administratively down
*Oct 21 17:33:51.565:%LINEPROTO-5-UPDOWN:Line protocol on
Interface FastEthernet0/0, changed state to down
And the router would send a general version of the message to the syslog server that would be formatted something like this:
Seq no:timestamp: %facility-severity-MNEMONIC:description
The system message format can be broken down as shown in the table below.
| Component | Description |
|---|---|
seq no
|
Logs messages with a sequence number; As this does not get logged by default, you will have to configure it to get this output |
Timestamp
|
Logs messages with date and time of the message or event |
Facility
|
Logs the facility to which the message refers |
Severity
|
Logs a single-digit code from 0 to 7 that indicates the severity of the message |
MNEMONIC
|
Logs a text string that uniquely describes the message |
Description
|
Logs a text string containing detailed information about the event being reported |
The severity levels, from the most severe level to the least severe, are explained in the following table. “Informational” is the default and will result in all messages being sent to the buffers and console. If you are studying for your CompTIA Network+ exam, you need to memorize this table.
| Severity Level | Severity | Explanation |
|---|---|---|
| Emergency | Severity 0 | System unusable |
| Alert | Severity 1 | Immediate action needed |
| Critical | Severity 2 | Critical condition |
| Error | Severity 3 | Error condition |
| Warning | Severity 4 | Warning condition |
| Notification | Severity 5 | Normal but significant condition |
| Information | Severity 6 | Normal information message |
| Debugging | Severity 7 | Debugging message |
Understand that only emergency-level messages will be displayed if you’ve configured severity level 0. But if, for example, you opt for level 4 instead, level 0 through 4 will be displayed, giving you emergency, alert, critical, error, and warning messages too. Level 7 is the highest level security option and displays everything, but be warned that going with it could have a serious impact on the performance of your device. So always use debugging commands carefully with an eye on the messages you really need to meet your specific business requirements!
Security information and event management (SIEM) is a category of software products and services combining security information management (SIM) and security event management (SEM). SIEM technology provides real-time analysis of security alerts generated by network hardware and applications.
The acronyms SEM, SIM, and SIEM are often used interchangeably, but there are minor differences. SEM is typically used to describe the management that deals with real-time monitoring and correlation of events, notifications, and console views. SIM is used to describe long-term storage, analysis, and reporting of log data. And recently the term vSIEM (voice security information and event management) was introduced to cover voice data visibility.
SIEM can collect useful data about the following items:
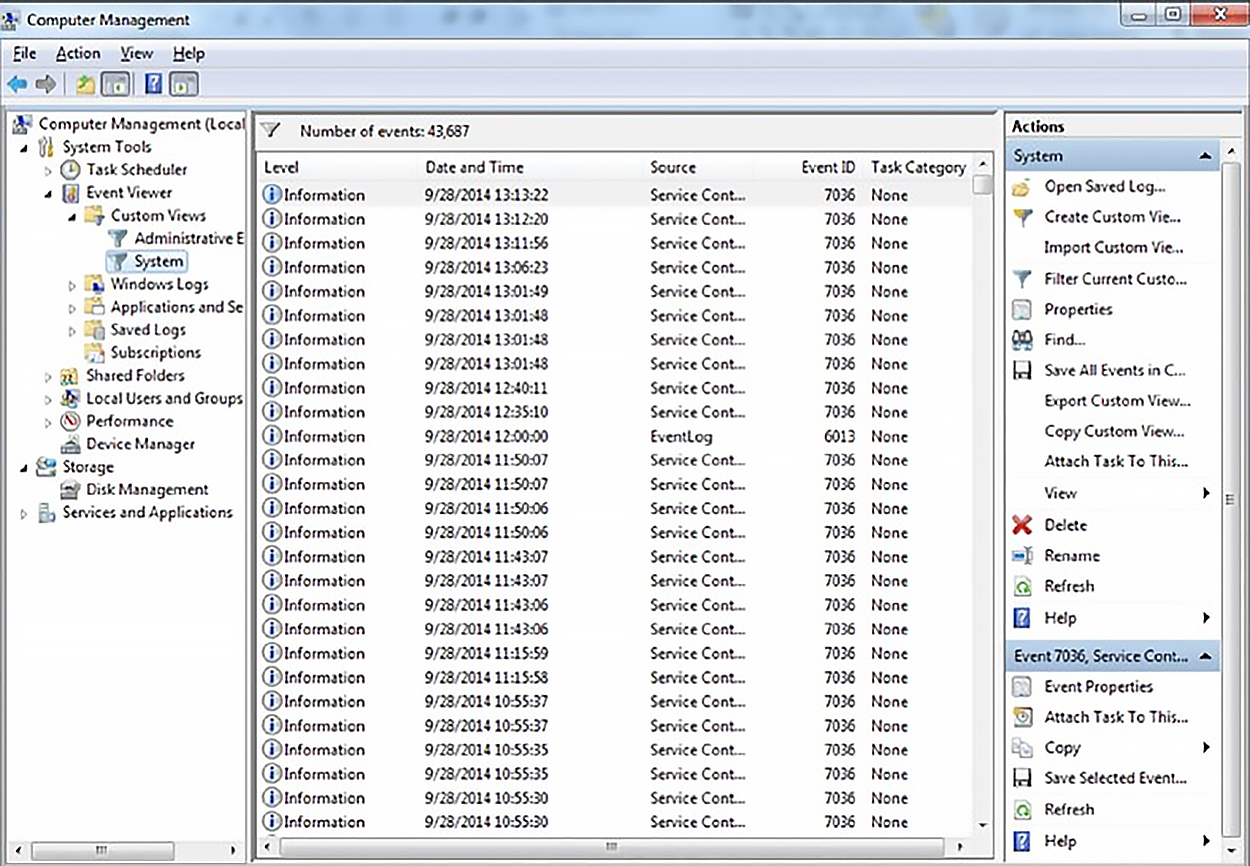
Windows Server 2016 (and most other Windows operating systems) comes with a tool called Event Viewer which provides several logs containing vital information about events happening on your computer. Other server operating systems have similar logs, and many connectivity devices like routers and switches also have graphical logs that gather statistics on what’s happening to them. These logs can go by various names, like history logs, general logs, or server logs .
The following screenshot shows an Event Viewer system log display from a Windows Server 2003 machine.
On Windows servers, a minimum of three separate logs hold different types of information. They are described in the table below.
| Log Type | Description |
|---|---|
| Application |
Contains events triggered by applications or programs determined by their programmers Example applications: LiveUpdate, the Microsoft Office suite, and SQL and Exchange servers |
| Security | Contains security events like valid or invalid logon attempts and potential security problems |
| System | Contains events generated by Windows system components, including drivers and services that started or failed to start |
Source: This content and supplemental material has been adapted from CompTIA Network+ Study Guide: Exam N10-007, 4th Edition. Source Lammle: CompTIA Network+ Study Guide: Exam N10-007, 4th Edition - Instructor Companion Site (wiley.com)