Use Sophia to knock out your gen-ed requirements quickly and affordably. Learn more
×

Multiple Linear Regression as a Machine Learning Model

Author: Sophia

what's covered
In this lesson, you will gain a comprehensive understanding of advanced techniques in multiple linear regression and their applications in machine learning. Specifically, this lesson will cover:

Table of Contents

1. Advanced Applications of Multiple Linear Regression in Machine Learning

Multiple linear regression is a powerful statistical technique used to model the relationship between a target variable and a set of features. In machine learning, it serves as a foundational method for predictive modeling and analysis. This tutorial explores advanced applications of multiple linear regression as a machine learning model, focusing on its practical uses and applications.

1a. Root Mean Square Error (RMSE)

In a previous tutorial, you learned about Mean Squared Error (MSE) and how it helps measure the accuracy of forecasts. Now, let's dive into another important metric called Root Mean Square Error (RMSE). RMSE is closely related to MSE but offers some additional benefits that make it easier to understand and use, particularly for predictive models in machine learning.

RMSE is a measure of how well a predictive model performs. It represents how far, on average, the model's predictions are from the actual values. The RMSE value is in the same units as the target variable because the square root is being applied to MSE, making it easier to interpret. RMSE is given by the following formula:

RMSE equals square root of fraction numerator sum subscript i equals 1 end subscript superscript n open parentheses y subscript i minus y with hat on top subscript i close parentheses squared over denominator n end fraction end root equals square root of MSE

  • n is the total number of observations
  • y is the observed (actual) target value 
  • y with hat on top is the predicted target value (the value predicted by the predictive model)
  • sum from i equals 1 to n of denotes the sum over all the observations 1 to n

EXAMPLE

Suppose you are a data analyst for a popular social media platform. Your job is to predict the number of likes a new post will receive based on various factors. The features used in the model include:

  • Number of Followers: The number of followers the user has.
  • Post Time: The time of day the post is made.
  • Post Type: The type of post (photo, video, text).
  • Hashtags: The number of hashtags used in the post.
  • Predictive Model: You use a multiple linear regression model to predict the number of likes a post will receive. You calculate RMSE for the predictive model.
  • RMSE Value: The RMSE of the model is found to be 150 likes.
What does an RMSE of 150 mean?

  • The RMSE value of 150 indicates that, on average, the model's predictions are off by 150 likes. This means that the predicted number of likes is typically within 150 likes of the actual number of likes.
Why is RMSE important?

  • Interpretability: Since RMSE is in the same units as the target variable (likes), it is easy to understand. In this case, the RMSE of 150 likes directly tells us about the average prediction error in terms of likes.
  • Model Evaluation: RMSE helps you evaluate the accuracy of your predictive model. A lower RMSE indicates a more accurate model, while a higher RMSE suggests that the model's predictions are less reliable.
Real-World Implications:

  • Content Strategy: Understanding the prediction error helps users and content creators plan their posts better. If the RMSE is low, they can be more confident in their predictions and optimize their posting strategies accordingly.
  • Engagement Analysis: Social media platforms aim to keep users engaged by showing them content that they are likely to interact with, such as liking, commenting, or sharing. To achieve this, platforms use predictive models like multiple linear regression that predict which posts will be most engaging for users. The regression model predicts the level of engagement (number of likes) users will have with a post.
  • Low RMSE Values: A low RMSE indicates that the regression model is making accurate predictions, with the predicted engagement levels (number of likes) being close to the actual engagement levels. This means the predictive model is effective at showing users content they are likely to interact with, leading to higher user satisfaction and engagement.
  • High RMSE Values: A high RMSE suggests that the regression model’s predictions are less accurate, with a larger difference between the predicted and actual engagement levels. This means the predictive model is less effective at recommending relevant content, potentially leading to lower user satisfaction and engagement. The company may need to improve the model to better meet user preferences.
In the context of this problem, determining whether an RMSE value is considered low or high depends on the typical range of likes a post receives on the platform.

In this example, the RMSE of 150 likes provides a clear measure of the regression model's prediction accuracy. It helps the social media platform understand how much error to expect in their predictions and make informed decisions based on this information. By using RMSE, the platform can evaluate the predictive models, leading to better decision-making for the company.

1b. K-fold Cross-Validation

Imagine you’ve created a new cookie recipe, and you want to know how much your friends will like it. Instead of asking all your friends at once, you test the recipe with a small group of friends first and observe their reactions. This gives you a better sense of how good the recipe really is. In machine learning, a similar approach is used through a technique called cross-validation.

Cross-validation is a method for evaluating how well a predictive model will perform on new data. It helps prevent common issues, such as overfitting and underfitting, which you learned about in the previous tutorial. By using cross-validation, you can assess how reliable your model is in making predictions on unseen data. Understanding this technique is crucial for building effective and reliable predictive models in business data analytics.

Cross-validation is used in different situations, such as:

  • Choosing the Best Model: To compare different models and pick the best one.
  • Tuning the Model: To adjust the model's settings for better performance.
  • Estimating Performance: To guess how well the model will work on new data.
  • Avoiding Overfitting: To make sure the model works well on different data, not just the training data.
While cross-validation is useful, it has some downsides:

  • Takes Time and Resources: It can be slow and uses a lot of computer power, especially with big datasets or more advanced machine learning models.
  • Linked or Similar Data: If there are related data points in the dataset (like data from the same person), k-fold cross-validation can give misleading results because it does not take those connections into account.
  • Not Great for Small Data Sets: If the data set is very small, setting aside some data for testing means there is less data left for training the model. With too little training data, the model might not learn well, making it seem like it performs worse than it actually would with more data.
K-fold cross-validation is a specific type of cross-validation. Here's how it works using the visual below as a guide:

  1. Splitting the Data: The dataset is divided into 5 equally sized groups, called folds. Each fold represents a subset of the dataset, ensuring diversity through random shuffling before the split.
  2. Selecting the Test Data: In each iteration, one of the folds (highlighted in orange) is used as the test set, while the remaining 4 folds (in blue) serve as the training data.
  3. Training and Validating the Model: The model is trained using the training folds and then evaluated using the test fold. The performance is measured using RMSE, which is displayed for each iteration.
  4. Repeating the Process: This process is repeated 5 times, with each fold taking a turn as the test set. This ensures that every data point gets tested exactly once, reducing bias and improving model reliability.
  5. Calculating the Average RMSE: The final row in the visualization aggregates the RMSE values from all iterations, depicted in orange bars. The RMSE values for each iteration are also overlaid on their respective bars, demonstrating how the final average RMSE is computed.

terms to know
Cross-Validation
Technique used in machine learning to evaluate how well a predictive model will perform on new, unseen data.
K-fold Cross-Validation
Method in which the data is divided into k equal parts, training the model on k-1 parts, and testing it on the remaining part, repeating this process k times to ensure robust model evaluation.


2. Multiple Linear Regression as a Machine Learning Model

Throughout the course, you have applied multiple linear regression in various scenarios. In machine learning, multiple linear regression is often used as a predictive model because it effectively captures the relationship between a target variable and multiple features. Additionally, it can handle large datasets, making it well-suited for big data scenarios and enabling accurate predictive analytics. Since regression models learn from data to make predictions, they are considered a fundamental type of machine learning model.

2a. Applying a Multiple Linear Regression Model as a Machine Learning Model

Let’s now explore how you can use regression as a predictive model in a machine learning context.

EXAMPLE

You are a data analyst at TechPulse Dynamics. The tech company is planning to launch a new wearable fitness tracker. The company wants to predict the success of this product launch based on historical data from previous product launches. This will help the company make informed decisions about marketing strategies, production planning, and resource allocation.

The data is contained in an Excel file named product_launch.xlsx that is stored in a GitHub repository here:
https://raw.githubusercontent.com/sophiaAcademics/BDA_Excel/main/StudentData/Tutorials/Unit5/5.3.2/product_launch.xlsx

The data set description is provided below.

Features:

  • Price: The price of the product.
  • Marketing_Spend: The amount of money spent on marketing the product.
  • Social_Media_Mentions: The number of times the product was mentioned on social media.
  • Pre_Orders: The number of pre-orders received before the launch.
  • Customer_Reviews: The number of customer reviews received within the first month.
  • Average_Rating: The average customer rating for the product (1 to 5).
Target Variable:

  • Success_Score: A numerical score from 1 to 100 where higher numbers represent a more successful product launch (higher numbers correspond to higher revenue).
Additional Variable:

  • Product_ID: A unique identifier for each product.
Your goal is to create a multiple linear regression model that reliably generalizes new data. In other words, the model should not only fit the historical data well, but also provide accurate predictions for future product launches.

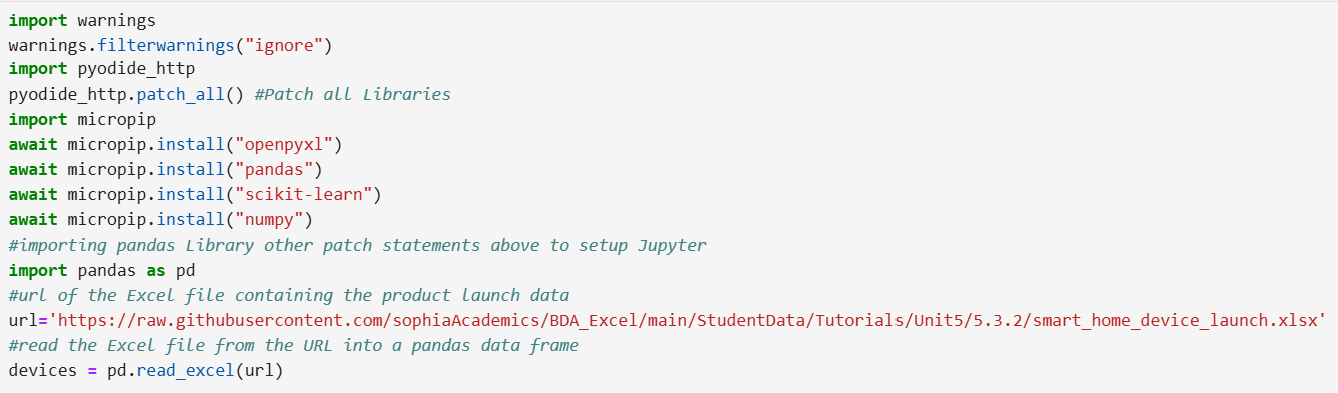
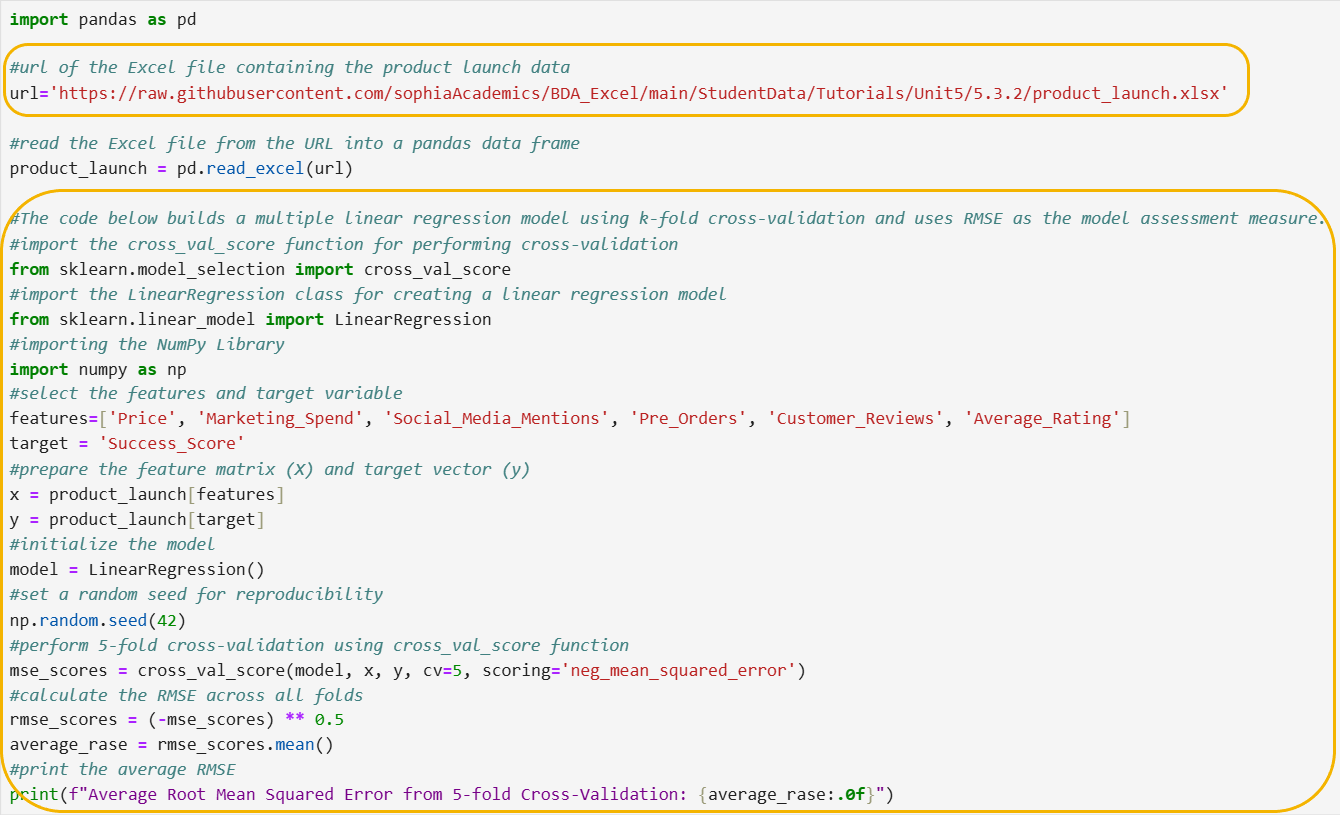
The code below imports pandas, imports an Excel file from a URL, and creates a pandas DataFrame named product_launch before creating a multiple regression model.


Let’s break down the steps of the code line by line.

Step 1: Import the necessary functions and classes.

from sklearn.model_selection import cross_val_score
from sklearn.linear_model import LinearRegression
import numpy as np
  • These lines import the necessary functions and classes from the sklearn library:
    • cross_val_score: This function is used to evaluate a model using cross-validation.
    • LinearRegression: This class is used to create a linear regression model.
  • The last line imports the Numpy library and gives it the nickname np for easier use in your code.
Step 2: Select the features and target variable.

features = ['Price', 'Marketing_Spend', 'Social_Media_Mentions', 'Pre_Orders', 'Customer_Reviews', 'Average_Rating']
target = 'Success_Score'
  • These lines specify the columns from the dataset that will be used as features and the target variable:
    • features: A list of column names that represent the features for the model. The column names are separated by commas and enclosed in single quotes.
    • target: The column name that represents the target variable the model will predict.
Step 3: Prepare the feature matrix (x) and target vector (y).

x = product_launch[features]
y = product_launch[target]
  • These lines create the feature matrix, x, and the target vector, y:
    • x: A data frame containing the feature columns specified in the features list.
    • y: A column containing the target variable specified by target.
Step 4: Initialize the model.

model = LinearRegression()
  • This line initializes a linear regression model.
You may remember from a previous tutorial when you were building regression models that you used the statsmodels library to build a simple linear regression model. The code sm.OLS(y, x).fit() created a regression model.

Why can you not use this same code when you are building a regression model in the context of machine learning?

The statsmodels library is useful for statistical analysis and gives detailed information about the model, like the significance of each variable. However, when you are building models for machine learning, you often need to handle larger datasets and focus on making accurate predictions. This is where the scikit-learn library comes in.

The LinearRegression() function from the scikit-learn library is designed specifically for machine learning tasks. It has tools to help with things like splitting data into training and testing sets and performing cross-validation. So, while statsmodels is useful for understanding the details of a model, scikit-learn is better suited for building and testing models in a machine learning context.

Step 5: Set a random seed.

np.random.seed(42)
  • This line sets the random seed to 42, ensuring that the random processes involved in k-fold cross-validation, such as the random shuffling of data before splitting it into folds, produce the same results each time the code is run. This helps in obtaining consistent and reproducible RMSE values. The Numpy library has a built-in function, random_seed, that allows you to set a random seed using any numerical value.
Let’s explore a random seed in simple terms.

Imagine you have a deck of cards, and you want to shuffle them. Each time you shuffle, the order of the cards will be different. Now, let's say you want to make sure that every time you shuffle, you get the exact same order of cards. To do this, you can use a random seed.

A random seed is like a special code or number that you use before shuffling. When you use the same seed, it tells the shuffling process to arrange the cards in the same way every time. So, if you use the seed 42 today and shuffle the cards, and then use the seed 42 again tomorrow and shuffle, you will obtain the same order of cards both times.

In coding, you use a random seed to make sure that any random processes, like shuffling data or picking random numbers, give you the same results every time you run the code. This helps you check your work and make sure your results are consistent. The seed can be any numerical value between 0 and close to 5 billion!

Step 6: Perform 5-fold cross-validation using cross_val_score function.

mse_scores = cross_val_score(model, x, y, cv=5, scoring='neg_mean_squared_error')
  • This line performs 5-fold cross-validation and calculates the mean squared error (MSE) for each fold:
    • cross_val_score: A function from the sklearn.model_selection module that evaluates a model using cross-validation.
    • model: The linear regression model to be evaluated.
    • x: The feature matrix.
    • y: The target vector.
    • cv=5: Specifies 5-fold cross-validation.
    • scoring='neg_mean_squared_error': Specifies that the negative mean squared error should be used as the scoring metric. The negative value is used because cross_val_score expects a metric where higher values are better, but for MSE, lower values are better.
      • Normally, MSE is calculated as the average of the squared differences between the actual and predicted values. Lower MSE indicates better model performance.
      • scikit-learn's cross_val_score function expects higher scores to indicate better performance. To fit this convention, it returns the negative of the MSE values when scoring='neg_mean_squared_error' is specified.
Step 7: Calculate the RMSE across all folds.

rmse_scores = (-mse_scores) ** 0.5
average_rmse = rmse_scores.mean()
  • These lines calculate the RMSE for each fold, and then compute the average RMSE:
    • rmse_scores: After obtaining the negative MSE values from cross_val_score, you take the square root of the negative values to get the RMSE. This conversion ensures that the RMSE values are positive and in the same units as the target variable.
    • average_rmse: The mean of the RMSE values across all folds.
Step 8: Print the average RMSE.

print(f"Average Root Mean Squared Error from 5-fold Cross-Validation: {average_rmse:.0f}")
  • This line prints the average RMSE from the 5 folds using format strings.
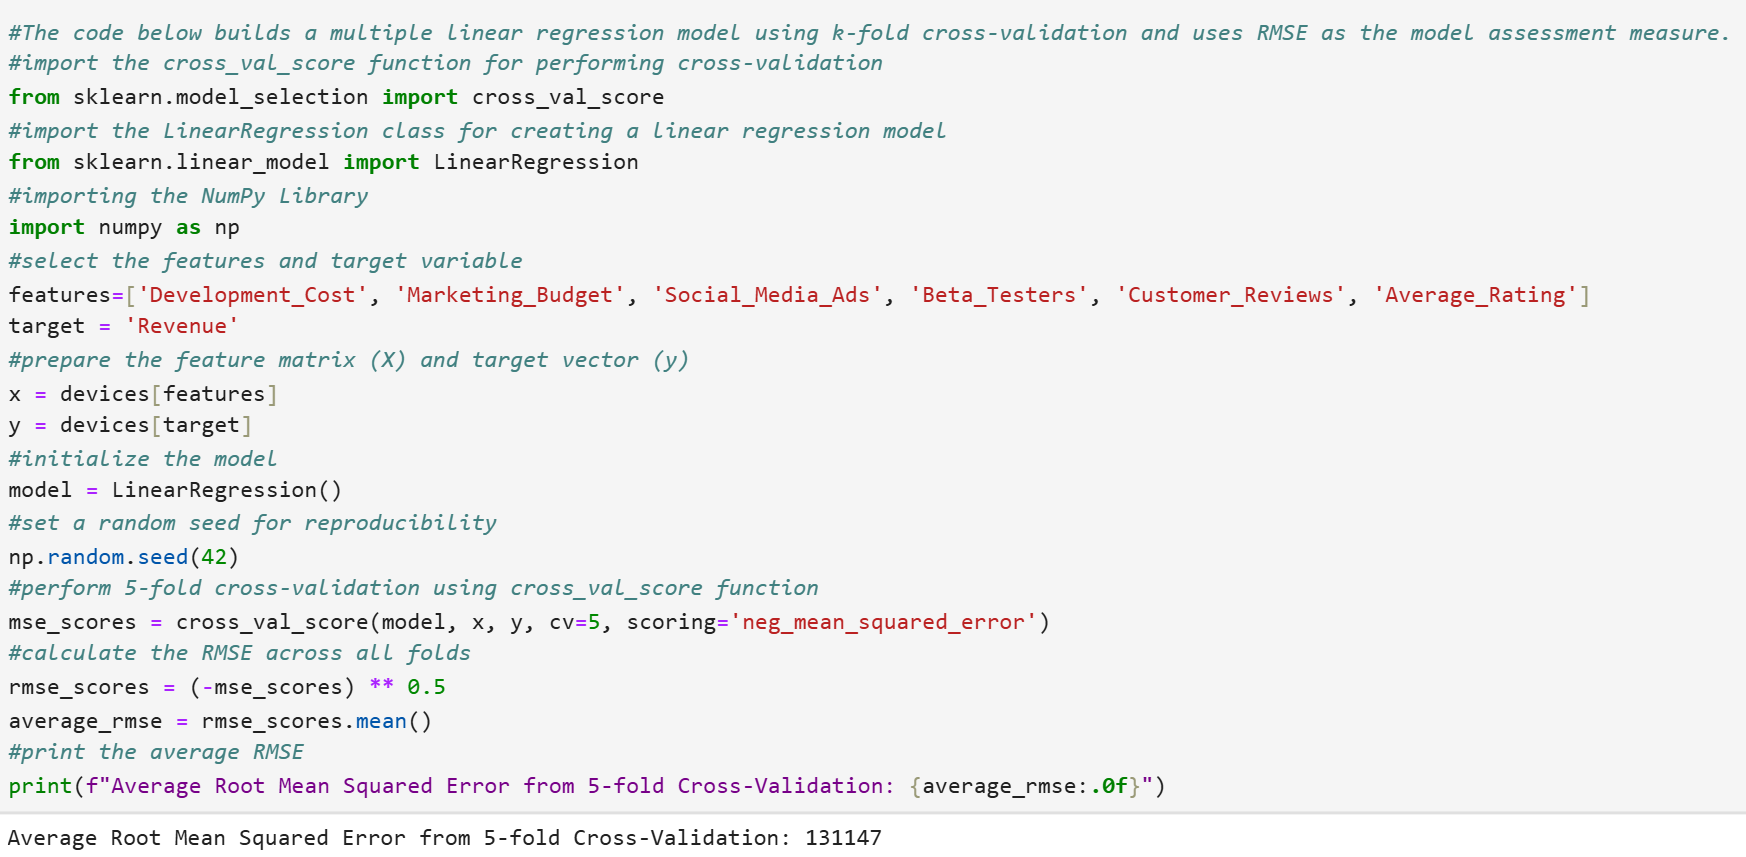
The average RMSE value for this model is 31 success score points, as shown in the output below. The RMSE value has been rounded to 0 decimal places.


Interpretation of RMSE in Context

The RMSE value of 31 success score points indicates the average deviation of the predicted success scores from the actual success scores. This means that, on average, the model's predictions are off by 31 points.

Insights Based on the RMSE Value

1. Model Accuracy

  • Understanding Prediction Accuracy: An RMSE of 31 suggests that while the model provides a reasonable estimate, there is still a notable difference between the predicted and actual success scores. This level of accuracy might be acceptable depending on the company's tolerance for prediction discrepancies.
2. Decision Making

  • Risk Assessment and Critical Thresholds:
    • A critical threshold is a specific value that helps decide if something is successful or not. Imagine you have a test score, and the passing mark is 70. If you score 69, you fail, but if you score 70 or above, you pass. Here, 70 is the critical threshold.
    • For TechPulse Dynamics, let's say the company decides that a product needs a success score of at least 75 to be considered successful. This 75 is the critical threshold.
    • The RMSE of 31 means that the model's predictions can be off by 31 points. So, if the model predicts a success score of 80 for a new product, the actual success score could be anywhere from 49 to 111 (80 ± 31).
      • Close to Threshold: If the predicted score is close to 75 (like 80), the company needs to be cautious. The actual score might be below 75, meaning the product might not be as successful as hoped.
      • Far from Threshold: If the predicted score is much higher (like 100), even with the RMSE, the product is likely to be successful.
3. Resource Allocation

  • Budgeting for Uncertainty: Given the RMSE, the company might allocate additional resources to account for potential inaccuracies in the predictions. For instance, if the model predicts high product success scores, the company could still prepare for a lower-than-expected outcome by setting aside contingency funds.
  • Production Flexibility: The RMSE can guide the company to maintain flexibility in production planning. With a 31-point difference between predicted and actual scores, the company might adopt a more conservative approach to avoid overproduction or underproduction.

Now, it is your turn to construct your own multiple linear regression model using k-fold cross-validation and evaluate its performance with RMSE, just like you did in the previous example.

try it
You are a data analyst at GreenTech Innovations. The company is planning to launch a new smart home device and wants to predict its revenue based on historical data from previous product launches. You have been tasked with building a multiple linear regression to predict revenue for the new smart home device. You have access to 100 observations, each containing various features, as described below. Your task is to use this data to create a model that accurately predicts the revenue for future product launches.

The data is contained in an Excel file named smart_home_device_launch.xlsx that is stored in a GitHub repository here:
https://raw.githubusercontent.com/sophiaAcademics/BDA_Excel/main/StudentData/Tutorials/Unit5/5.3.2/smart_home_device_launch.xlsx

The data set description is provided below.

Features:

  • Development_Cost: The cost of developing the device.
  • Marketing_Budget: The amount of money spent on marketing the device.
  • Social_Media_Ads: The number of social media ads run for the device.
  • Beta_Testers: The number of beta testers who tried the device before launch.
  • Customer_Reviews: The number of customer reviews received within the first month.
  • Average_Rating: The average customer rating for the device (1 to 5).
Target Variable:

  • Revenue: The total revenue generated by the device within the first six months of launch (in dollars).
Additional Variable:

  • Device_ID: A unique identifier for each device.
Perform the following:

  1. Import the Excel file and create a pandas DataFrame named home_device.
  2. Build a multiple regression model to predict revenue using 5-fold cross-validation, and use RMSE to assess the model performance.
  3. Interpret the average RMSE that is based on the 5-fold cross-validation that you obtained from #2 in the context of this business scenario.
Solution:

1. The code below will create a pandas DataFrame named home_device:


2. The code below builds a multiple linear regression model with Revenue as the target variable using 5-fold cross-validation and RMSE as the model assessment measure.


3. Interpretation of the average RMSE value of $131,147: 

  • An average RMSE value of $131,147 means that, on average, the predictions made by the multiple linear regression model differ from the actual revenue values by $131,147.
  • In the context of the problem, this indicates that the model's predictions for the revenue of the new smart home device are, on average, off by about $131,147 from the true revenue. This gives you an idea of the model's accuracy and how much error you can expect when using it to predict future revenues for new products.

watch
Check out this video on creating a model that accurately predicts the revenue for future product launches.

summary
In this lesson, you explored advanced applications of multiple linear regression in machine learning, focusing on Root Mean Square Error (RMSE) and k-fold cross-validation. You learned how RMSE measures model accuracy by quantifying the average prediction error, and how k-fold cross-validation helps evaluate model performance by dividing data into multiple folds to prevent overfitting. Additionally, you discussed the use of multiple linear regression as a predictive model in machine learning, emphasizing its ability to handle large datasets and provide accurate predictive analytics. Practical examples of applying multiple linear regression in machine learning included predicting the success of a new product launch using historical data.

Source: THIS TUTORIAL WAS AUTHORED BY SOPHIA LEARNING. PLEASE SEE OUR TERMS OF USE.

Terms to Know
Cross-Validation

Technique used in machine learning to evaluate how well a predictive model will perform on new, unseen data.

K-fold Cross-Validation

Method in which the data is divided into k equal parts, training the model on k-1 parts, and testing it on the remaining part, repeating this process k times to ensure robust model evaluation.