Table of Contents |
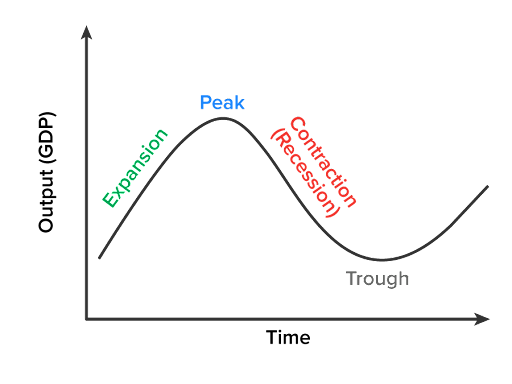
You have seen a business cycle before, and you know that it is common for the economy to go through periods of growth and contraction.
Along with this business cycle, most people are generally concerned about things like the unemployment rate and inflation—two of the most common concerns for consumers.
In this lesson, we will focus on inflation.
The Bureau of Labor Statistics, or BLS, measures the rate of inflation in our economy. Inflation refers to an increase in the overall price level.
This happens when many prices increase at the same time. Note that this is not just the price of gas going up or down in 1 week; it is an increase in the overall price level.
Inflation is measured from two different perspectives:
The CPI is the consumer price index, and this reflects the changing price for a fixed bucket of goods and services.
Economists use these price indexes, or measurements, which show how the average price of a standard group of goods changes over time. The most common one is the CPI.
So, it would be impossible to measure, in a timely manner, the price of absolutely everything in the economy. Therefore, the CPI uses a bundle of goods to represent the “market basket” purchased monthly by the typical urban consumer.
Here is an example of some of the categories in this market basket.
| Category | Examples |
|---|---|
| Food and drinks | Cereals, coffee, chicken, milk, and restaurant meals |
| Housing | Rent, homeowners’ costs, and fuel oil |
| Apparel and upkeep | Men’s shirts, women’s dresses, and jewelry |
| Transportation | Airfare, new and used cars, gasoline, and auto insurance |
| Medical care | Prescription medicines, eye care, and physicians’ services |
| Entertainment | Newspapers, toys, and musical instruments |
| Education and communication | Tuition, postage, telephone services, and computers |
| Other goods and services | Haircuts, cosmetics, and bank fees |
The goods and quantity consumed in this basket are held constant from one period to another.
The prices, however, are allowed to vary, and we use the prices that are currently seen in the market, known as nominal prices.
In June, the Consumer Price Index for All Urban Consumers rose 1.3 percent, seasonally adjusted, and rose 9.1 percent over the last 12 months, not seasonally adjusted. The index for all items less food and energy increased 0.7 percent in June (SA); up 5.9 percent over the year (NSA).
The PPI is the producer price index, which reflects the price movement for raw materials and intermediate and final good production. So, this is from the producers’ perspective.
The idea behind measuring the PPI is to see if there is one stage of the production process that is the cause for the price changes in the market.
Therefore, the PPI measures wholesale price changes in three different categories:
| Category | Description |
|---|---|
| Crude goods | The initial inputs in the production process of a good |
| Intermediate goods | Components used to make the end product |
| Finished goods | Goods that are produced and ready to be distributed/sold |
The Producer Price Index for final demand increased 1.1 percent in June. Prices for final demand goods rose 2.4 percent, and the index for final demand services advanced 0.4 percent. Final demand prices moved up 11.3 percent for the 12 months ended in June.
CPI and PPI are both used to measure price changes or inflation, just from different perspectives.
As mentioned, CPI is from the consumers’ perspective, and PPI is from that of the producers. We can calculate the inflation rate with either one, but let’s use the CPI here.
To calculate the inflation rate from one period to the next, we use the CPI or PPI in two different periods. Here, we do not list the actual years; we simply number each year.
So, CPI2 minus CPI1 divided by CPI1 will give us the rate of inflation:
Inflation rate = (CPI2 - CPI1) / CPI1
IN CONTEXT
Suppose the CPI in Year 1 was 100 and the CPI in Year 2 was 103. We calculate the change as follows: (103 − 100) / 100 = .03, or 3% inflation This shows that there was 3% inflation from CPI1 to CPI2.
The CPI and PPI are used as economic indicators in our economy.
Keep in mind that the PPI generally predicts what is going to happen then in the CPI, because it reflects what the producers are experiencing, who will likely adjust the prices accordingly later. Because this is a good predictor of what is going to happen in the CPI, the PPI is used extensively by investors—more so than the CPI.
The CPI is considered a lagging indicator, because it takes some time for prices to adjust to economic conditions:
Source: Adapted from Sophia instructor Kate Eskra.