Use Sophia to knock out your gen-ed requirements quickly and affordably. Learn more
×

Measures and Formulas for Examining Health Phenomena in Public Health

Author: Sophia

what's covered
In this lesson, you will learn more about how epidemiologists use data to inform prevention and intervention in public and community health. The focus of this lesson will be to understand the purpose and formulas around common methods of developing and utilizing statistics and data in public and community health. Specifically, this lesson will cover the following:

Table of Contents

1. Data Measurements in Epidemiology

Epidemiologists use several measures to assess associations and the relationship between exposures (risk factors) and health outcomes (such as diseases). These associations help us understand whether a specified health outcome is more likely in people with a particular exposure. An association suggests a link between the exposure and the outcome.

EXAMPLE

The relationship between exposure to a community picnic potato salad (risk factor) and getting food poisoning (health outcome/ disease) helps us understand whether food poisoning is more likely in people who ate the potato salad at the community picnic. An association suggests there may be a link between the two and is a starting point for further exploration of other possible risk factors (like the baked beans, coleslaw, or communal port-a-potties).

Associations serve as starting points for further exploration and research question generation in public health. In epidemiology, rates and ratios are essential measures used to understand the occurrence of diseases and conditions in a population. Rates express the frequency at which a disease or condition occurs within a population.

EXAMPLE

The rate of binge drinking in college-aged students or the rate of HIV in pregnant women

The common types of rates are prevalence and incidence rates. Earlier in this course, you learned about morbidity and mortality rates. Ratios compare different aspects of disease occurrence between two groups. They help quantify the relationship between exposure and disease.

EXAMPLE

A ratio often used in public health is the ratio of disease cases to deaths from that disease.

The common types of ratios include risk (or relative) ratio and odds ratio. While there are other rates and ratios outside the scope of this course, in this lesson, you will learn how to calculate these more common rates and ratios.

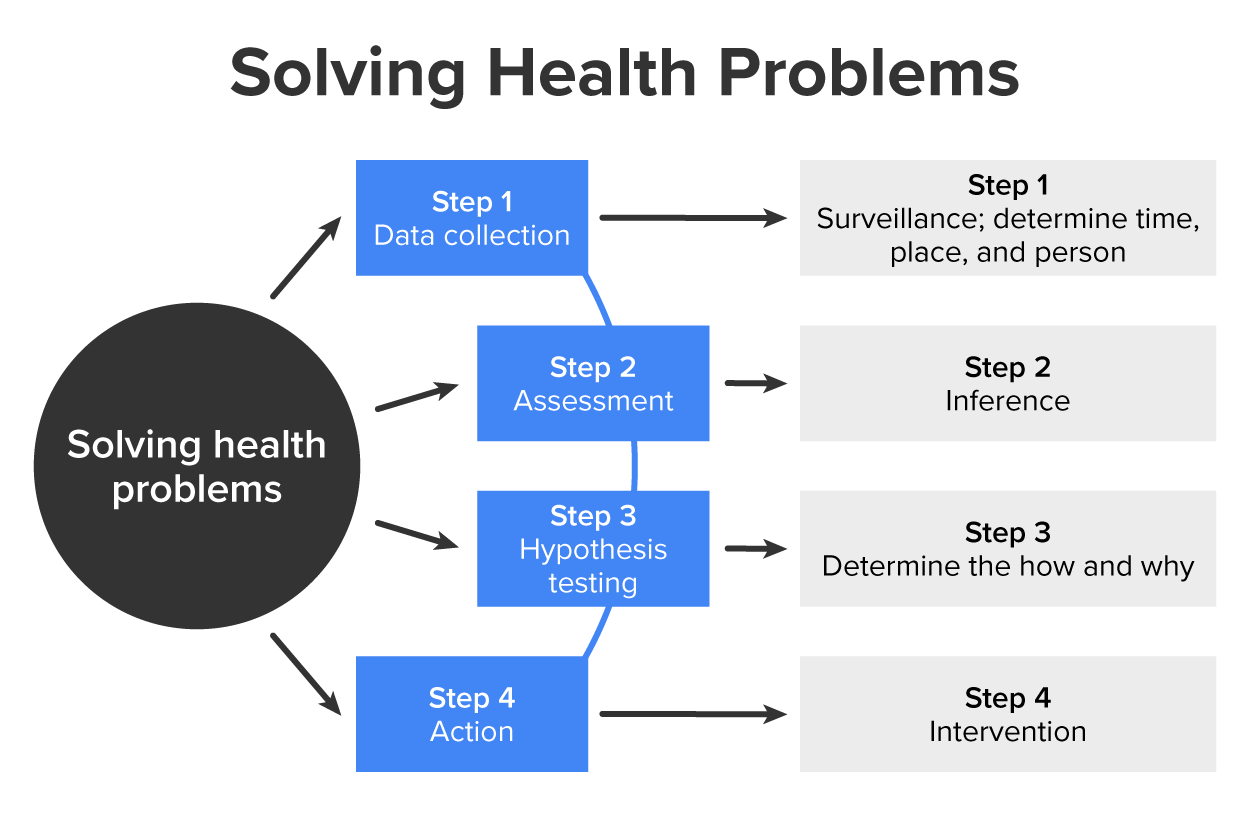
The image below illustrates the basic process an epidemiologist and public health professional would use to solve problems in public and community health.

step by step
  1. The first step involves data collection about health problems occurring among the population.
  2. Next, the epidemiologist establishes inferences from the data and draws initial conclusions.
  3. From there, they use the information to generate hypotheses about what might be causing the health problem.
  4. Then, the how and why of a condition are determined by conducting tests or studies to determine if the hypothesis is accurate. A hypothesis is a proposed explanation for a phenomenon or question. It attempts to explain a set of facts or observations in a unified way.
  5. Finally, epidemiologists and public health professionals act to prevent the condition from spreading or promote healthy behaviors. The epidemiologist recommends or implements some form of action at the population level.

terms to know
Rates
Measures that express the frequency at which a disease or condition occurs within a population.
Ratios
Compare different aspects of disease occurrence between two groups and help quantify the relationship between exposure and disease.
Hypothesis
A proposed explanation for a phenomenon or question. It attempts to explain a set of facts or observations in a unified way.

1a. Prevalence Rates

As mentioned earlier in this lesson, prevalence refers to the proportion of a particular population found to be affected by a medical condition (typically a disease or a risk factor) at a specific point in time. In other words, it refers to the number of cases of a disease, the number of infected people, or the number of people with some other attribute present during a specific period of time (Centers for Disease Control and Prevention [CDC], 2023). It is often expressed as a rate.

EXAMPLE

“The prevalence of diabetes per 100,000 people per year is . . .”

Prevalence helps epidemiologists understand the overall burden of a disease within a population. Prevalence does not, however, provide information on the risk of developing the condition.

formula to know
Prevalence rate

Prevalence space rate space equals open parentheses fraction numerator The space number space of space new space and space preexisting space cases space of space disease space during space the space same space time over denominator Population space size space during space the space same space time end fraction close parentheses space cross times 100 comma 000

Note: Sometimes, epidemiologists multiply the rate by 100,000 to compare rates across communities with different population sizes. They may also do this to see what the number of cases would be in a larger population.


try it
During 2001, 215 new cases of AIDS were reported in Grand River (a fictitious place!), a city of 500,000. This brought the total of active cases of AIDS to 2,280. During that time, 105 deaths were attributed to the disease.

Try to answer the question below, then click on the plus sign to see if you answered correctly.

1b. Incidence Rates

Incidence rates help public health professionals measure and understand the occurrence of new cases of a disease or other health event within a specific population over a defined period of time. This represents the frequency with which a disease or other incident (like injuries) occurs during a specific time interval.


formula to know
Incidence rate

Incidence space rate space equals fraction numerator The space number space of space n e w space cases space of space straight a space disease over denominator The space population space at space risk space during space the space same space period space end fraction

The result is typically expressed as a proportion or a rate per 1,000 or 100,000 individuals.


try it
During 2001, 215 new cases of AIDS were reported in Grand River (a fictitious place!), a city of 500,000. This brought the total of active cases of AIDS to 2,280. During that time, 105 deaths were attributed to the disease.

Try to answer the question below, then click on the plus sign to see if you answered correctly.


1c. Relative Risk

Another measure used by epidemiologists is relative risk (RR). RR compares the risk of an event occurring in a treatment group (or an exposed group) to the risk of the same event occurring in a control group (or a nonexposed group). For example, relative risk could be used to compare smokers (the exposed or treatment group) to nonsmokers (the nonexposed or control group). RR helps quantify how much more or less likely an outcome (let’s say lung cancer) is in the exposed group compared to the nonexposed group. Put another way, relative risk could determine the proportion (risk) of people in the smoking group who develop lung cancer and the proportion (risk) of people in the nonsmoking group who develop the same disease (CDC, 2024).

formula to know
RR

RR space equals fraction numerator Probability space of space the space event space in space the space treatment space group space left parenthesis smokers right parenthesis over denominator Probability space of space the space event space in space the space control space group space left parenthesis non smokers right parenthesis space end fraction


try it
If we investigate whether smoking affects the risk of developing lung cancer, we may find that 15% (convert this to a decimal) of those who smoke develop lung cancer. This, then, is the risk of developing lung cancer in smokers. Ten percent (convert this to a decimal) of people who do not smoke develop lung cancer, so this then is the risk of developing lung cancer in nonsmokers.

Try to answer the question below, then click on the plus sign to see if you answered correctly.


To interpret the results for calculating RR, epidemiologists use the following scale:

  • If the RR is less than 1, this means the outcome is less likely in the exposed group than in the nonexposed group.
  • If the RR is equal to 1, this means the outcome is equally likely in both groups.
  • If the RR is greater than 1, the outcome is more likely in the exposed group than in the nonexposed group.
In the smoking versus nonsmoking scenario, the RR highlights the substantial difference in the risk between the two groups. Smoking significantly increases the likelihood of developing lung cancer.

learn more
Visit Introduction to Epidemiology | Public Health 101 Series | CDC to find out more about calculations used in epidemiology.

These calculations do not show causality between the risk factors and outcomes of interest; further research and understanding would be needed to contribute to evidence of causal relationships.

watch
Calculating Prevalence, Incidence, and Relative Risk in Public Health


term to know
Relative Risk (RR)
A measure that compares the risk of an event occurring in a treatment group (an exposed group, e.g., smokers) to the risk of the same event occurring in a control group (a nonexposed group, e.g., nonsmokers).


summary
In this lesson, you learned about data measurements by epidemiologists and public health professionals. You learned they use data and calculations to make informed decisions to improve health outcomes and protect communities. You learned how to calculate several types of rates, including prevalence rates, incidence rates, and relative risk (RR). You learned that rates refer to measures that express the frequency at which a disease or condition occurs within a population. They help quantify the relationship between exposure and disease. You also learned that RR is a measure that compares the risk of an event occurring in a treatment group (an exposed group, e.g., smokers) to the risk of the same event occurring in a control group (a nonexposed group, e.g., nonsmokers).

Source: THIS TUTORIAL WAS AUTHORED BY SOPHIA LEARNING. PLEASE SEE OUR TERMS OF USE.

Disclaimer: The use of any CDC and United States government materials, including any links to the materials on the CDC or government websites, does not imply endorsement by the CDC or the United States government of us, our company, product, facility, service, or enterprise.

REFERENCES

Centers for Disease Control and Prevention. (2023, June 26). Prevalence. U.S. Department of Health and Human Services. www.cdc.gov/nchs/hus/sources-definitions/prevalence.htm

Centers for Disease Control and Prevention. (2024, February 16). Introduction to epidemiology. U.S. Department of Health and Human Services. www.cdc.gov/training-publichealth101/php/training/introduction-to-epidemiology.html?CDC_AAref_Val=https://www.cdc.gov/training/publichealth101/epidemiology.html

Attributions
Terms to Know
Hypothesis

A proposed explanation for a phenomenon or question. It attempts to explain a set of facts or observations in a unified way.

Rates

Measures that express the frequency at which a disease or condition occurs within a population.

Ratios

Compare different aspects of disease occurrence between two groups and help quantify the relationship between exposure and disease.

Relative Risk (RR)

A measure that compares the risk of an event occurring in a treatment group (an exposed group, e.g., smokers) to the risk of the same event occurring in a control group (a nonexposed group, e.g., nonsmokers).

Formulas to Know
Incidence Rate

Incidence space rate space equals space fraction numerator The space number space of space n e w space cases space of space straight a space disease over denominator The space population space at space risk space during space the space same space period end fraction

The result is typically expressed as a proportion or a rate per 1,000 or 100,000 individuals.

Prevalence Rate

Prevalence space rate space equals space open parentheses fraction numerator The space number space of space new space and space preexisting space cases space of space disease space during space the space same space time over denominator Population space size space during space the space same space time end fraction close parentheses cross times space 100 comma 000 space left parenthesis if space reporting space per space 100 comma 000 space in space straight a space population right parenthesis

Relative Risk (RR)

RR space equals space fraction numerator Probability space of space the space event space in space the space treatment space group over denominator Probability space of space the space event space in space the space control space group end fraction