Use Sophia to knock out your gen-ed requirements quickly and affordably. Learn more
×

Marketing Metrics and KPIs

Author: Sophia

what's covered

1. Marketing Metrics and Performance

Marketers plan their strategy for the 4 Ps, lead their teams to achieve high levels of brand awareness, organize resources to take action, and establish controls to monitor the progress of their plans. Marketing metrics are the variables that teams measure to determine the extent to which they have met their goals so that adjustments can be made to improve outcomes. There is a distinction between metrics and key performance indicators (KPIs): while metrics indicate the success of a function such as marketing, KPIs provide a high-level view of the company’s performance.

KPIs Metrics
All KPIs are Metrics All Metrics are not KPIs
KPIs give a holistic view of the performance of different functions in your organization Metrics give you a picture of how different individual activities rolled out within the functions are progressing
KPIs tell you where exactly your teams stand with respect to the overall business goals Individual Metrics do not give any insights on their own
Examples: Pre-sales KPIs, Email Marketing KPIs, Customer Success KPIs Examples: Open Rate, Conversions in the last 2 weeks, Deals lost last quarter

terms to know
Marketing Metrics
The variables that teams measure to determine the extent to which they have met their goals so that adjustments can be made to improve outcomes.
Key Performance Indicators (KPIs)
Provide a high-level view of the company’s performance.

1a. Common Marketing Metrics

The image below shows four levels of marketing metrics identified by Gartner Digital Markets, a leader in marketing analytics.

  • Tier 1 metrics are considered KPIs for a business because of the impact they have on the overall success or failure of the company. For example, revenues directly impact a company’s ability to cover its costs of doing business and expand into new markets.
  • Tier 2 metrics are the marketing variables that have the ability over the long-term to directly influence business outcomes and goals. For example, the customer lifetime value is the amount a buyer spends over their relationship with the company. In the short term, regular purchases add up, but over a decade, those revenues can result in a high volume of referrals to friends and family that stimulate new product lines.
  • Tier 3 metrics indicate outcomes of specific activities or operations in a business, such as success in reaching a specific target market with a campaign.
  • Tier 4 metrics are considered tactical and track one aspect of marketing performance. For example, the number of clicks indicates how many consumers clicked on a product or ad because they were interested in the features.

1b. Business Objective KPIs

Business objective KPIs indicate the overall health of the company. Three of the most common KPIs are profitability, total sales, and new sales revenue. Gross margin as a percentage of sales is one of the most closely watched KPIs at most organizations. Gross margin is the percentage of sales revenue that the company can convert into gross profit, and it’s generally a good measure of how efficiently the company generates gross profit from sales of products or services. Sales and revenue growth is a KPI that is used to determine whether sales and revenue are increasing or decreasing over a specified time.

key concept
New sales year over year indicates that a company is growing its customer base and expanding its audience reach.

terms to know
Business Objective KPIs
Indicate the overall health of the company.
Gross Margin
The percentage of sales revenue that the company can convert into gross profit, and it’s generally a good measure of how efficiently the company generates gross profit from sales of products or services.

1c. Sales/Revenue Generation KPIs

Sales and revenue generation KPIs measure the company’s ability to increase sales to customers, which increases the financial sustainability of a business.

key concept
Three of the most common KPIs in this category are average revenue per customer, new customer acquisition rates, and customer retention rates. Average revenue per customer (ARPC) measures the amount of money that a company expects to generate from an individual customer. The goal for every business is to increase this measure so that customers are loyal to a brand. New customer acquisition rate is the percentage of customers that are new, typically year over year, which measures the company’s ability to attract prospective customers through marketing, word of mouth, or channel partners. Customer retention rates measure the percent of customers that remain loyal to a company’s products, typically year over year. The greater the customer retention, the greater the opportunity to increase the amount customer purchases with a particular product or brand.

terms to know
Sales and Revenue Generation KPIs
Measure the company’s ability to increase sales to customers, which increases the financial sustainability of a business.
Average Revenue Per Customer (ARPC)
Measures the amount of money that a company expects to generate from an individual customer.
New Customer Acquisition Rate
The percentage of customers that are new, typically year over year, which measures the company’s ability to attract prospective customers through marketing, word of mouth, or channel partners.
Customer Retention Rates
Measure the percent of customers that remain loyal to a company’s products, typically year over year.

1d. Market Share KPIs

Market share KPIs indicate the competitiveness of a business. Market share as a KPI measures the percent of sales a company holds in a given market. Companies that are growing their market share are increasing their revenues faster than competitors in the product category and frequently increase their production, reduce the cost per unit of goods, and increase their overall profitability. Relative market share KPI measures the percent of sales of a company against its largest competitor, which suggests the amount of market influence a business has.

term to know
Market Share KPIs
Indicate the competitiveness of a business.

1e. Customer Support KPIs

Customer support KPIs indicate how well a company is able to satisfy customers, whether through delivering a quality product, resolving issues, or serving as a resource for non-product related concerns.

key concept
The three most common KPIs in this area are customer satisfaction score, customer resolution time, and customer resolution rate. Customer satisfaction score (CSAT) provides an overall indication of how well a company designs, prices, promotes, and distributes its offering to customers. An important factor in whether or not customers are satisfied with a company relates to how quickly and how fully it is able to resolve issues, regardless of the nature of the problem. Customer resolution time identifies how long it takes to resolve a concern, while customer resolution rate indicates what percent of the cases are resolved to customers’ satisfaction. Net promoter score (NPS) is a variation on the customer satisfaction score and asks buyers how likely they would be to promote the product or brand to a friend or family member, and customer resolution contributes to this score.

terms to know
Customer Support KPIs
Indicate how well a company is able to satisfy customers, whether through delivering a quality product, resolving issues, or serving as a resource for non-product related concerns.
Customer Satisfaction Score (CSAT)
Provides an overall indication of how well a company designs, prices, promotes, and distributes its offering to customers.
Customer Resolution Time
Identifies how long it takes to resolve a concern.
Customer Resolution Rate
Indicates what percent of the cases are resolved to customers’ satisfaction.
Net Promoter Score (NPS)
A variation on the customer satisfaction score and asks buyers how likely they would be to promote the product or brand to a friend or family member, and customer resolution contributes to this score.

1f. Using KPIs to Improve Performance

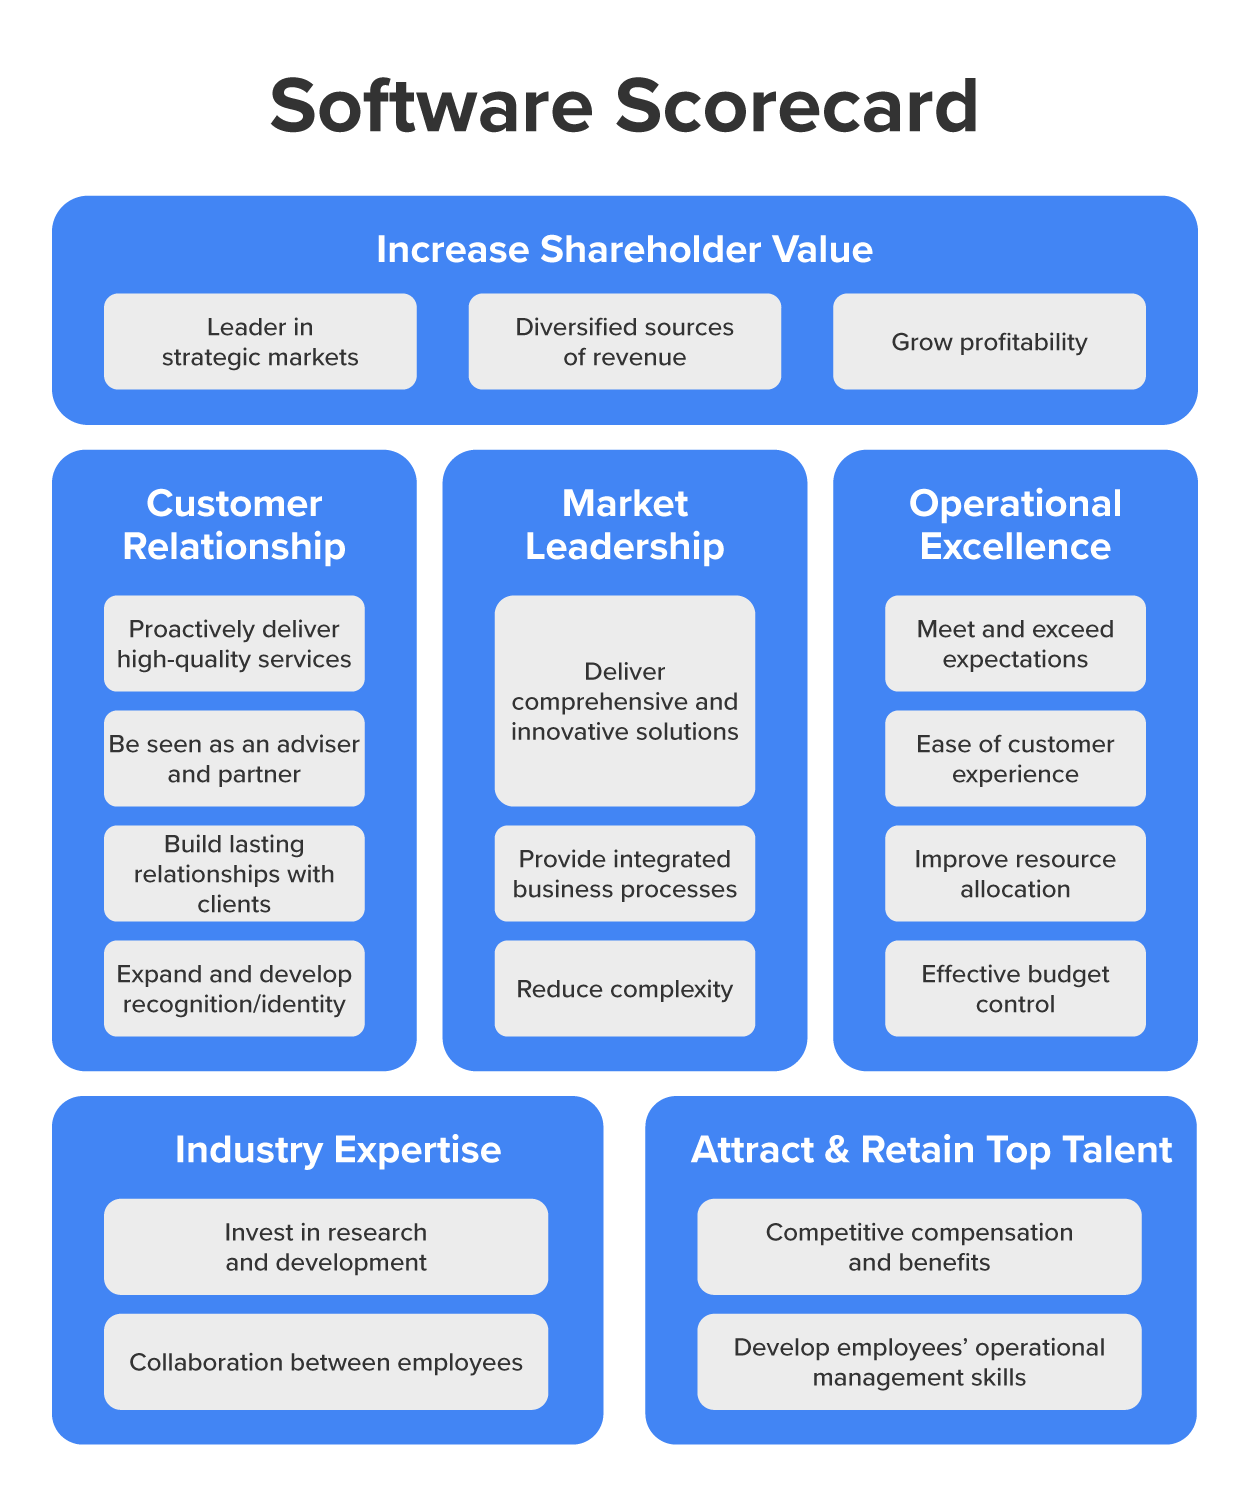
Companies identify those areas that are most critical to their success and measure their overall performance. A balanced scorecard is a popular approach to establishing KPIs that affect the business. KPIs can focus on financial, customer, market, human resources, and business processes that are most critical to the business. Once a company identifies which strategic priorities are most important to success, KPIs can be identified to measure those priorities, and data can be collected and analyzed on an ongoing basis to make decisions.

One example of a balanced scorecard for a software business is shown below. The business identified its strategic priorities as increasing shareholder value, improving customer relationships, securing market leadership, achieving operational excellence, leveraging industry expertise, and attracting and retaining top talent. The goals for each priority are shown in the white boxes. The next step for the company would be to identify which metrics would measure the degree to which the company is able to meet its priorities. For example, to increase shareholder value, the company would need to specify which metric would demonstrate profitability growth in a given time period. Metrics need to be SMART: specific, measurable, achievable, realistic, and time-defined.

term to know
Balanced Scorecard
A popular approach to establishing KPIs that affect the business.

1g. Benchmarking to Improve Performance

Benchmarking is an important concept in relation to KPIs and is applied when a company compares its performance to a standard. That standard can be based on the performance of a global competitor across product categories, or it can be based on the company’s previous successes. Marketers need to have a standard of performance against which they can measure their growth.

One study compared which of the top three soft drink brands generated the most media buzz for one month to determine which brand had the highest share of voice based on Twitter (now called X) and news sites. The report cited that Coca-Cola dominated the media over Pepsi and Red Bull 44% of the time. Does this matter? Not when you consider that the study is over a decade old. Standards are important, and they need to be recent and reflective of the current market. In a post-pandemic world, the media is even more fragmented than ever before, and it’s more challenging to determine the share of voice using X and new media.

big idea
Companies need to benchmark against standards that are recent, relevant, and based on the KPIs that will help them improve their own performance.

term to know
Benchmarking
An important concept in relation to KPIs and is applied when a company compares its performance to a standard.

summary
In this lesson, you learned about Marketing Metrics and Performance. There is a subtle difference between marketing metrics vs. KPIs: while metrics indicate the success of a function such as marketing, KPIs provide a high-level view of the company’s performance. Common marketing metrics can be categorized into business outcomes and goals, strategic performance areas, operational factors, and tactical levels. Business objective KPIs indicate the overall health of the company. Three of the most common KPIs are profitability, total sales, and new sales revenue. Sales and revenue generation KPIs measure the company’s ability to increase sales to customers, which increases the financial sustainability of a business. Market share KPIs indicate the competitiveness of a business. Customer support KPIs indicate how well a company can satisfy customers, whether through delivering a quality product, resolving issues, or serving as a resource for non-product related concerns. Using KPIs to improve performance requires identifying those areas that are most critical to success, which includes conducting benchmarking to improve performance.

Source: THIS TUTORIAL HAS BEEN ADAPTED FROM OPEN STAX’S PRINCIPLES OF MARKETING COURSE. ACCESS FOR FREE AT https://openstax.org/details/books/principles-marketing. LICENSE: CREATIVE COMMONS ATTRIBUTION 4.0 INTERNATIONAL.

REFERENCES

Hill, C. (2023). The Social Media Metrics to Track in 2023 (And Why). Retrieved from sproutsocial.com/insights/social-media-metrics/

Jain, A. (2023). Tracking Campaign Success with Demand Generation Metrics: A 3-Step Guide. Retrieved from www.gartner.com/en/digital-markets/insights/demand-generation-metrics

Kremers, B. (2013). Benchmarking the Share of Voice of Coca-Cola, Red Bull and Pepsi. Retrieved from www.buzztalkmonitor.com/blog/benchmarking-the-share-of-voice-of-coca-cola-red-bull-and-pepsi/

Lucco, J. (2023). Balanced Scorecard: The Comprehensive Guide. Retrieved from www.clearpointstrategy.com/blog/full-exhaustive-balanced-scorecard-example

Optimine. (2023). How to Measure Marketing Performance. Retrieved from optimine.com/how-to-measure-marketing-performance/

Terms to Know
Average Revenue Per Customer (ARPC)

Measures the amount of money that a company expects to generate from an individual customer.

Balanced Scorecard

A popular approach to establishing KPIs that affect the business.

Benchmarking

An important concept in relation to KPIs and is applied when a company compares its performance to a standard.

Business Objective KPIs

Indicate the overall health of the company.

Customer Resolution Rate

Indicates what percent of the cases are resolved to customers’ satisfaction.

Customer Resolution Time

Identifies how long it takes to resolve a concern

Customer Retention Rates

Measure the percent of customers that remain loyal to a company’s products, typically year over year.

Customer Satisfaction Score (CSAT)

Provides an overall indication of how well a company designs, prices, promotes, and distributes its offering to customers.

Customer Support KPIs

Indicate how well a company is able to satisfy customers, whether through delivering a quality product, resolving issues, or serving as a resource for non-product related concerns.

Gross Margin

The percentage of sales revenue that the company can convert into gross profit, and it’s generally a good measure of how efficiently the company generates gross profit from sales of products or services.

Key Performance Indicators (KPIs)

Provide a high-level view of the company’s performance.

Market Share KPIs

Indicate the competitiveness of a business.

Marketing Metrics

The variables that teams measure to determine the extent to which they have met their goals so that adjustments can be made to improve outcomes.

Net Promoter Score (NPS)

A variation on the customer satisfaction score and asks buyers how likely they would be to promote the product or brand to a friend or family member, and customer resolution contributes to this score.

New Customer Acquisition Rate

The percentage of customers that are new, typically year over year, which measures the company’s ability to attract prospective customers through marketing, word of mouth, or channel partners.

Sales and Revenue Generation KPIs

Measure the company’s ability to increase sales to customers, which increases the financial sustainability of a business.