Table of Contents |
Suppose that it’s springtime and you want to get outside more often. You decide a bike would be a great purchase. You can afford to spend up to $100 for a bike, but you'd like to pay less if possible.
There is a bike store in your neighborhood that builds bikes from kits in-house. The store would like to sell these bikes at prices that at least cover the cost, if not more.
You visit the store and find a variety of styles, models, and prices. After searching through the aisles, you settle on a model that costs $125—a bit more than you had budgeted. A salesperson approaches and asks if you have any questions. After explaining how perfect the bike that you selected is, you mentioned it’s more than you planned to spend. Your good-natured salesperson smiles and asks: “I haven’t seen you in here before. Are you new?” And you respond, “Yes! It’s been a long time since I’ve owned a bicycle.” At this, the salesperson mentions that the store offers a 15% discount policy for first-time buyers. You smile knowing that with the discount, the bike you want would cost $106.25, and you can make that work. And while the bike store will receive $18.75 less than the sale price, it has taken its first step towards making you a loyal customer.
When both parties to a transaction arrive at an agreed-upon price, then this price is known as an equilibrium price.
Economics borrows this word from physics, where equilibrium refers to the balance point between opposing forces–think of an old-fashioned scale, with the two opposing forces canceling each other out. In economics, equilibrium is the point at which the interests of consumers and producers are both met.
Let’s take a leap here and examine the concept of equilibrium in terms of markets. A $20 trillion dollar economy like that of the U.S. adds up to lots of successful transactions in a variety of markets involving hundreds of millions of people. Markets are composed of all the buyers and all the sellers of a specific product. Broadly speaking, there are buyers and sellers in the housing markets, flower markets, fruit markets, and eveningwear markets.
Having already examined individual demand and supply, the heavy lifting is done! We know what factors influence buyers’ willingness and ability to make purchases, as well as the factors that affect sellers’ willingness and ability to offer a good or service for sale.
Let’s return to the world of apples and merge the individual demand and supply schedules for apples. Combining the demand of all buyers and the supply of all sellers into one schedule creates a market schedule for apples. The price of apples is the same. The quantities, however, now represent thousands of apples rather than single units because many shoppers buy apples and many farmers grow apples.
The market schedule details the varying prices of apples (column 1), the respective quantity of apples (column 2) that suppliers are willing to offer, and the quantity of apples (column 3) that buyers are willing to purchase at each of the prices at this moment in time.
| Price of Apple | Quantity of Apples Supplied | Quantity of Apples Demanded |
|---|---|---|
| $2.00 | 7,000 | 0 |
| $1.75 | 6,000 | 1,000 |
| $1.50 | 5,000 | 1,500 |
| $1.25 | 4,000 | 2,000 |
| $1.00 | 3,000 | 3,000 |
| $0.75 | 2,000 | 4,000 |
| $0.50 | 1,000 | 5,000 |
| $0.25 | 0 | 6,000 |
First, note that the market schedule provides evidence of the law of demand and the law of supply at work. As the price falls from $2.00 to 0.25 (column 1), the quantity of apples supplied by farmers (column 2) also falls (law of supply), but the quantity of apples demanded by buyers (column 3) increases (law of demand). This is just as would be expected by people who understand economics.
Next, scan through columns 2 and 3. Is there any price at which the quantity supplied (which we can refer to by the shorthand of ( ) is equal to the quantity demanded (
 )?
)?
 ) is 3,000 apples.
 ) is 3,000 apples.
 ) is $1.00 per apple while the 3,000 apples is the equilibrium quantity (
 ).
).
The market clears only at one point (3,000 apples, $1.00 per apple) in the schedule. At any price higher than $1.00 per apple, suppliers bring more apples to market than buyers are willing to purchase. The quantity supplied is greater than the quantity demanded by buyers. The notation for this statement is  >
>  . At any price lower than $1.00 per apple, suppliers bring fewer apples to market than buyers want to purchase. The quantity demanded is greater than the quantity supplied by sellers. The notation for this statement is
  >
>  . Only at the equilibrium will you find both the equilibrium price and its associated equilibrium quantity.
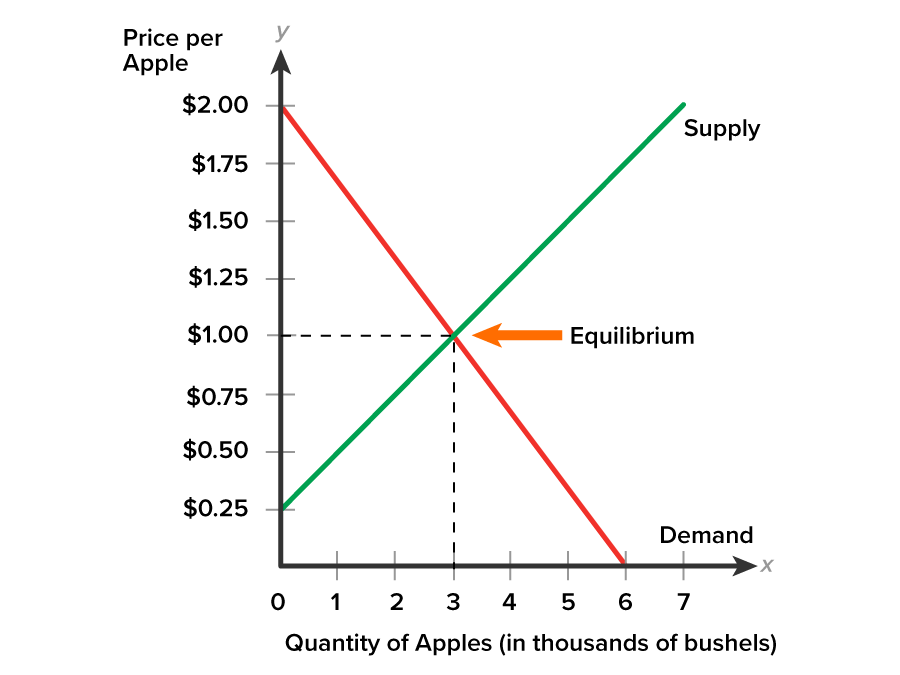
Using the price and quantity information from the market schedule we can plot a visual diagram of the market supply and demand curves. In the following diagram, notice that just as expected, the demand curve slopes downward and the supply curve slopes upward—reinforcing the law of demand and the law of supply.

To locate market equilibrium using a graph, look for the point where the supply and the demand curves cross. In the graph above, the equilibrium price is $1.00 per apple and the equilibrium quantity is 3,000 apples.
At all prices above $1.00 per apple, a gap occurs between the demand and supply curves. Buyers are less willing to purchase apples at a price above $1.00 per apple. At all prices below $1.00 per apple, a gap occurs between the supply and demand curves. Sellers are less willing to offer apples at a price below $1.00 per apple.
Whether you are looking at a market schedule or a typical supply and demand graph of a market, equilibrium only occurs at one point. At prices higher than equilibrium or lower than equilibrium buyers and sellers are not in agreement. The market does not clear because the quantity demanded and the quantity supplied are not in balance.
Now that we know how to find market equilibrium, let’s briefly discuss what happens when a market is not in equilibrium.
You have learned that markets have only one equilibrium price where the quantity demanded ( ) by buyers is equal to the quantity supplied (
 ) by sellers. If suppliers bring more of a product, like platinum, to the market than buyers are not willing to purchase, then the market will be out-of-equilibrium.
Returning to our apple market example, equilibrium is located at the point that the supply and demand curve cross. We determined that $1.00 per apple was the price that cleared the market of apples; 3,000 apples were bought and sold. The equilibrium price ( ) is $1.00 per apple. The equilibrium quantity (
 ) is 3,000 apples.
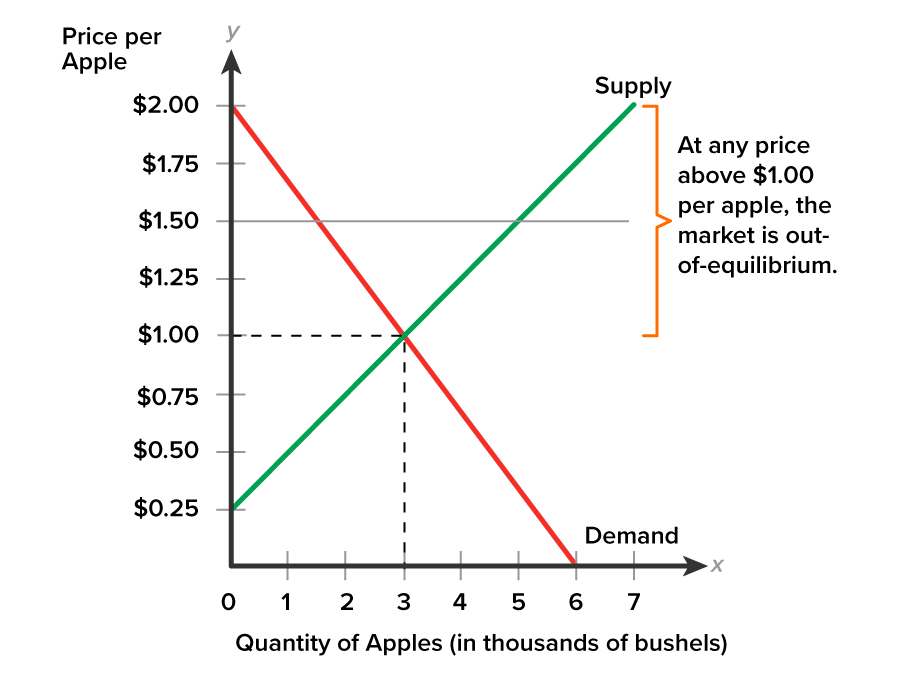
At any price above $1.00 per apple, the market is out-of-equilibrium as indicated by the bracket in the diagram.
Consider the following graph. Suppose that apple growers wanted to sell apples at $1.50 per apple. The horizontal line stretches from a price of $1.50 across the diagram and a gap exists between the demand curve and the supply curve.

The graph shows that at $1.50 per apple the quantity demanded by buyers is 2,000 apples, while the quantity supplied by sellers is 5,000 apples, a difference of 3,000 unbought apples. There’s a surplus of apples.
At any above-equilibrium price, the quantity supplied ( ) exceeds the quantity demanded (
 ). The notation for this statement is
  >
>  . When
  >
>  a surplus of the product exists or there is excess supply. Excess supply is the difference between the quantity supplied over the quantity demanded at an above-equilibrium price.
Markets don’t remain out-of-equilibrium for long. If the price is too high, and suppliers want to sell, then they have an incentive to lower the price. As the price begins to fall, buyers will begin to purchase a few more apples, but only at $1.00 per apple are buyers and sellers in agreement on price. The market clears when  =
=  and 3,000 apples are bought and sold at the equilibrium price.
Let’s consider the flip-side of a surplus market.
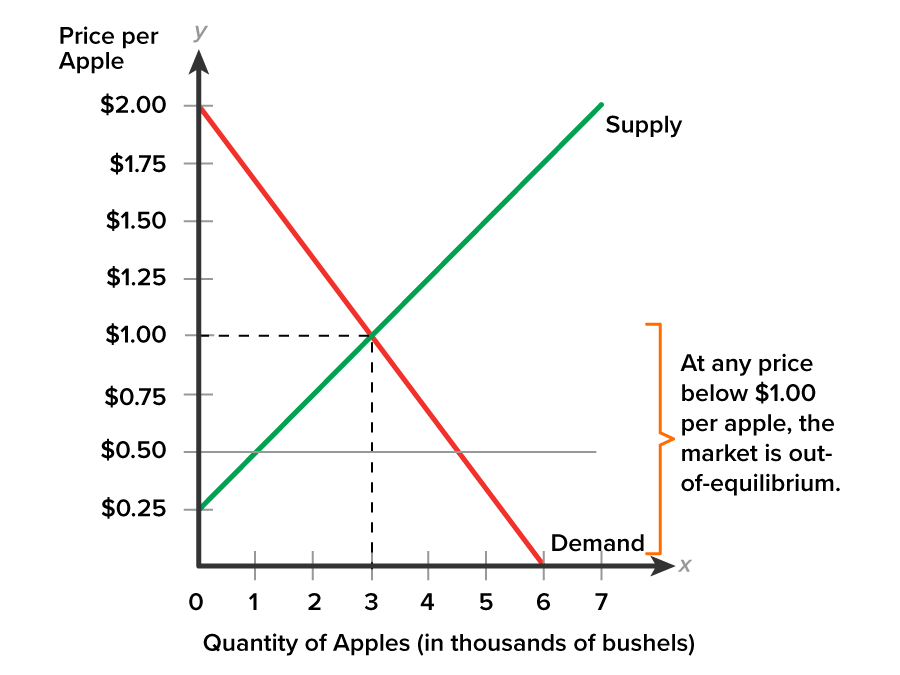
In this situation, if the price is less than $1.00 per apple, the market is out-of-equilibrium as indicated by the bracket in the diagram.
Consider the following graph. Suppose the price is $0.50 per apple. That would be quite a bargain for shoppers! At this price, the horizontal line stretches from a price of $0.50 across the diagram and a gap exists between the supply curve and demand curve.

The graph shows that buyers want to purchase 5,000 apples, while sellers only wish to sell 1,000. Some shoppers won’t be happy about this shortage situation.
When the price is below equilibrium, there is a shortage or excess demand—that is, at the given price the quantity demanded now exceeds the quantity supplied:  >
>  . Excess demand is the difference between the quantity demanded over the quantity supplied at a below-equilibrium price.
Again, markets don’t remain out-of-equilibrium for long. Shoppers competing with one another for the available stock of apples will express a willingness to pay a bit more—rather like bidding in an auction. As price begins to rise, suppliers will have an incentive to increase the number of apples for sale, but only at $1.00 per apple are buyers and sellers in agreement on price. The market clears when  =
=  and 3,000 apples are bought and sold at the equilibrium price (
 ).
).
In this manner, the market itself can establish an equilibrium where there is no longer a tendency for price to go up or down. At the point of equilibrium, buyer and seller interests are in harmony.
Why are we so interested in equilibrium? Because demand represents the consumers’ interests. Supply represents the producers' interests. When the two interests are in harmony, society is made better off. The next lesson will explain why.
Source: THIS TUTORIAL HAS BEEN ADAPTED FROM OPENSTAX “PRINCIPLES OF ECONOMICS 2E”. ACCESS FOR FREE AT https://openstax.org/books/principles-economics-2e/pages/1-introduction. LICENSE: CC ATTRIBUTION 4.0 INTERNATIONAL.