Use Sophia to knock out your gen-ed requirements quickly and affordably. Learn more
×

Managing Network Documentation

Author: Sophia
what's covered
This lesson explains some of the most common types of network documentation and their importance, as well as some tools you can use to gather the information you will document.

Specifically, this lesson will cover the following:

Table of Contents

1. Documentation Forms

Documentation is not most network administrators’ favorite task. It just isn’t as exciting as learning about the coolest new technology or tackling and solving a challenging problem. You might think that you know your networks well enough since you personally installed and configured them. If something goes wrong, it should be easy to figure out and fix, right? And most of the time you can do that—at least on a small network.

But as networks get bigger and more complex, it gets harder and harder to remember it all. When multiple people work on a network, you need a way of keeping everyone informed about the changes and fixes made on a daily basis—and word-of-mouth isn’t adequate. In addition, network documentation is an integral part of the service you provide for clients. They are paying you for solid documentation to refer to after you’ve left the scene.

It’s a good idea to keep documentation safe in at least the following three forms:

  • An electronic copy that you can easily modify after configuration changes
  • A hard copy in a binder of some sort, stored in an easily accessible location
  • A copy on an external drive to keep in a really safe place (even off-site) in case something happens to the other two or the building or part of it burns to the ground
key concept
Why the hard copy? Well, what if the computer storing the electronic copy totally crashes and burns at exactly the same time a major crisis develops? Good thing you have that paper documentation on hand for reference! Plus, sometimes you’ll be troubleshooting on the run—maybe literally, as in running down the hall to the disaster’s origin. Having that binder containing key configuration information on board could save you a lot of time and trouble, and it’s also handy for making notes to yourself as you troubleshoot.

Depending on the size of the intranet and the number of people staffing the IT department, it might be smart to have several hard copies. Just always make sure they’re only checked out by staff who are cleared to have them and that they’re all returned to a secure location at the end of each shift. You definitely don’t want that information in the wrong hands!

Next, let’s take a look into the different types you need on hand so you can learn how to assemble them.


2. Schematics and Diagrams

If something isn’t working between point A and point B, a solid diagram of the network that precisely describes exactly what exists between point A and point B can totally save the day. Network diagrams also come in handy when you need to extend your network and you want a clear picture of how the expanded version will look and work. Will the new addition cause one part of the network to become bogged down while another remains underutilized? You get the idea.

2a. Documentation Formats

Diagrams can be simple sketches created while brainstorming or troubleshooting on the fly. They can also be highly detailed, refined illustrations created with some of the snappy software packages around today, like Microsoft Visio, SmartDraw, and a host of computer-aided design (CAD) programs. Some of the more complex varieties, especially CAD programs, are super pricey.

key concept
Whichever tool you use to draw pictures about your networks, they basically fall into the following groups:
  • Wiring diagrams/schematics
  • Physical network diagrams
  • Logical network diagrams
  • Asset management
  • IP address utilization
  • Vendor documentation

2b. Wiring Diagrams

A wired network’s skeleton is made up of cabled physical media like coax, fiber, and twisted pair. Surprisingly, it is the latter—specifically, unshielded twisted pair (UTP)—that screams to be pictured in a diagram. That’s because the different wire colors must be in specific places in a connector, and there are different wiring standards that use different arrangements.

A side-by-side comparison of an RJ-45 connector and RJ-45 cable based on wiring standards. Both the connector and the cable have eight colored wiring pins, numbered from 1 to 8. Each wire is color-coded to depict the distinctions between various pinout configurations used in networking. The wires’ color sequence for both devices is as follows: The RJ-45 cable on the right is colored brown, white/brown, green, white/blue, blue, white and green, orange, and white and orange from left to right. ‘As seen from the top RJ-45 cable’ is mentioned below the wiring pins. The color of all the pins changes to gray as the pins rise and are numbered from 1 to 8 at the top. The RJ-45 connector on the left is colored white/orange, orange, white/green, blue, white and blue, green, white and brown, and brown from left to right. ‘RJ-45 connector as seen from the tent’ is mentioned above the wiring pins. The color of all the pins changes to gray as the pins move downward and are numbered from 1 to 8 at the bottom.

An RJ-45 cable configured with the T568B wiring standard. The cable has eight colored wiring pins, numbered from 1 to 8. The color sequence from Pins 1 to 8 is as follows: white and orange, orange, white and green, blue, white and blue, green, white and brown, and brown. The pins are connected to a square plate behind the wiring pins such that the pins extend out of the square plate from the bottom.

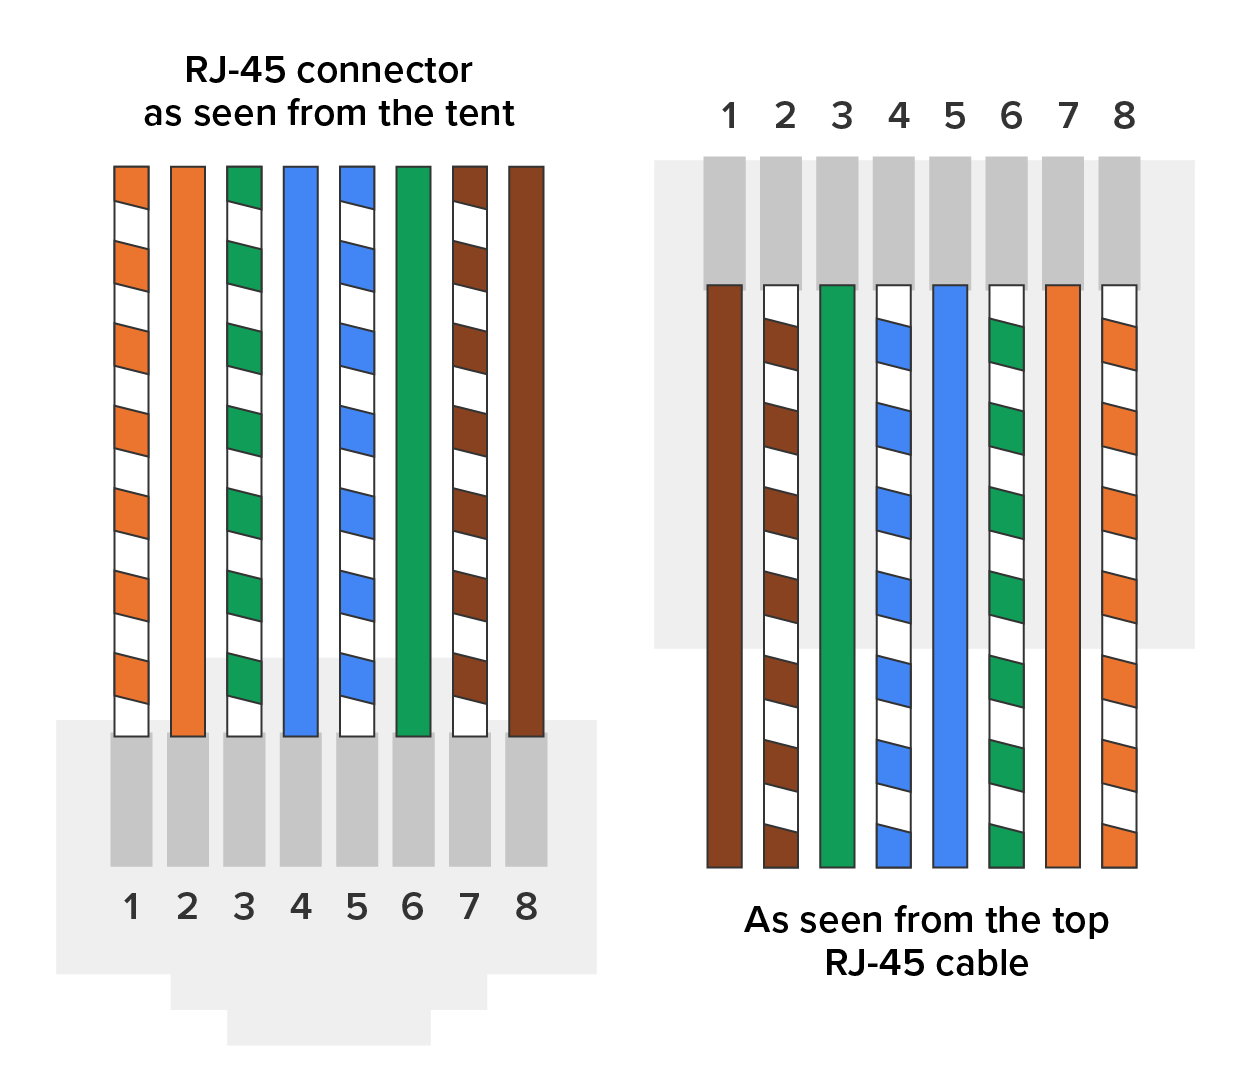
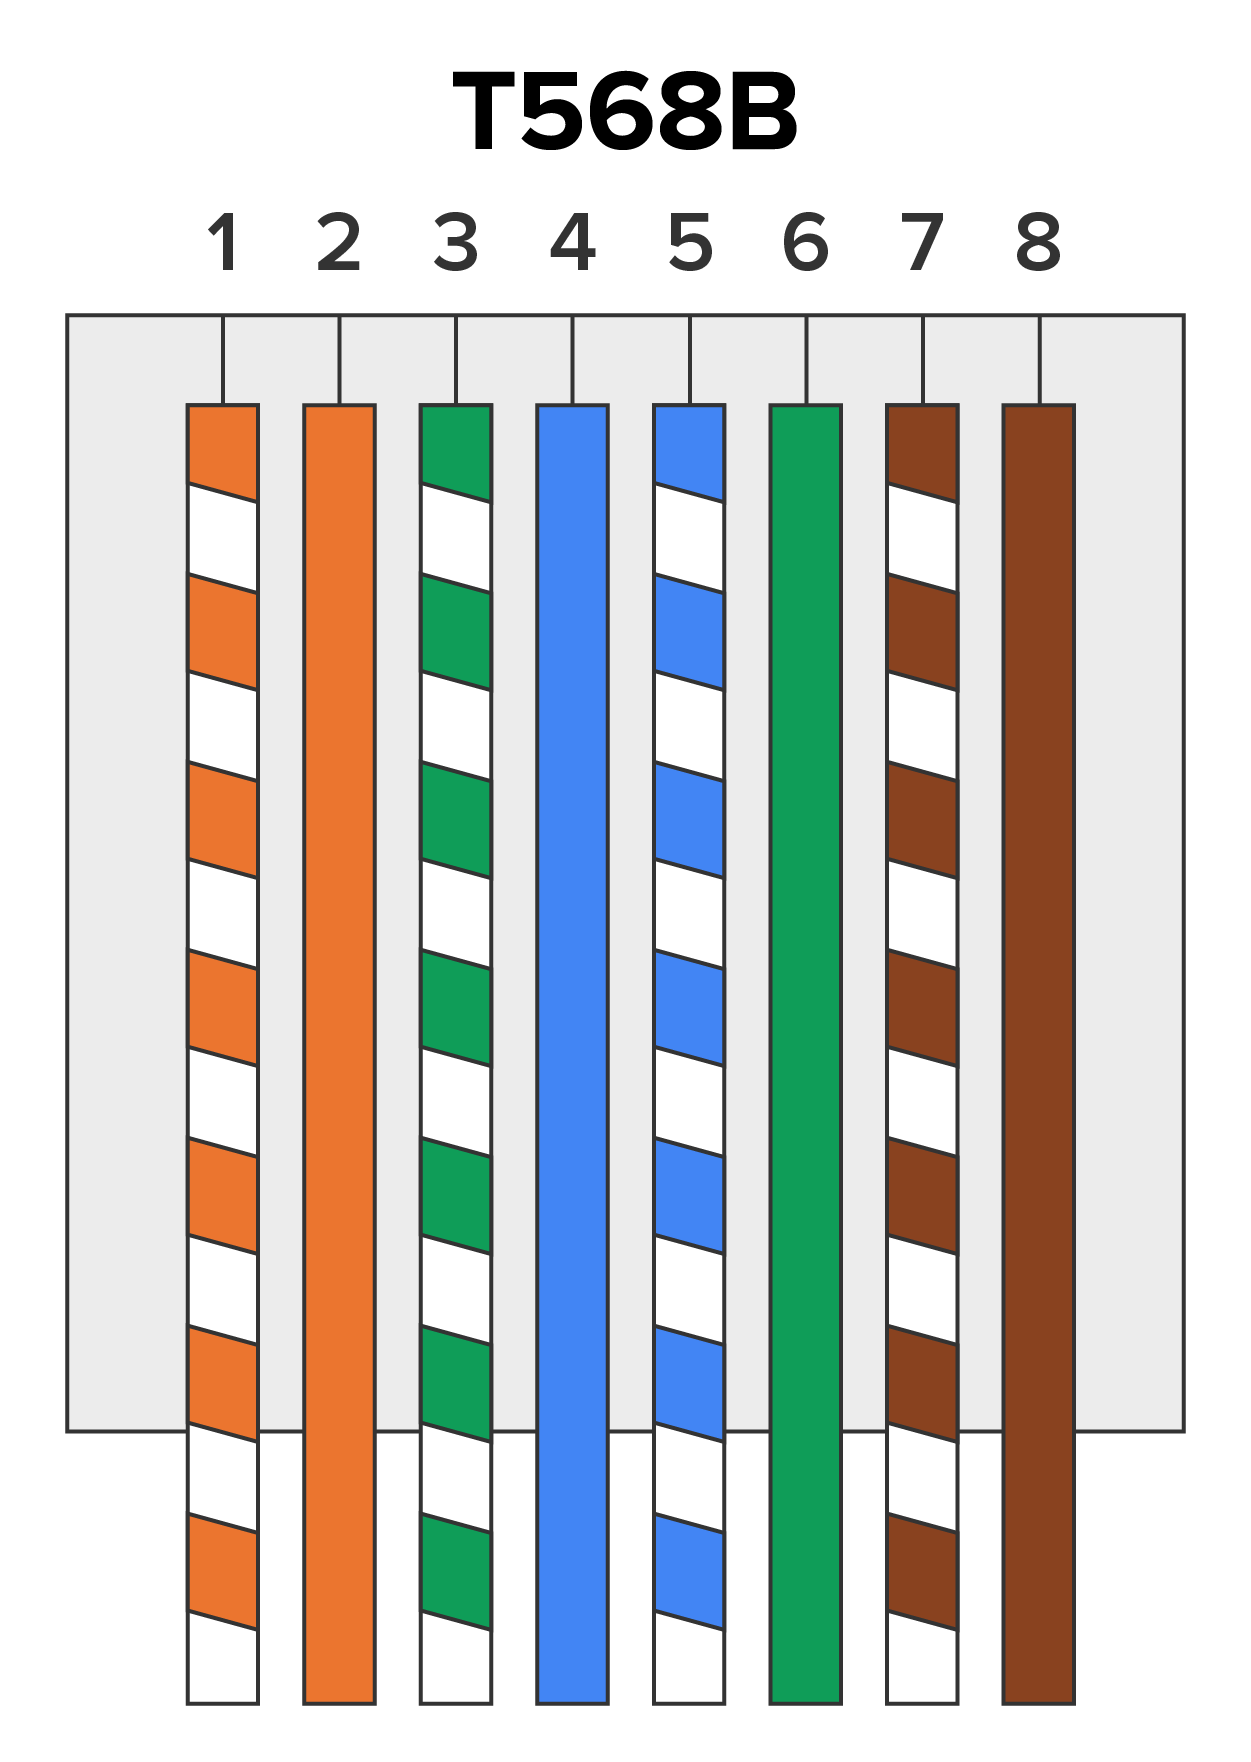
This wiring diagram shows that pin 1 is on the left and pin 8 is on the right, so clearly, within your UTP cable, you need to make sure the right wires get to the right pins. No worries if you got your cables premade from the store, but making them yourself not only saves you a bunch of money, it enables you to customize cable lengths, which is really important!

key concept
The following table matches the colors for the wire associated with each pin, based on the Electronic Industries Association and the Telecommunications Industry Alliance (EIA/TIA) 568B wiring standard. In your actual documentation you wouldn’t need this table; you could just specify T568B.
Pin Color
1 White/Orange
2 Orange
3 White/Green
4 Blue
5 White/Blue
6 Green
7 White/Brown
8 Brown


As you learned earlier in the course, standard drop cables (a.k.a. patch cables or straight-through cables) have the pins in the same order on both connectors. Crossover cables, on the other hand, have certain wires flipped in position (but not all wires). Specifically, pins 1 and 3 and pins 2 and 6 get switched to ensure that the send port from one computer’s network interface card (NIC) gets attached to the receive port on the other computer’s NIC. The following figure shows what this looks like.


A U-shaped crossover thick cable, with two ends, each featuring eight wiring pins at the open terminals. The pins are color-coded and are colored solid black at the upper terminals. The pins are numbered 1 to 8 from left to right. The pins and their respective colors on both ends are as follows: Left End: 1) Pin 1: Orange and White, 2) Pin 2: Orange, 3) Pin 3: Green and White, 4) Pin 4: Blue, 5) Pin 5: Blue and White, 6) Pin 6: Green, 7) Pin 7: Brown and White, 8) Pin 8: Brown. Right End: 1) Pin 1: Green and White, 2) Pin 2: Green, 3) Pin 3: Orange and White, 4) Pin 4: Blue, 5) Pin 5: Blue and White, 6) Pin 6: Orange, 7) Pin 7: Brown and White, 8) Pin 8: Brown. In between the U shape, the following is mentioned: 1 to 3, 2 to 6, 3 to 1, 4 to 4, 5 to 5, 6 to 2, 7 to 7, 8 to 8. The following pins between the two ends are the same: 1 and 3, 2 and 6, 3 and 1, 4 and 4, 5 and 5, 6 and 2, 7 and 7, and 8 and 8.

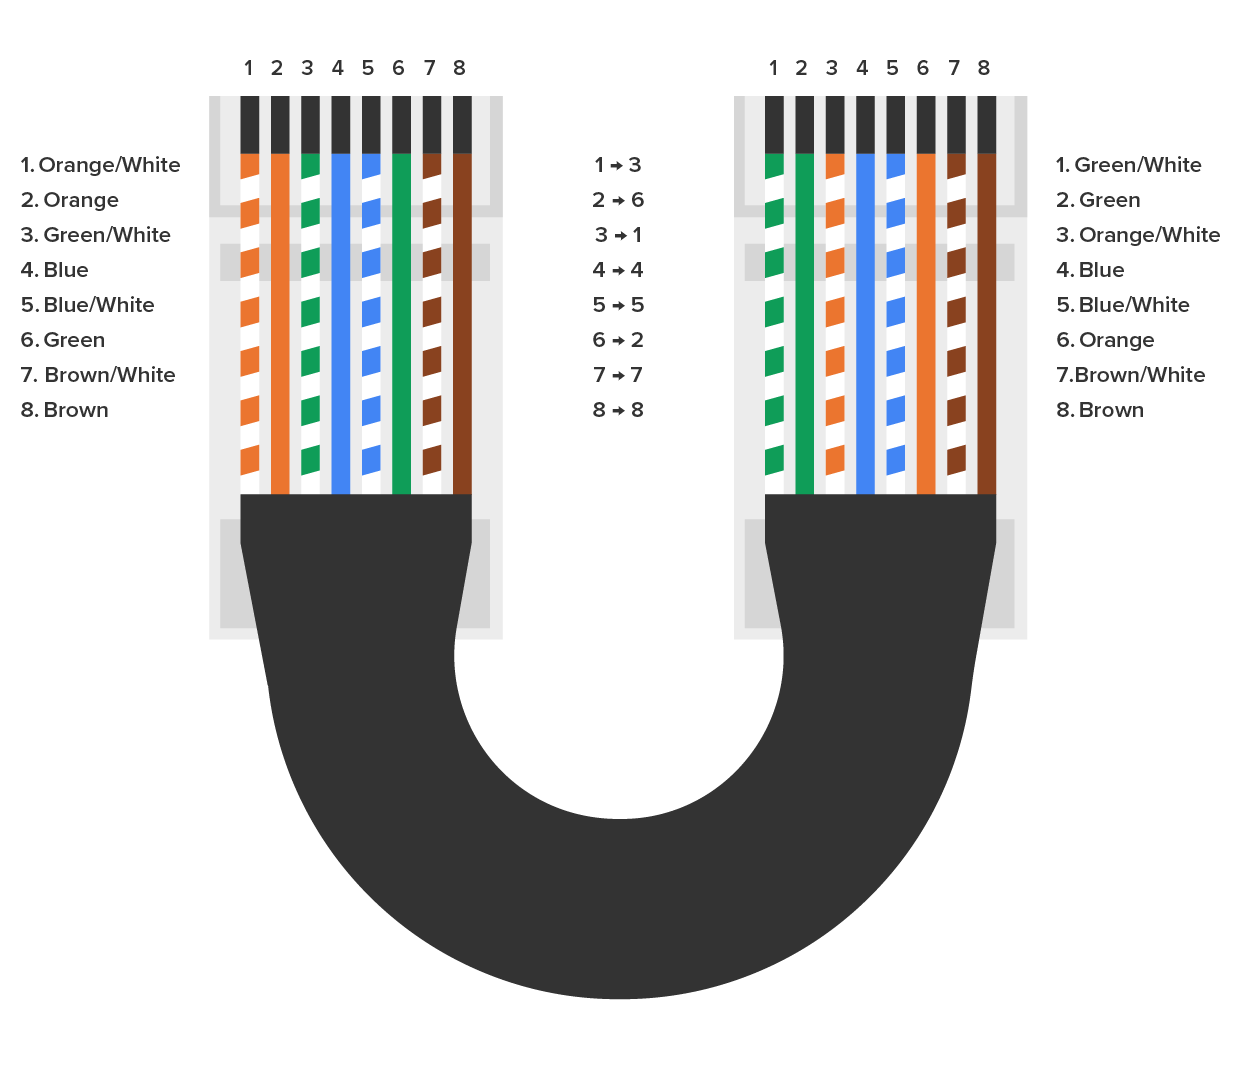
It gets more complicated, though. The crossover cable wiring shown above works for connections up to 100BaseTX. If you are using 1000BaseT4, all four pairs of wires get crossed at the opposite end, meaning pins 4 and 7 and pins 5 and 8 get crossed as well. And to complicate matters even further, the Automatic MDI/MDIx Configuration standard, which is an optional feature of the 1000BaseT standard, eliminates the need for crossover cables between gigabit-capable interfaces.

This is where having a diagram is golden. Let’s say you’re troubleshooting a network and discover connectivity problems between two hosts. Because you’ve got the map, you know the cable running between them is brand new and custom made. This should tell you to go directly to that new cable because it’s likely it was poorly made and is therefore causing the snag.

hint
After adding a new cable segment on your network, you need to update the wiring schematics.

Another reason it’s so important to diagram all things wiring is that all wires have to plug into something somewhere, and it’s really good to know what and where that is. Whether it’s into a switch, a router, a workstation, or the wall, you positively need to know the who, what, where, when, and how of the way the wiring is attached.

It follows, then, that a wiring schematic should include the names of devices that the wires are connecting. If you want to be specific, you can’t just say, “You know that router in the rack?” This is why coming up with a good naming system for all the devices living in your racks will be invaluable for ensuring that your wires don’t get crossed. And each device should have a physical label or tag on it with its name as well.

hint
In addition to labeling the devices, you should label both ends of your cables, too. If something happens (earthquake, tsunami, temper tantrum, even repairs) and more than one cable gets unplugged at the same time, it can get really messy scrambling to reconnect them from memory—fast!

term to know
Wiring Diagram
A diagram that shows the paths of the wires used in a network.

2c. Physical Network Diagrams

A physical network diagram contains all the physical devices and connectivity paths on your network and should accurately show how your network physically fits together in glorious detail. Ideally, your network diagram should list and map everything you would need to completely rebuild your network from scratch if you had to. This is actually what this type of diagram is designed for. But there’s still another physical network diagram variety that includes the firmware revision on all the switches and access points in your network. Remember, besides having your physical network accurately detailed, you must also clearly understand the connections, types of hardware, and their firmware revisions. You will be so happy you have this documentation when troubleshooting! It will prevent much suffering and enable you to fix whatever the problem is so much faster!

key concept
Naming your network devices is no big deal, but for some reason, coming up with systems for naming devices and numbering connections can really stress people out. Let’s say your network has two racks of switches, creatively named Block A and Block B. (This may sound like a prison, but it’s just to keep things simple for this example. In the real world, you can come up with whatever naming system works for you.) You can use the letters FETH for Fast Ethernet, and because each rack has six switches, you can number them 1 through 6. Because we read from left to right in the West, it’s intuitive to number the ports on each switch that way, too, but again, do what works best for you.

Having a solid naming system makes things so much more efficient—even if it’s a bit of a hassle to create. For instance, if you were the system administrator in this example and suddenly all the computers connected to FETHB-3 couldn’t access any network resources, you would have a pretty good idea of where to look first, right?

If you can’t diagram everything for some reason, at least make sure all network devices are listed. Physical network diagrams can run from simple, hand-drawn models to insanely complex monsters created by software packages like SmartDraw, Visio, and AutoCAD. Here’s an example of a simple diagram that most people could draw (or at least approximate) by hand.

A simple network setup consists of several components connected by lines: An internet icon labeled ‘Internet’ is connected to a disk-shaped router with bidirectional crossed arrows on it and is labeled ‘Router’. The router is connected to a network device labeled ‘Switch 1’. Switch 1 is connected to another network device labeled ‘Switch 2’ and three servers labeled as follows: 1) Server 1: Login, 2) Server 2: Files, 3) Server 3: Mail. These three servers are placed horizontally next to each other. Both switches feature bidirectional arrows, indicating data transmission in both directions. To the right of the servers are a stack of computers labeled ‘19 workstations’ and two vertically placed printers labeled ‘2 printers’.

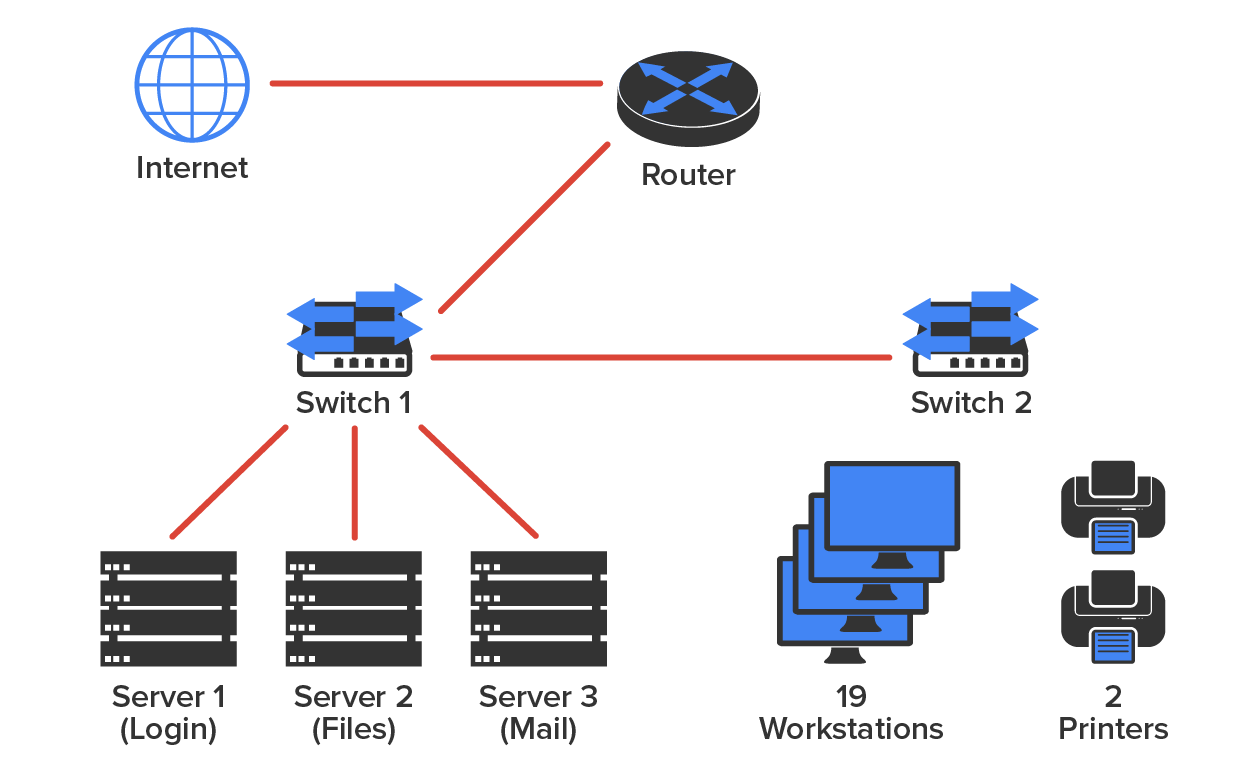
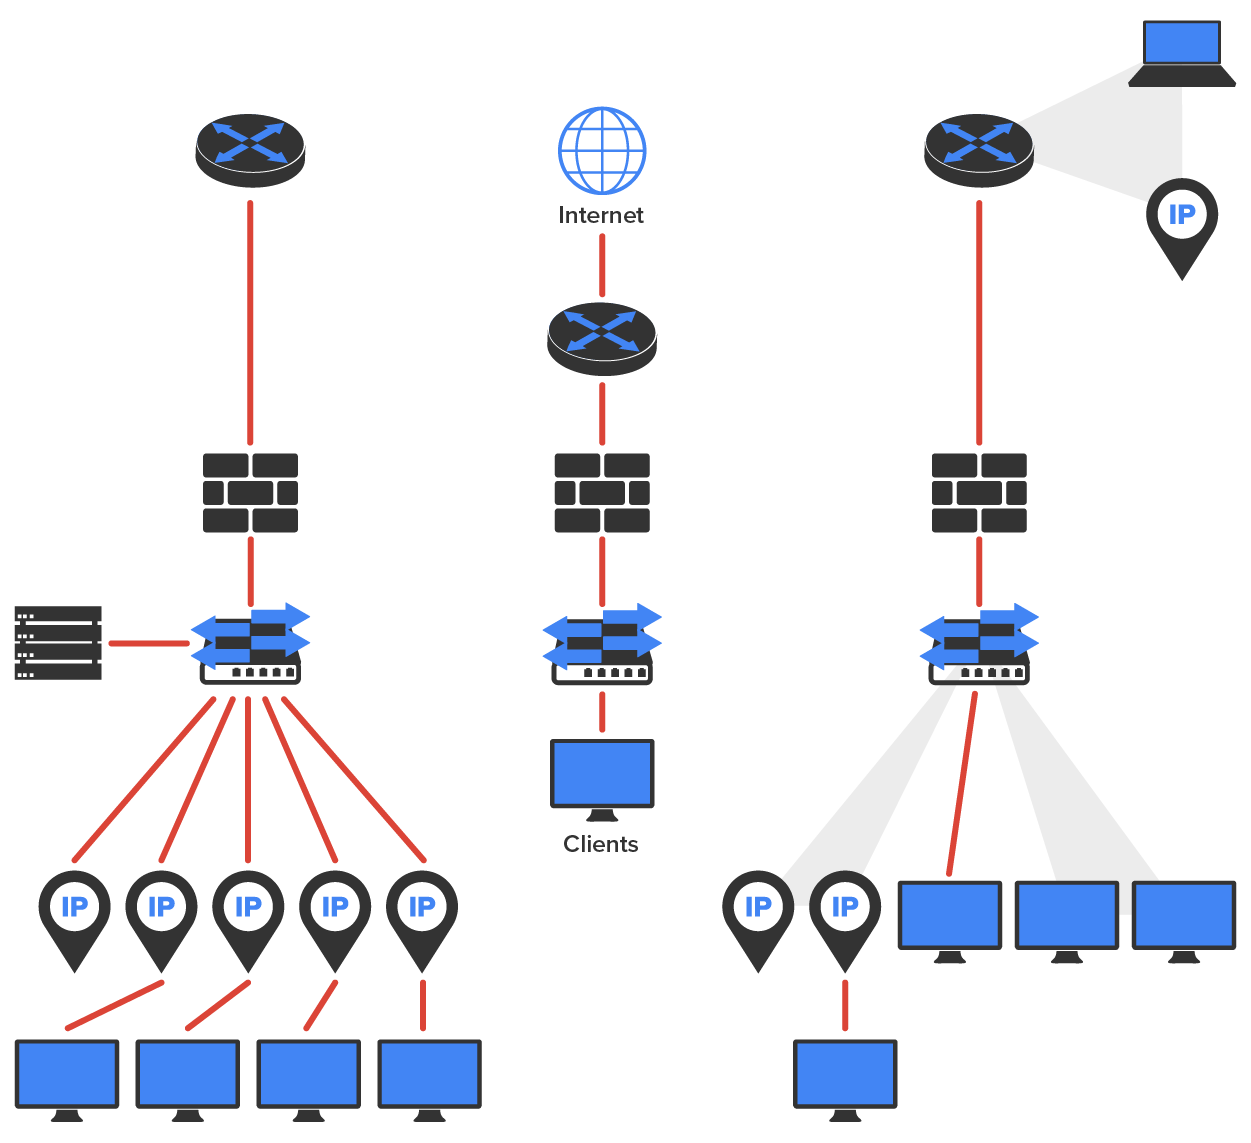
If you are artistically impaired, or if you just want flashier diagrams, check out the following diagram, which illustrates a more complex network, created in an app called SmartDraw (www.smartdraw.com). Microsoft Visio is another good choice for creating diagrams.

A complex network setup depicting connections between various devices and components across three distinct network configurations. Setup 1: A router is connected to a firewall. The firewall is linked to a network device, which features bidirectional arrows. The network device is connected to a server on the left and five I P icons below. Four of the I P icons from right to left are connected to four monitors. Setup 2: An internet icon labeled ‘Internet’ is connected to another router. The second router is connected to a firewall. The firewall is linked to a network device with bidirectional arrows. The network device is connected to a monitor labeled ‘Clients’. Setup 3: The third router is connected to a firewall vertically downward. A ray emanates from the third router, on the top right-hand side, focusing on a laptop and an I P icon. The firewall is connected to a network device featuring bidirectional arrows. The network device is connected to a monitor. A ray spans out from the network device, focusing on two additional monitors. Another ray emanates from the same network device, directed toward two I P icons. The I P icon to the right is connected to a monitor.

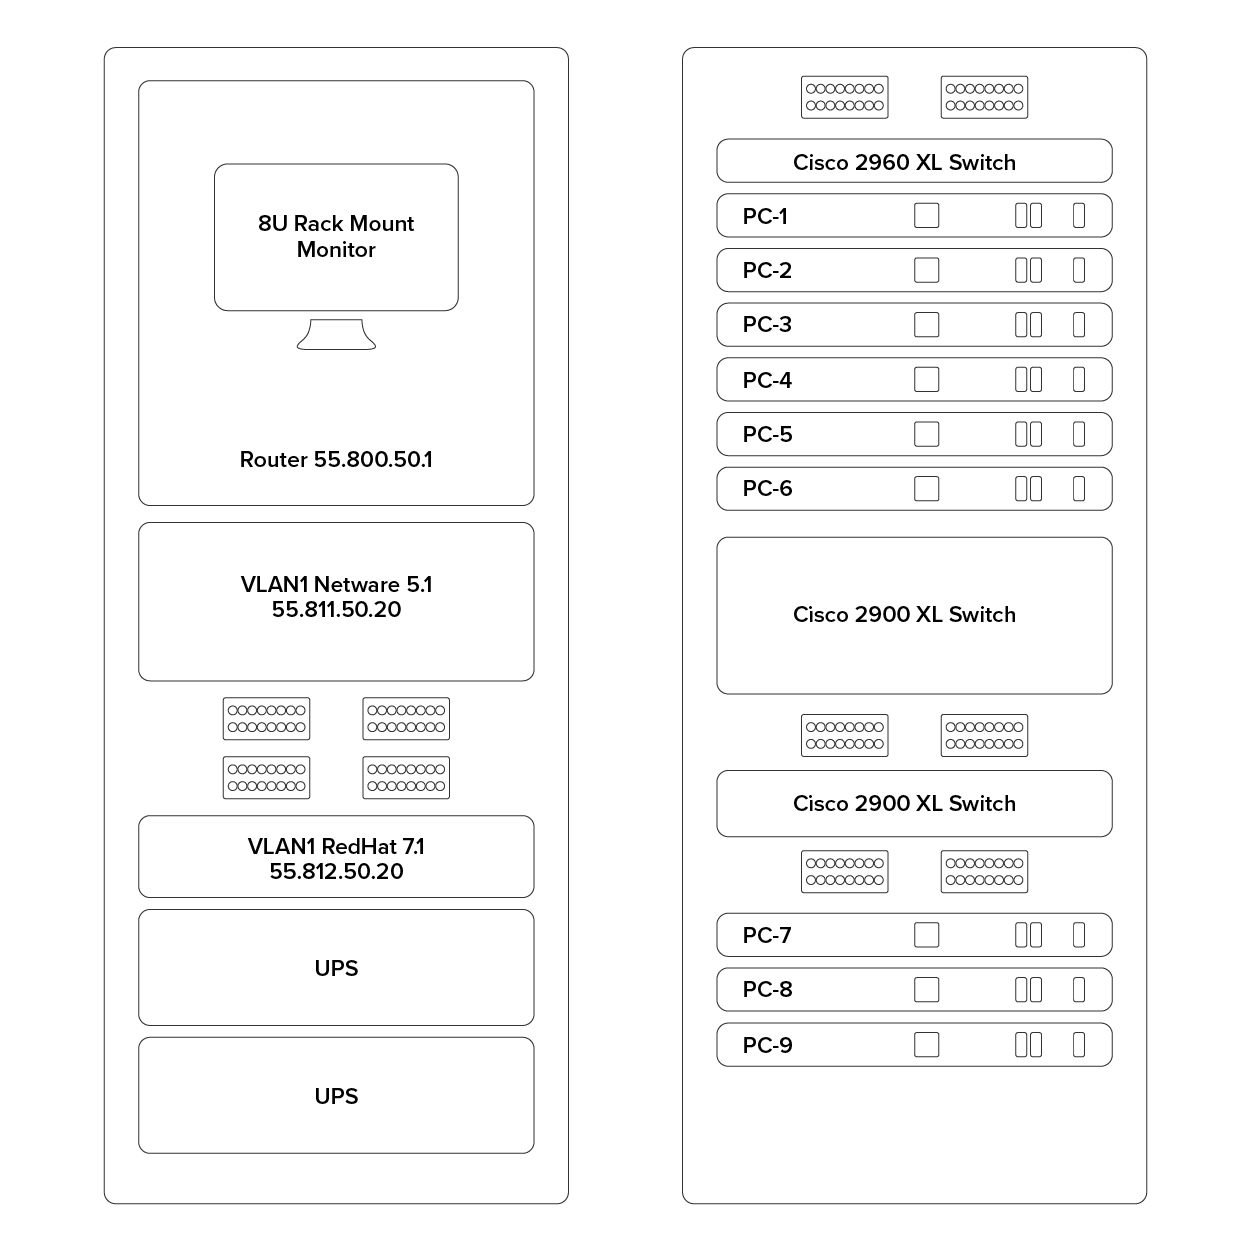
You may also want to diagram each hardware rack, as in the figure shown below.

Two vertical rectangles are positioned side by side, depicting hardware racks within each. First Rectangle: A rack containing a monitor is labeled ‘8U Rack Mount Monitor’. Below the monitor, ‘Router 55.800.50.1’ is specified. The next rack is designated as ‘V LAN1 Netware 5.1’ with the I P address ‘55.811.50.20’. This is followed by four ports arranged in two sets. The subsequent rack below is identified as ‘V LAN1 RedHat 7.1’ with the I P address ‘55.812.50.20’. The final two racks are labeled ‘U P S’. Second Rectangle: At the top, two ports are positioned side by side. Below the ports, a rack is labeled ‘Cisco 2960 XL Switch’. Following this, there are six racks labeled PC-1 to PC-6. Each of these racks features a square box, a paired vertical rectangular box, and a single vertical rectangular box, arranged from left to right. The next rack is labeled ‘Cisco 2900 XL Switch’. Two ports are placed side by side below the rack with the switch. Again, the next rack is labeled ‘Cisco 2900 XL Switch’, and two ports are placed side by side below this switch. Next, three additional racks are labeled PC-7, PC-8, and PC-9, each containing a square box, a paired rectangular box, and a single rectangular box, arranged from left to right.

Don’t forget to mirror any changes you make to your actual network in the network’s diagram. Think of it like an updated snapshot. If you give the authorities your college buddy’s baby picture after he goes missing, will that really help people recognize him as well as if you gave them one taken just before he disappeared? Because they don’t make age progression software for networks, it’s smart to just keep things up-to-date.

term to know
Physical Network Diagram
A diagram that contains all the physical devices and connectivity paths on your network.

2d. Logical Network Diagrams

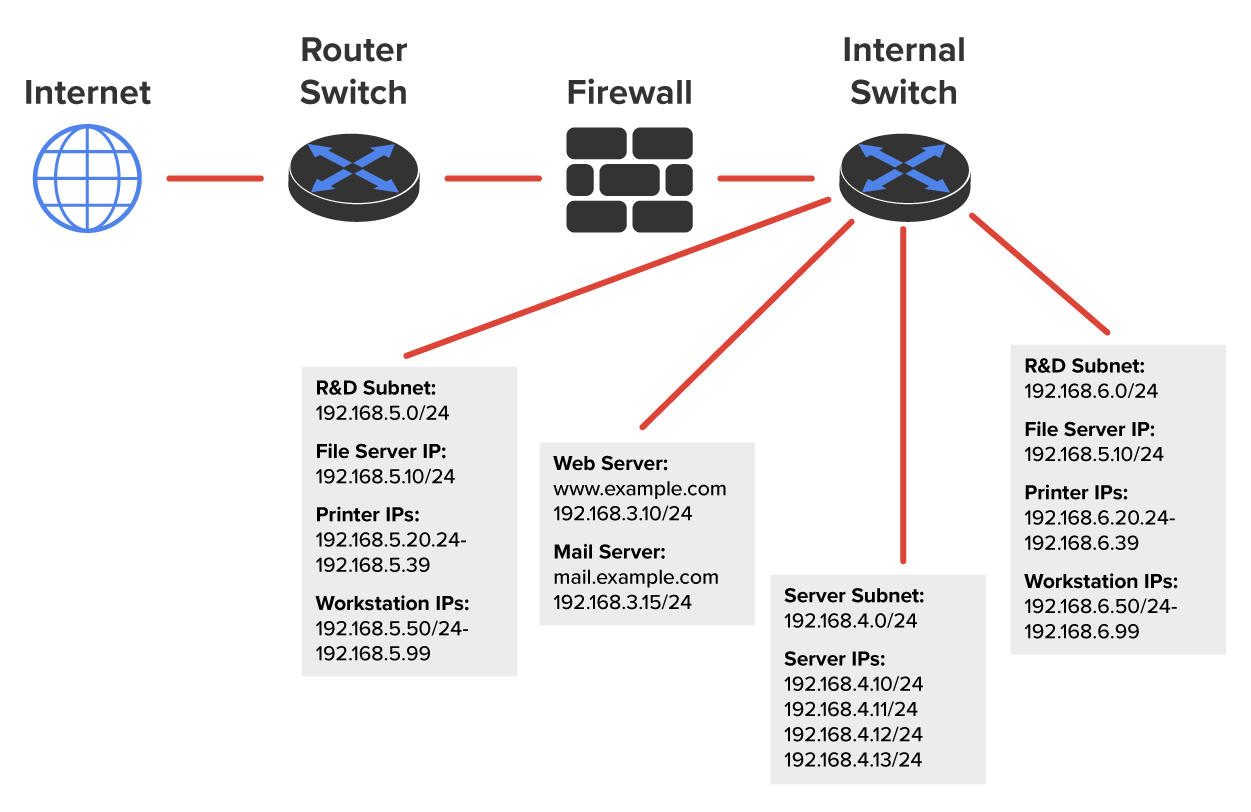
Physical diagrams depict how data physically flows from one area of your network to the next, but a logical network diagram includes things like protocols, configurations, addressing schemes, access lists, firewalls, types of applications, and so on—all things that apply logically to your network. Here’s an example of a typical logical network diagram.

A logical network setup is depicted with various components. An internet icon resembling a globe is labeled ‘Internet’. The internet is connected to a network device labeled ‘Router Switch’. The router switch is connected to a ‘Firewall’ resembling bricks stacked vertically. The firewall is connected to another disk-shaped router labeled ‘Internal Switch’. The internal switch branches out to two R&D subnets, one server subnet, and a web server. The entries in each subnet and server are as follows: 1) R and D subnet: 192.168.5.0/24; File Server I P: 192.168.5.10/24; Printer I P’s: 192.168.5.20.24-192.168.5.39; Workstation I P’s: 192.168.5.50/24-192.168.5.99. 2) Web Server: www.example.com, 192.168.3.10/24; Mail Server, mail.example.com, 192.168.3.15/24 3) Server subnet: 192.168.4.0/24; Server I P’s: 192.168.4.10/24, 192.168.4.11/24, 192.168.4.12/24, 192.168.4.13/24 4) R and D subnet: 192.168.6.0/24; File Server I P: 192.168.5.10/24; Printer I P’s: 192.168.6.20.24-192.168.6.39; Workstation I P’s: 192.168.6.50/24-192.168.6.99

Just as you mirror any physical changes you make to the physical network on your physical diagram, like adding devices or even just a cable, you map logical changes, such as creating a new subnet, VLAN, or security zone, on your logical network diagram. And it’s equally vital that you keep this oh-so-important document up to date!

term to know
Logical Network Diagram
A diagram that details all things that apply logically to your network, such as protocols, configurations, addressing schemes, access lists, firewalls, and types of applications.

2e. Asset Management Records

Asset management involves tracking all network assets like computers, routers, switches, and hubs through their entire life cycles. Most organizations find it beneficial to utilize asset identification numbers to facilitate this process. The ISO has established standards regarding asset management. The ISO 19770 family consists of four major parts. The table below has a list of these parts and their descriptions.

Part Description
19770-1 A process-related standard that outlines best practices for IT asset management in an organization
19770-2 A standard for machine encapsulation (in the form of an XML file known as a SWID tag) of inventory data, which allows users to easily identify what software is deployed on a given device
19770-3 A standard that provides a schema for machine encapsulation of entitlements and rights associated with software licenses; Records (known as ENTs) describe all entitlements and rights attendant to a piece of software and the method for measurement of license/entitlement consumption; Still a draft
19770-4 Allows for standardized reporting of utilization of resources; Crucial when considering complex data center license types and for the management of cloud-based software and hardware (software as a service, or SaaS, and infrastructure as a service, or IaaS); Also still a draft

term to know
Asset Management
A system for tracking all network assets like computers, routers, switches, and hubs through their entire life cycles.

2f. IP Address Utilization Documentation

Documenting the current IP addressing scheme can also be highly beneficial, especially when changes are required. Not only is this really helpful to new technicians, but it’s very useful when identifying IP addressing issues that can lead to future problems. In many cases IP addresses are configured over a long period of time with no real thought or planning on the macro level. Current and correct documentation can help administrators identify discontiguous networks (where subnets of a major network are separated by another major network) that can cause routing protocol issues. Proper IP address design can also facilitate summarization, which makes routing tables smaller, speeding up the routing process. None of these wise design choices can be made without proper IP address documentation.

2g. Vendor Documentation

Vendor agreements often have beneficial clauses that were negotiated during the purchase process. Many also contain critical details concerning service-level agreements (SLAs) and deadlines for warranties. These documents need to be organized and stored safely for future reference. Creating a spreadsheet or some other form of tracking documentation that alerts you of upcoming dates of interest can be a huge advantage!


summary
In this lesson, you learned about various types of documentation forms that network technicians create and use as part of managing a network. These schematics and diagram types included documentation formats, wiring diagrams, physical network diagrams, logical network diagrams, asset management records, IP address utilization documentation, and vendor documentation.

Source: This content and supplemental material has been adapted from CompTIA Network+ Study Guide: Exam N10-007, 4th Edition. Source Lammle: CompTIA Network+ Study Guide: Exam N10-007, 4th Edition - Instructor Companion Site (wiley.com)

Terms to Know
Asset Management

A system for tracking all network assets like computers, routers, switches, and hubs through their entire life cycles.

Logical Network Diagram

A diagram that details all things that apply logically to your network, such as protocols, configurations, addressing schemes, access lists, firewalls, and types of applications.

Physical Network Diagram

A diagram that contains all the physical devices and connectivity paths on your network.

Wiring Diagram

A diagram that shows the paths of the wires used in a network.