Table of Contents |
The financial obligations of a company are typically met with liquid assets. An asset is considered liquid if it can be easily converted into cash; liquid assets may include cash itself and cash equivalents, accounts receivables, marketable securities, and money market accounts. In this tutorial, we will discuss the use of liquidity ratios as a tool for determining a company’s ability to pay its existing liabilities with the assets that it currently possesses.
A company’s liquid assets can be compared to certain other accounts or items in its financial statements in order to get a sense of the company’s short-term debt-paying ability. These comparisons are in the form of fractions, generally referred to as ratios. Liquidity ratios are comparisons used by banks, insurers, regulators, and analysts to determine the financial health of an organization by identifying if the company’s liquid assets will be enough to cover its debts. The higher the company’s liquidity ratios, the greater its ability to pay off short-term liabilities with cash and other liquid assets. Each of the ratios that we will learn to calculate in this tutorial provides an interested party with added perspective into a company’s ability to meet its financial obligations.
EXAMPLE
If a company is looking to expand its operation with a second production facility, it very possibly will need to borrow money to fund the construction. A bank will evaluate the company’s ability to pay its current debt through liquidity ratios before agreeing to extend additional credit.Liquidity ratios show interested parties whether the company has the capacity to meet the maturing current liabilities. The ratios and measurements we will be looking at in this tutorial are working capital, current ratio, and acid-test ratio.
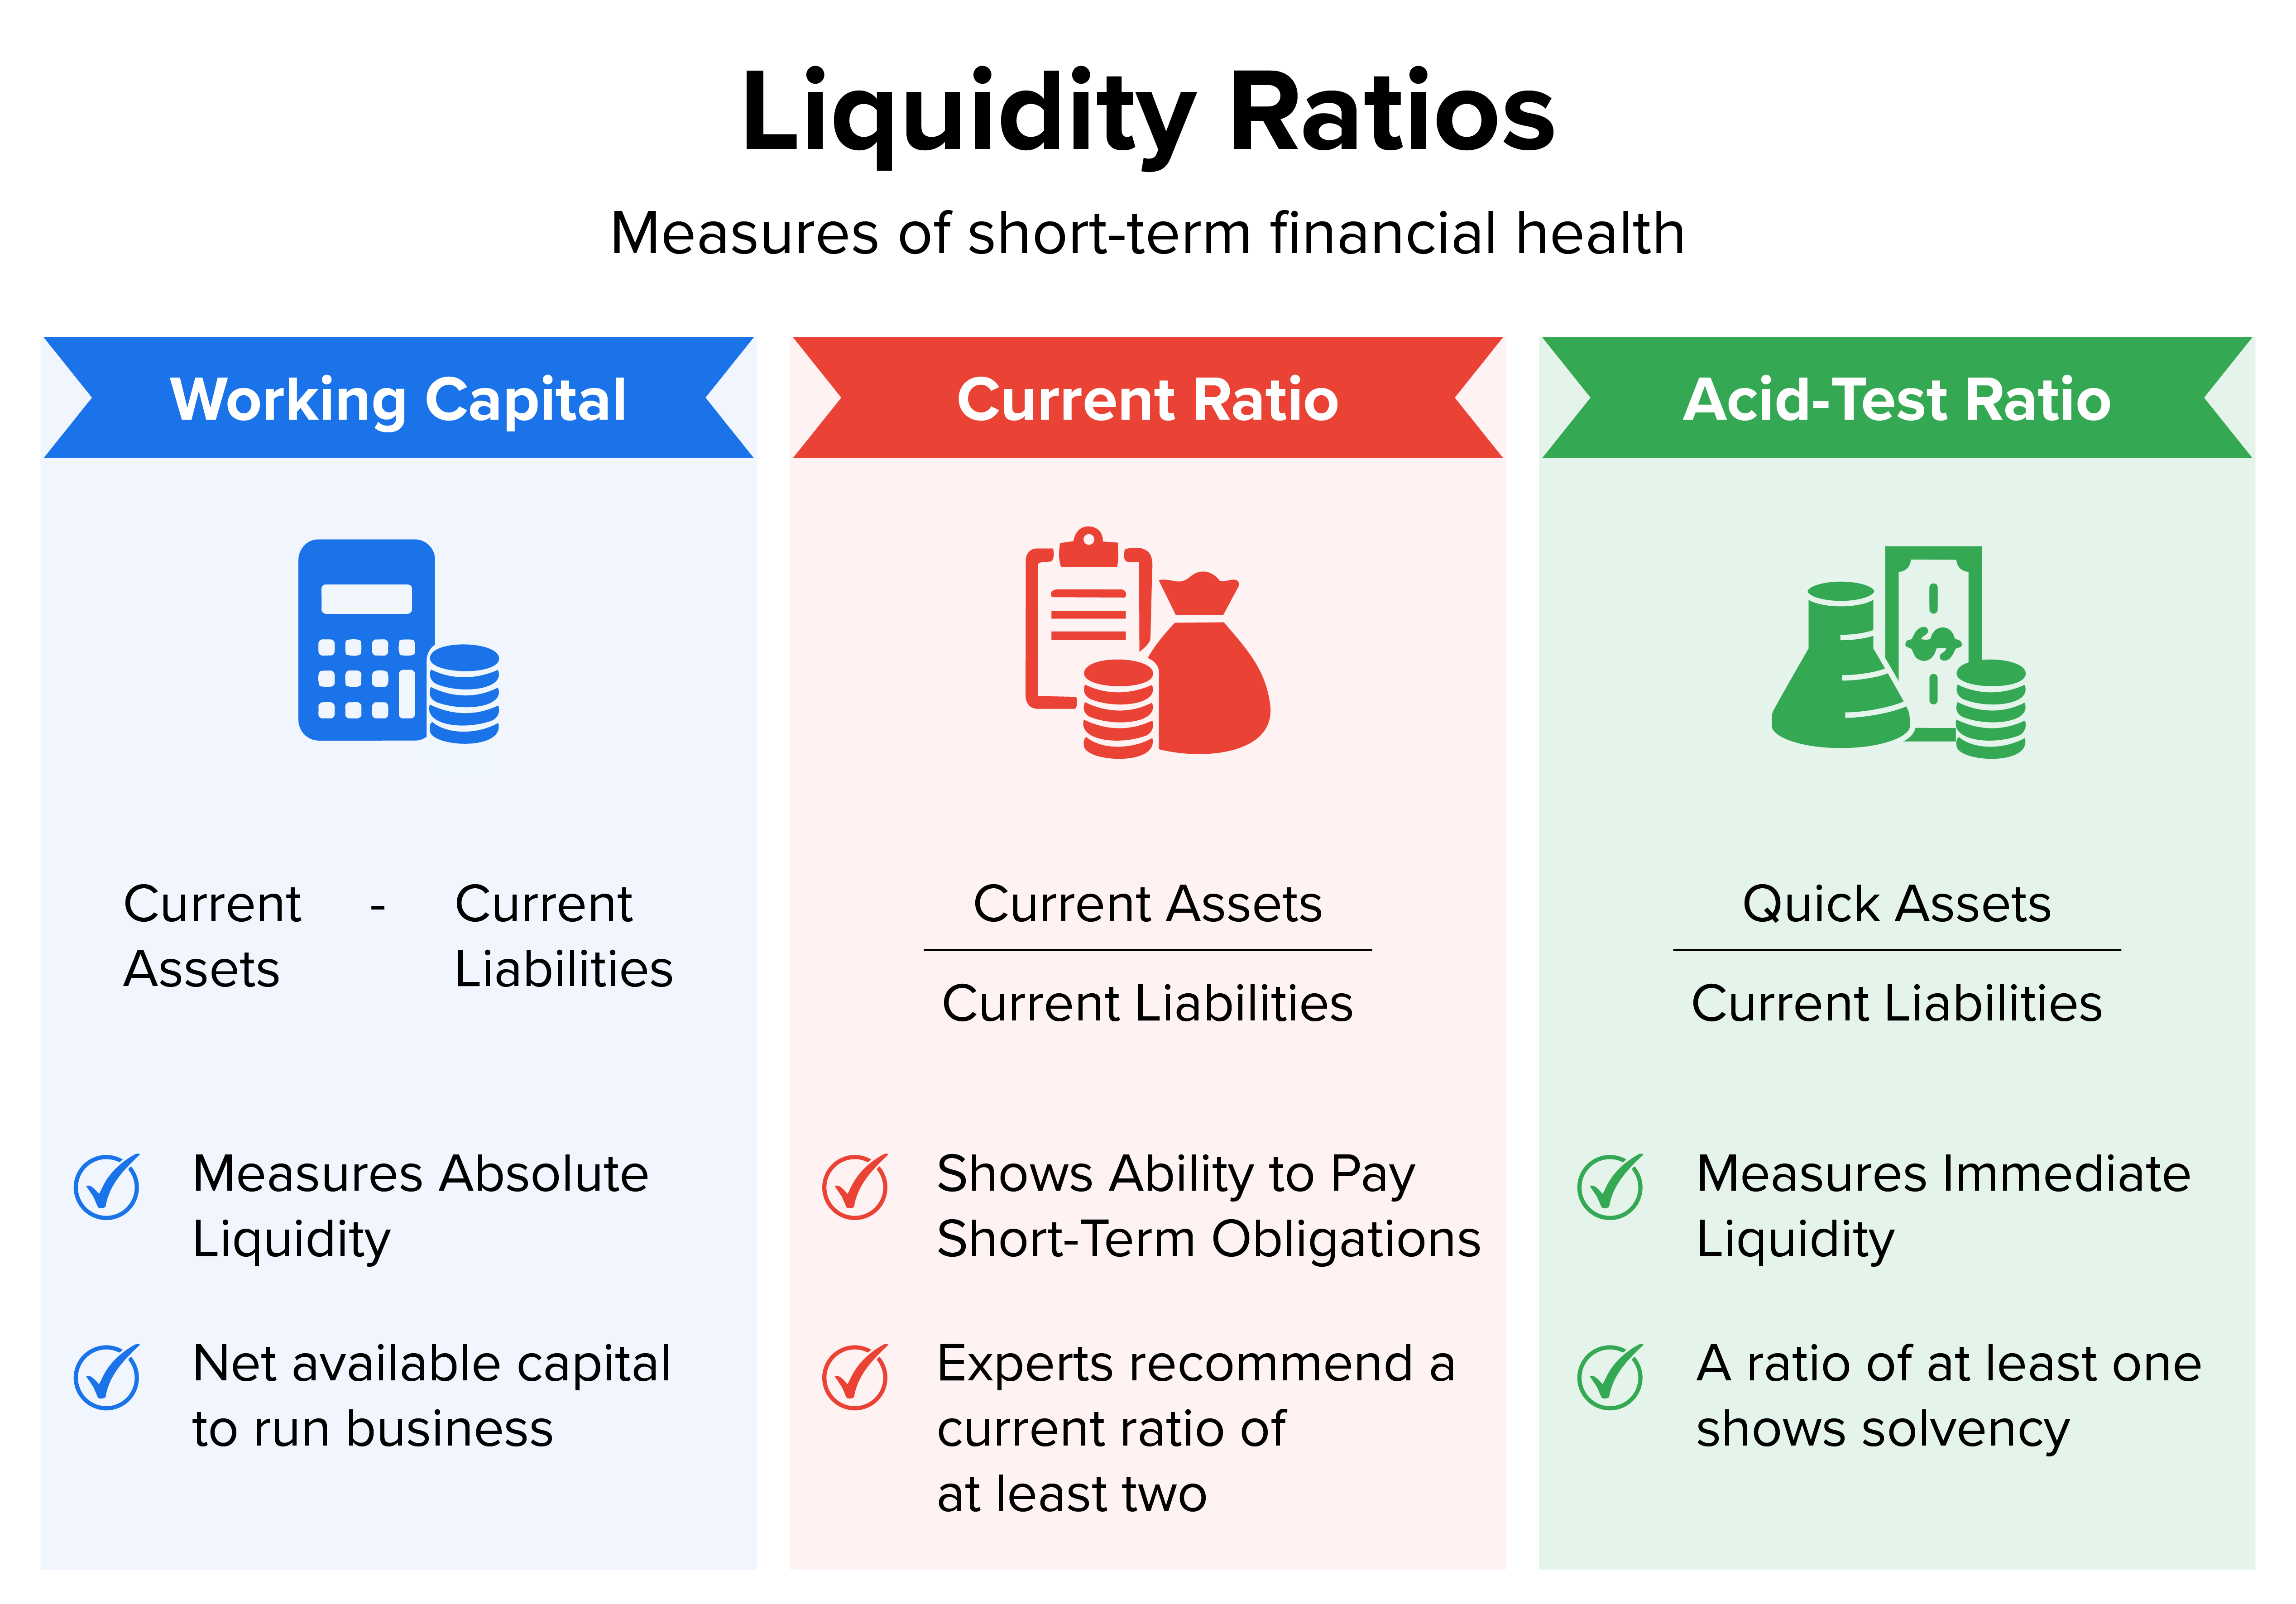
Working capital is the measurement of how much more current assets than current liabilities a company has. Ideally, a company has more current assets than current liabilities; working capital is a measurement of the size of this difference. It is used to evaluate a company’s ability to meet its short-term obligations. Financial analysts as well as creditors will continually monitor a company’s working capital.
To calculate a company’s working capital, simply subtract the value of its current liabilities from the value of its current assets.

When it comes to working capital, more is not necessarily better. Having excess working capital demonstrates that the company can pay its liabilities on time. However, keeping a large amount of working capital also comes with a price. Working capital is often paid for by increasing the company’s assets. Assets are purchased by the company with money that is either borrowed or provided through equity, which can be expensive for the company.
If a company has an excessive amount of working capital, this may indicate that it is not using its current assets as efficiently as possible. For instance, idle cash could be invested, and large amounts of inventory could indicate unwanted stock. The goal should be for a company to maintain just enough working capital to pay its short-term debt.
EXAMPLE
Andrea is considering investing in Thirst Quencher Inc., a wholesale beverage distributor. As she analyzes the company’s working capital, she is initially excited to see that it has grown from $7,688 million to $10,776 million from 2021 to 2022.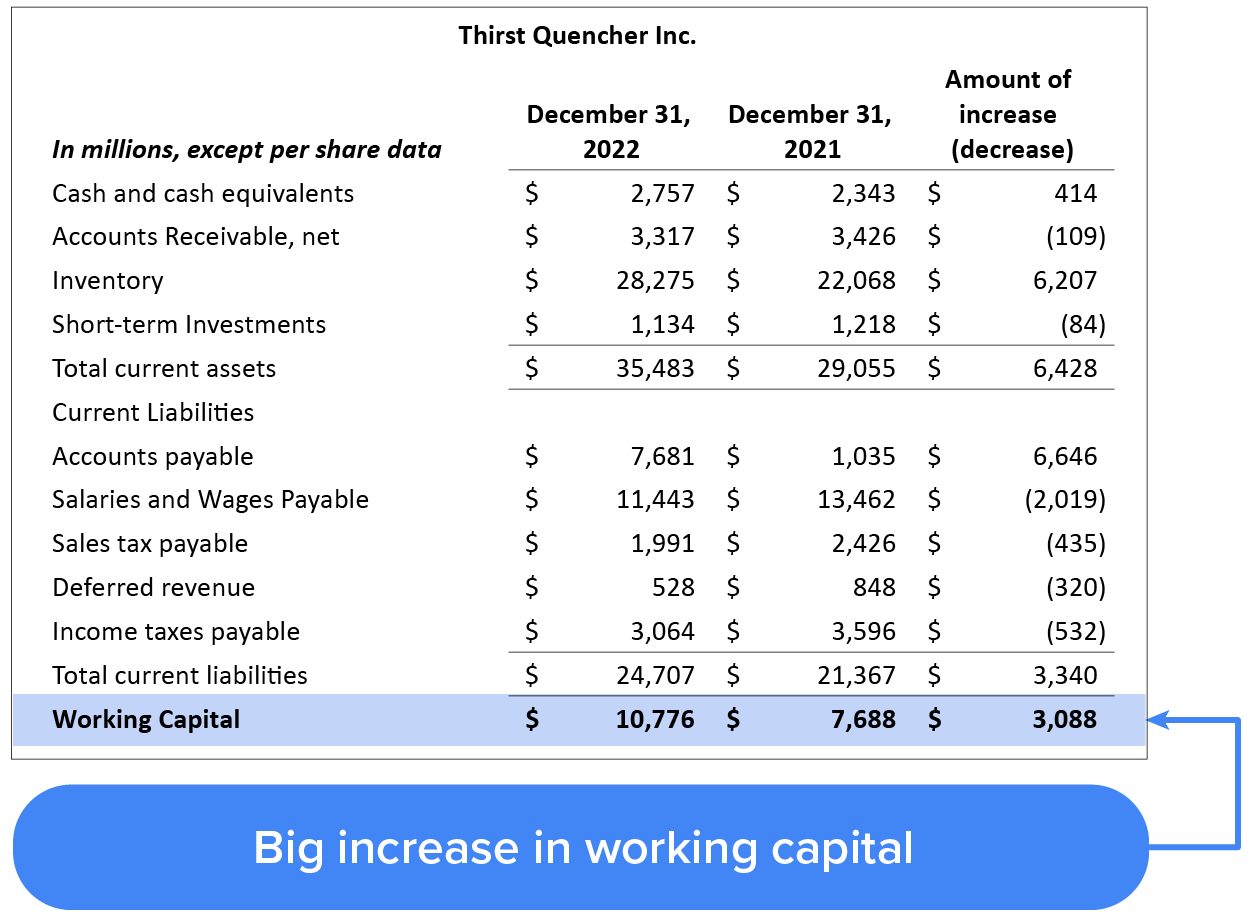
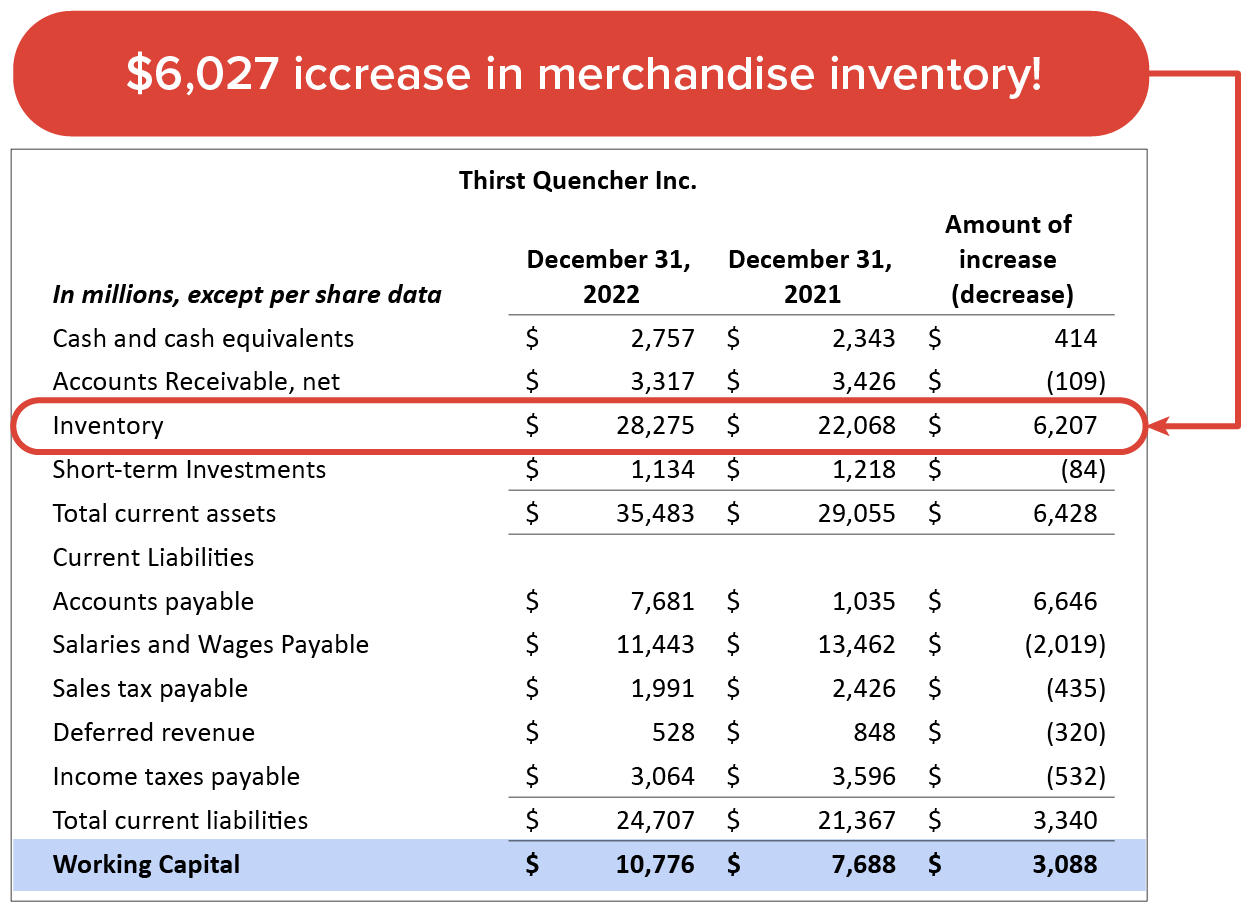
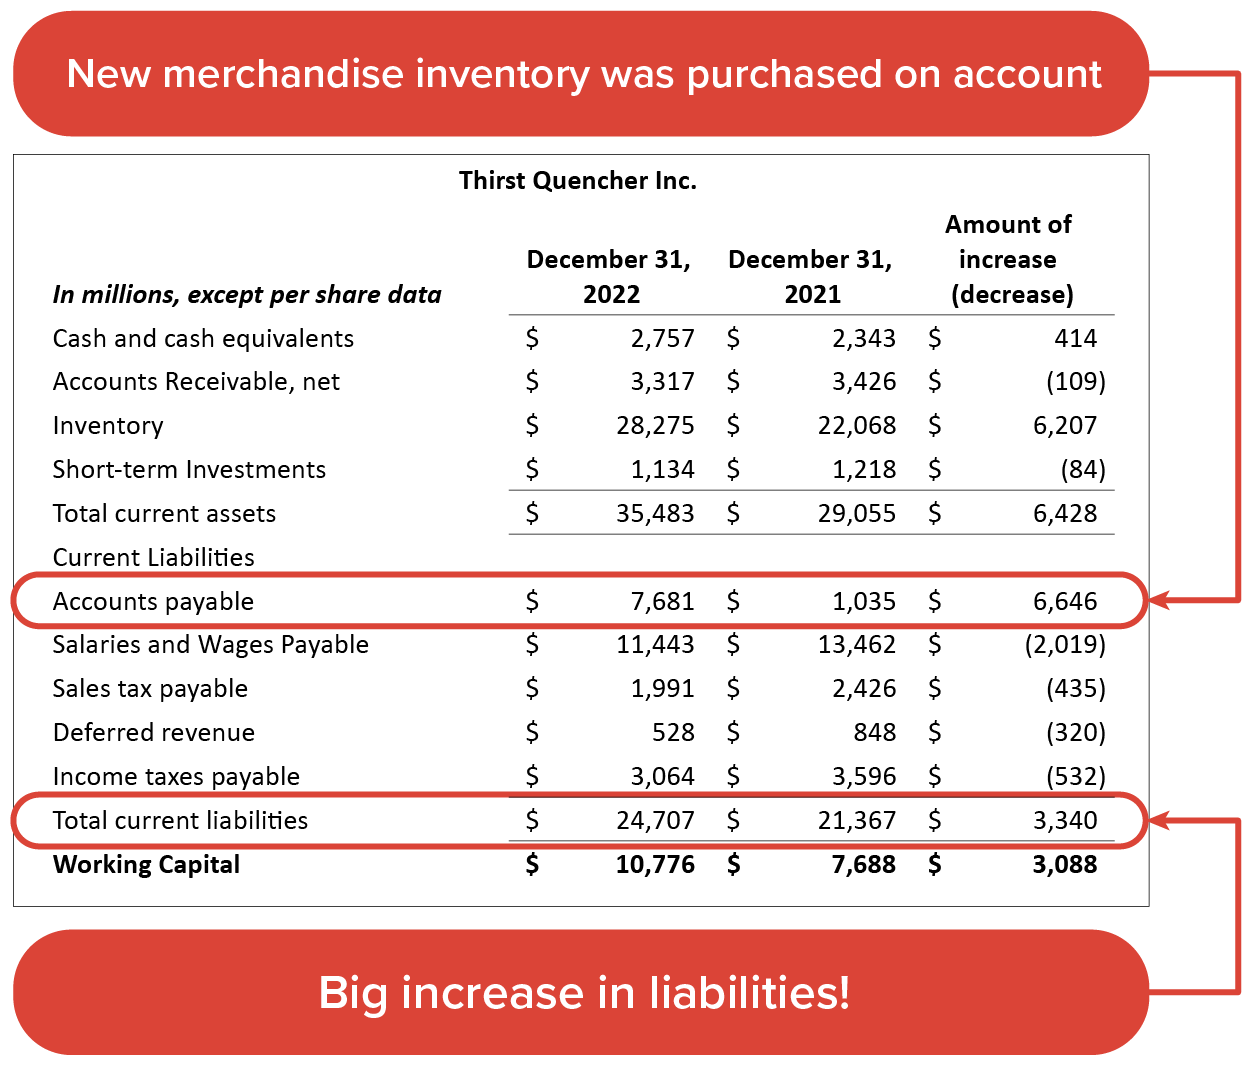
Ultimately, an analyst needs to look carefully at working capital and where it came from. A company can have too little or too much working capital. When assessing a company or comparing two companies of similar sizes, an analyst needs to look at not just the working capital but also the proportion of current assets to current liabilities.
The ratio that relates current assets to current liabilities is the current ratio. This liquidity ratio provides a better indicator of a company’s ability to pay current debts than can be inferred from working capital alone. An analyst can use this ratio to determine if a company’s assets and liabilities are in a healthy relationship with one another, or if one is too large or too small.
We can compute the current ratio by dividing the current assets by the current liabilities. The ratio is usually stated as the number of dollars of current assets to $1 of current liabilities (although the dollar signs are usually omitted).

EXAMPLE
For Synotech, in 2026, its current assets totaled $2,846.7 million and its current liabilities totaled $2,285.2 million.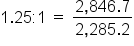
But to better see how the current ratio compares to working capital for analysis, we should use it to compare two different but similar-sized companies.
EXAMPLE
Let’s compare Synotech and Plastiguard using working capital and the current ratio.
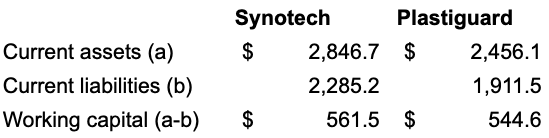
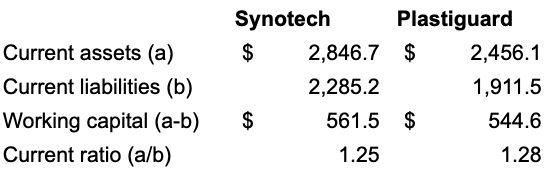
From our examples, we can see that the current ratio provides a better view of a company’s ability to pay its current liabilities on time. The current ratio provides a more in-depth analysis than working capital figures, which makes comparing companies easier. Short-term creditors are particularly interested in the current ratio because turning inventories and accounts receivable into cash is the primary way that a company obtains the cash to pay those short-term creditors. Long-term creditors are also interested in the current ratio because a company that is unable to pay short-term debts may be forced into bankruptcy. For this reason, many bond indentures or loans contain a provision requiring that the borrower maintain at least a certain minimum current ratio.
Many analysts believe that a company should maintain a current ratio of at least 2. However, some companies do operate successfully with lower ratios. A company must guard against a current ratio that is too high, especially if caused by idle cash (uninvested cash that is just sitting around losing value relative to inflation), slow-paying customers, and/or slow-moving inventory. When too much capital that could be used profitably elsewhere is tied up in current assets, this could lower a company’s net income.
EXAMPLE
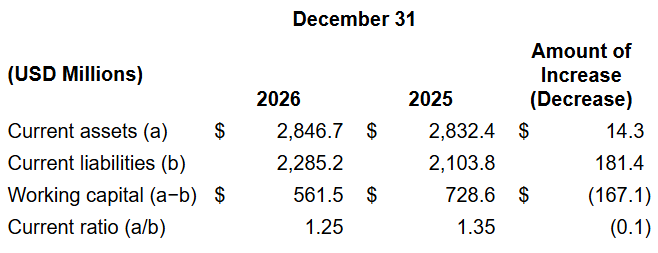
Let’s look at the comparative data for Synotech for 2025 and 2026.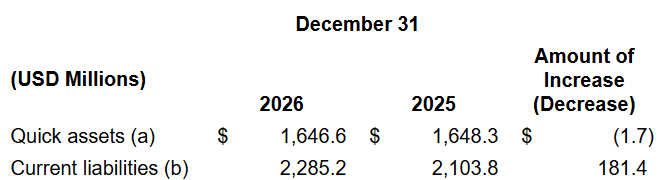
The current ratio is not the only measure of a company’s short-term debt-paying ability. The acid-test ratio, also often referred to as the quick ratio, is a liquidity ratio that indicates a company’s ability to pay short-term obligations on time with only its most liquid assets. It is the ratio of quick assets (highly liquid assets that include cash, marketable securities, accounts receivables, and net receivables) to current liabilities. The acid-test ratio is considered a more aggressive test of a company’s ability to meet its current debt because analysts exclude less-liquid assets, such as inventories and prepaid expenses, from current assets. Other current assets are ignored because it would be more difficult or take more time to convert them into cash.
EXAMPLE
For personal finance, highly liquid assets might include stocks and bonds, which can be sold whenever the stock or bond markets are open and thus turn quickly into cash. Less-liquid assets might include a house because selling a house or taking out a new mortgage can take many months before that house becomes cash. The same is true for a company. Marketable securities and accounts receivables can be turned into cash quickly by selling them or collecting on them, while inventories and prepaid expenses take a longer time to convert to cash through operating activities.The formula for the acid-test ratio is as follows:

Short-term creditors are particularly interested in this ratio since it measures the ability of a company to meet its current debt without relying on the liquidation of inventory. Ideally, a company would look for its acid-test ratio to be at minimum 1 (or $1.00:$1.00); however, it is not uncommon for successful companies to maintain a lower ratio.
EXAMPLE
Let’s return to the comparative numbers for 2026 and 2025 for Synotech.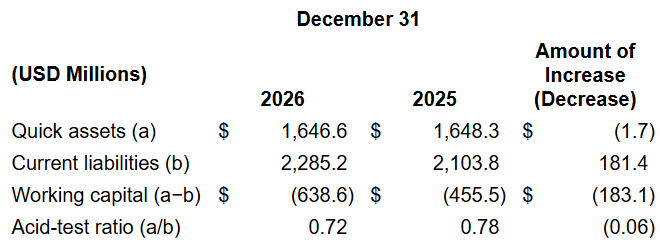
In deciding whether the acid-test ratio is satisfactory, investors also consider the quality of the marketable securities and accounts receivables. Accounts receivables are considered high quality when they are very likely to be collected, and they are considered poor quality when many of the existing accounts will remain uncollected in the future.
Not all marketable securities are the same; some have stable values and can quickly be sold at their original cost or at a profit. However, other marketable securities have declined in value over time and can not be sold for the same amount that is listed on the balance sheet because of a diminished value. Poor-quality marketable securities or accounts receivables could cause an acid-test ratio to appear better than it truly is.
Source: THIS TUTORIAL HAS BEEN ADAPTED FROM "ACCOUNTING PRINCIPLES: A BUSINESS PERSPECTIVE" BY Hermanson, Edwards, and Maher. ACCESS FOR FREE AT open.umn.edu/opentextbooks/textbooks/383. LICENSE: CREATIVE COMMONS ATTRIBUTION 3.0 UNPORTED. Accessed by November 2022.