Table of Contents |
We use the law of demand every day. Think about the last time you bought something because it was on sale or used a coupon or an ad to get a deal. Alternatively, perhaps you did not buy something because its price was too high.
In all of these situations, you were using demand. Demand means that you want something and you can afford it or you have the willingness to pay for it—which is why demand is sometimes called willingness to pay.
Here is an example of a demand schedule featuring Granny Smith apples.
| Price of Granny Smith Apples | Quantity of Granny Smith Apples Each Week |
|---|---|
| $2.00 | 0 |
| $1.75 | 1 |
| $1.50 | 2 |
| $1.25 | 3 |
| $1.00 | 4 |
| $0.75 | 5 |
| $0.50 | 6 |
| $0.25 | 7 |
| $0.00 | 8 |
Notice that it details the price of the apple at each respective quantity as if you were surveyed to find out how many apples you would purchase each week at different prices.
As the price goes down to $1.50, you might buy two a week and treat yourself. If the price were only $0.50 an apple, you would purchase six, and if it were $0.25, you’d purchase seven. Now, if the apples were free, you likely would not be able to eat many more than an apple a day, so you would buy eight.
When we graph this relationship, we put the price on the y-axis and the quantity that you are willing and able to purchase on the x-axis, and we simply plot the points.
You can see that when we plot the points, we are presented with a downward-sloping demand curve.
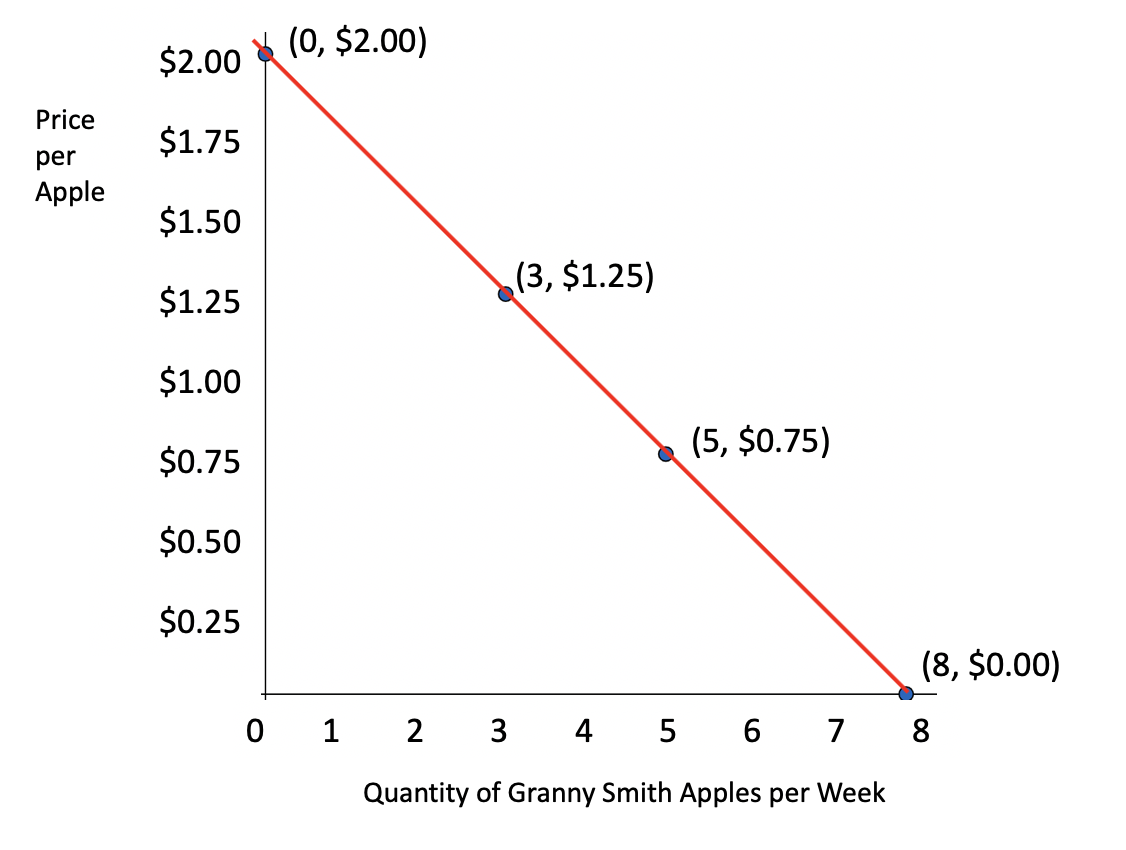
As the price of Granny Smith apples falls, you tend to buy a greater quantity, which is essentially the law of demand.
Notice that there is an inverse or negative relationship between the price and the quantity: As the price falls, the quantity rises. The reverse is also true: As the price rises, the quantity falls.
The law of demand is defined as the inverse correlation between price and quantity with all other variables fixed.
So, why is demand downward sloping? Why is there an inverse relationship between price and quantity?
Well, it is actually because of two different reasons. As something gets more expensive, the following occur:
EXAMPLE
Keeping with the apple example, when the price goes up for Granny Smith apples only, people will likely respond in a variety of ways because there are so many different brands of apples. They can either buy a different brand of apple or simply purchase a different fruit because there are many substitutes for Granny Smith apples.However, for some goods and services, people will not respond as much when the price changes.
EXAMPLE
Generally speaking, as gasoline gets more expensive, most people will still want to drive. However, at some point, people will start to alter their behavior as gasoline gets more expensive and impacts their income. This is the point at which we might see people begin to carpool more often, go on fewer long trips, or perhaps utilize public transportation. They might even consider relocating closer to work.In this case, then, gasoline is more difficult to substitute than a brand of apple, so people do not respond as much.

Keep in mind, though, that these exceptions to the law of demand are very rare. For the most part, as the price goes up, people buy less, while as the price goes down, people tend to buy more.
It is important to note, though, that this assumes the law of ceteris paribus, which is defined as holding all other variables constant. In our apple example, we have been saying that as the price of Granny Smith apples goes up, we expect that people will buy fewer Granny Smith apples.
However, ceteris paribus assumes that only the price of Granny Smith apples has changed. For instance, the price of Gala apples did not change, the price of oranges or bananas did not change, and your income did not change. This is why a change in price is seen as movement along the curve.
Referring to our original demand schedule and demand graph, notice that as the price of Granny Smith apples drops, you buy more.
Because the price is on the y-axis and the quantity is on the x-axis, this is only involving a relationship between these two variables—price and quantity. Therefore, as price changes, we can only move from one point to the next along the demand curve.
It is very important to clarify this point when describing this relationship. This is not a change in demand itself. It is not accurate to state that as the price falls, demand goes up.
Rather, we would say that as the price falls, the quantity demanded increases. Therefore, we consider a price change to be a change in the quantity demanded, not a change in demand itself.
Source: Adapted from Sophia instructor Kate Eskra.