In this lesson, you will learn how to use Python as a tool for organizing, analyzing, and visualizing data in business data analytics. Specifically, this lesson will cover:
-
This course will utilize GitHub to provide data for your Python programming tasks.
GitHub is an online platform widely used for storing and sharing files, particularly by developers and data analysts. It allows teams to collaborate, manage versions of files, and access data efficiently. While GitHub is often associated with coding, it also serves as a powerful tool for business analytics by providing a central location for storing and accessing datasets.
In previous units, GitHub stored Excel files in a way that allowed you to open them directly in the Excel Online app, making it easy to analyze data without downloading files. Now, GitHub will also be used to store datasets that you can access directly with Python. Instead of manually downloading and uploading files, you will be able to retrieve data using a direct link in your Python code. This approach streamlines workflows, ensures consistency in data sources, and eliminates file management issues. Importantly, you do not need a GitHub account to access these datasets. You will be provided with direct links to the files, which you can use in Python without logging in or setting up an account.
As you move into your career, you may find GitHub useful in business settings where teams need to work with shared datasets, automate reports, or integrate data from multiple sources. Many companies use GitHub for data management, collaboration, and version control, making it a valuable skill to understand. By learning how to access and analyze data through GitHub, you are developing an efficient and scalable way to work with data—one that is increasingly used in finance, marketing, supply chain management, and other business fields.
1. Getting Started with Python
Python is a powerful and flexible programming language widely used in business to analyze and visualize data. Before you can start working with data, you need to understand the setup of the tools that make Python so effective. These tools are called libraries, which are like pre-built toolkits designed to handle specific tasks. In this section, you will learn how to install these libraries using a lightweight package installer called Micropip.
You will also be introduced to JupyterLab, a web-based environment for writing and running Python code. JupyterLab provides an interactive interface where you can write code, see the results immediately, and document your analysis—all in one place. By the end of this section, you’ll have a working Python environment in JupyterLab and the tools you need to start analyzing data effectively. Don’t worry if this feels new—each step will be explained in detail!
-
- Library
- Pre-built toolkits of code designed to handle specific tasks.
- JupyterLab
- A web-based integrated development environment for writing and running Python code for data analysis.
1a. Introduction to Jupyter Labs
JupyterLab is an interactive development environment that allows you to create and run code in a user-friendly, web-based interface. A notebook in JupyterLab is an interactive document that combines code, text, and outputs in a single, organized environment. It is one of the most powerful tools available for data analysis, machine learning, and general coding tasks. Notebooks are saved with the file extension .ipynb, short for Interactive Python Notebook.
A notebook provides a versatile environment where you can:
- Write and test code interactively.
- Document your thought process alongside your code.
- Visualize data in charts and graphs.
- Collaborate easily by sharing the .ipynb file with others.
Follow these steps to explore the basic functionality of notebooks on JupyterLabs:
-
1. Accessing JupyterLab
To start using JupyterLab, open your web browser and navigate to the
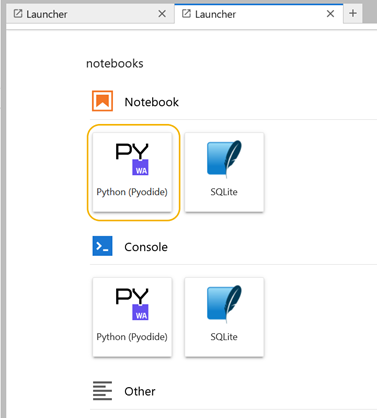
JupyterLab Try It page. This platform is free to use and runs entirely in your browser, making it easy to experiment without installing anything on your computer. Once you’re on the page, select the Python (Pyodide) Notebook option to open a new notebook.
 2. Exploring the Notebook Interface
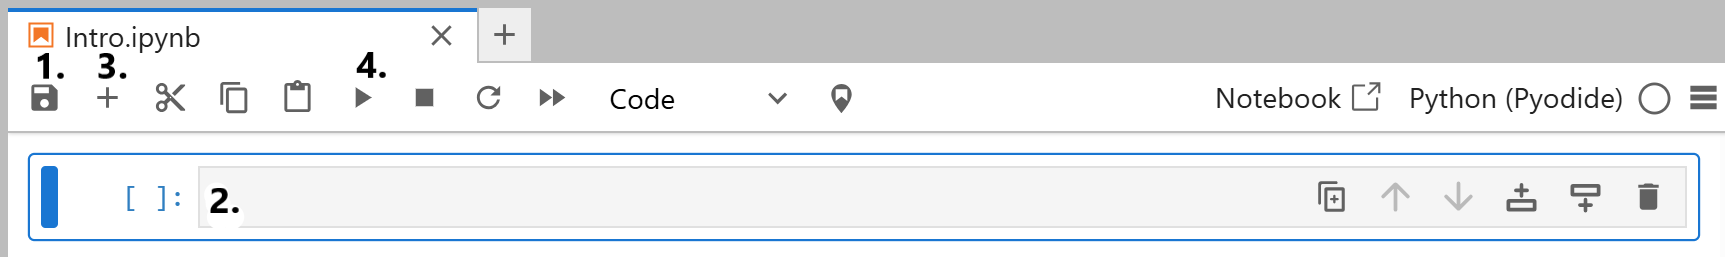
Once the notebook is open, you’ll notice a variety of buttons and tools at the top of the interface. Let’s walk through the most important ones for getting started, as shown in the image below:
-
Saving and Renaming Your Notebook: In the upper left corner, there’s a button (typically with a floppy disk icon) that allows you to save your work. Click it and you’ll be prompted to rename your notebook. Renaming helps you stay organized, especially if you plan to work on multiple projects. The save button is labeled as #1 in the screenshot above.
-
Understanding Code Cells: The notebook is structured around cells, where you can write and run your code. Cells are the basic building blocks of your notebook and can hold code, text, or outputs. Once a cell has been executed, then the results are displayed in the output cell area. The code cell is labeled as #2 in the screenshot above.
-
Adding New Cells: To add a new cell, click the + button in the toolbar. This creates a blank space where you can write additional code or text. You can add as many cells as you need to organize your work. The add new cells button is labeled as #3 in the screenshot above.
-
Running Code: When working in JupyterLab, you’ll write Python code inside cells. Each cell is like a container for a small piece of code. To run the code in a cell, you use the play button ( ▶️ ) located at the top of the JupyterLab interface or by pressing Shift + Enter on your keyboard. The play button only executes the code in the cell you’ve selected. For example, if you’ve written code in Cell 1, clicking the play button will only run the code in Cell 1, and it won’t run any other cells. Code cells must be run in order from top to bottom. Python remembers the instructions you’ve given it, but if you skip cells or run them out of order, it may result in errors. The play button is labeled as #4 in the screenshot above.
3. Downloading/Saving Notebooks
When you use
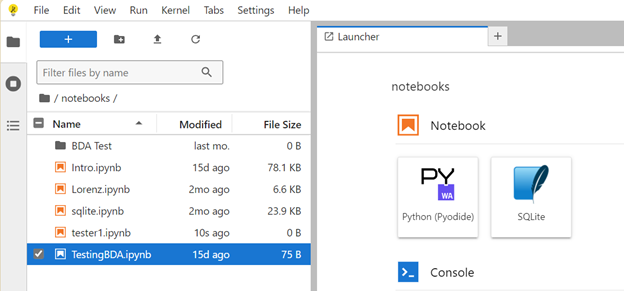
JupyerLab, your files and work history are stored indefinitely unless you manually delete them. This means that even if you close your browser or exit the platform, your files will remain available the next time you return—unless you choose to clear the storage by deleting your history or cache. Files are shown in the image below.
If you want to save your work locally, JupyterLab allows you to download your notebooks as files with the .ipynb extension. This file format preserves your code, outputs, and text cells, enabling you to re-upload and continue working on the same notebook in the future.
Steps to Download a Notebook:
- Locate the file you wish to save in the file explorer pane on the left side of the JupyterLab interface.
-
Right-click on the file name to open the context menu.
- Select the Download option from the menu.
- The .ipynb file will be saved to your device's default download location.
After downloading your notebook, you can re-upload it to JupyterLab or another Jupyter platform when you’re ready to resume your work. This flexibility allows you to store notebooks locally or transfer them between different environments.
While these basic tools will help you get up and running, JupyterLab includes many additional features that you might find useful as you become more comfortable with the platform. For a deeper dive into JupyterLab’s functionality, refer to the official Jupyter Notebook Guide and the section on “Notebooks” in the JupyterLab 4.3.1 documentation.
With these steps, you’re ready to start exploring Python coding in JupyterLab! Take your time to experiment with writing and running code, adding new cells, and saving your work. As you become more familiar with the platform, you’ll discover how powerful and versatile it can be for projects of any size.
-
- Notebook
- An interactive document that combines code, text, and outputs in a single, organized environment.
- Code Cells
- Section of the notebook where users can write and execute programming code.
1b. Learn How to Set Up Python Packages and Libraries Using micropip and Other Tools
To analyze data with Python, you need to use specialized tools called libraries. Libraries are collections of pre-written code that make complex tasks—like managing data or creating graphs—simple and efficient. Instead of writing everything from scratch, you can use these libraries to save time and focus on the analysis.
You will utilize many different libraries in business data analytics, but in this tutorial, you’ll examine three important libraries:
-
pandas: Helps organize and manipulate data in tables, called DataFrames.
-
openpyxl: Allows Python to read and work with Excel files.
-
matplotlib: Creates charts and graphs to visualize data.
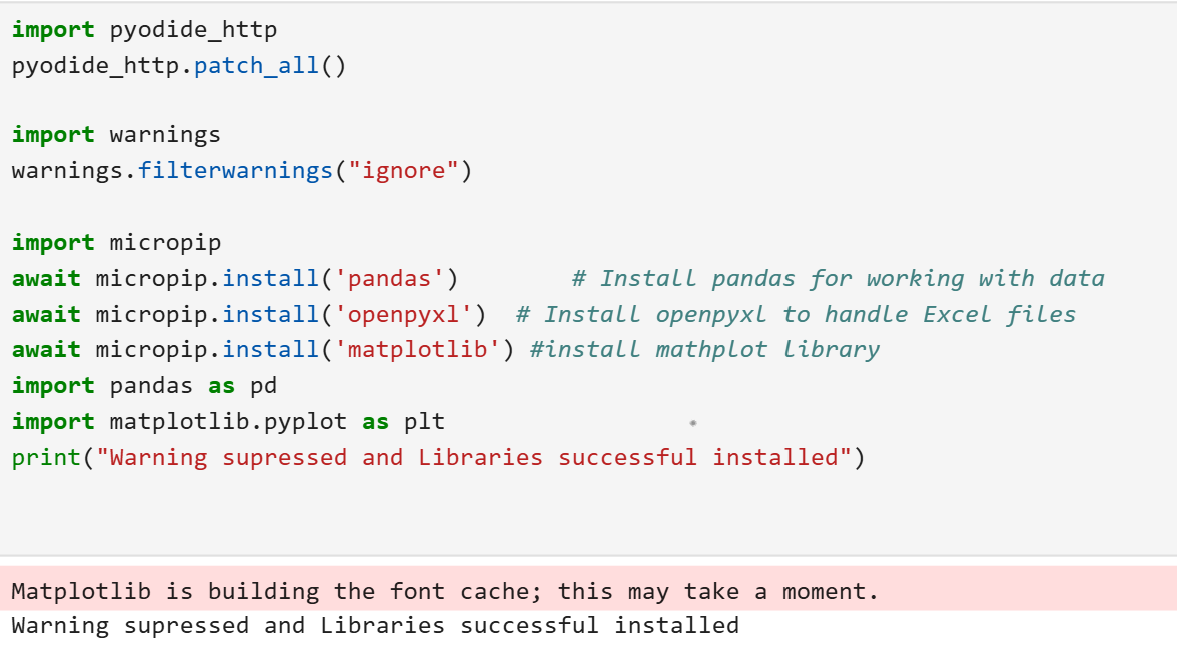
Before you can use these libraries, you need to install them. In some Python environments, installing libraries is as simple as typing a command. However, because you’re working in a web-based environment like JupyterLab, you use a package installer called micropip. Let’s take a moment to understand why micropip is essential for our setup. Below, the screenshot shows all the code and setup after you have run the code, as you will see it in JupyterLab, following the step-by-step directions and explanations.
-
Step 1: Preparing Your Environment
Before you install libraries, you need to configure our Python environment for web-based use. This ensures that Python can handle downloading and installing files through the browser.
Run the following commands to set up your environment:
# Import and patch libraries for web use
import pyodide_http
pyodide_http.patch_all()
What does this do?
- pyodide_http is a module that enables Python to handle web requests in the browser.
- patch_all() configures the environment to support downloading libraries and files directly from the internet.
Step 2: Importing micropip
Next, you import the micropip tool, which allows us to install Python packages in a web-based environment. Type and run the following:
import micropip
This tells Python that you’ll be using the micropip tool to install packages.
Step 3: Installing Libraries
Now you can install the necessary libraries. Use the micropip.install() function to install each package one at a time. Don’t forget to include the await keyword, which tells Python to wait until the installation is complete.
await micropip.install('pandas') # Install pandas for working with data
await micropip.install('openpyxl') # Install openpyxl to handle Excel files
await micropip.install('matplotlib') # Install matplotlib for creating charts
Each command downloads the specified library and makes it available for use in your code.
Step 4: Verifying Installation
Once you’ve installed the libraries, it’s a good idea to test if everything is working correctly. Run the following commands:
import pandas as pd
import matplotlib.pyplot as plt
print("Libraries installed successfully!")
If you see the message "Libraries installed successfully!" and no errors, your environment is ready to use.
-
- Pandas
- A library that helps organize and manipulate data in tables, called DataFrames.
- openpyxl
- A library that allows Python to read and work with Excel files.
- matplotlib
- A library that creates charts and graphs to visualize data.
1c. Understand Essential Python Syntax
Python is a beginner-friendly programming language, but understanding its basic syntax is crucial to get started effectively. This tutorial will introduce three essential concepts: printing, commenting, and case sensitivity, with a focus on practical examples for business data analytics. No prior programming experience is required.
What is a Variable?
A variable in Python is a name that refers to a value stored in the computer's memory. Variables are used to store data that can be manipulated and retrieved throughout your program. You can think of a variable as a container that holds information.
total_sales = 5000
In this example, total_sales is the variable name, and 5000 is the value assigned to it. You can use the variable total_sales later in your code to refer to this value.
What is a Function?
A function in Python is a block of reusable code that performs a specific task. Functions help to organize code into manageable sections, making it easier to read, debug, and maintain. Python has many built-in functions, such as print(), and you can also create your own custom functions.
Functions typically take inputs, called arguments, and return an output. For example, the print() function takes a message as an argument and displays it on the screen.
print("Hello, World!")
In this example, print is the function name, and "Hello, World!" is the argument passed to the function.
Printing
Printing is one of the first commands you’ll use in Python. It allows you to display text, numbers, or results directly on the screen, which is useful for checking calculations, reporting outputs, or debugging.
In Python, you use the print() function to display messages or outputs.
print("Welcome to Business Data Analytics!")
This code will display:
Welcome to Business Data Analytics!
In Python, the print() function can take multiple items separated by commas. This is particularly helpful when combining text (strings) and numbers (or other variables) in a single statement. Each item separated by a comma will appear with a space between them in the output.
total_sales = 5000
print("Total Sales for Q1:", total_sales)
Output:
Total Sales for Q1: 5000
The comma separates the text "Total Sales for Q1:" from the variable total_sales. Python automatically adds a space between these items, so you don’t need to include it manually in the text.
You might wonder why you don’t just combine text and variables using a + symbol, like this:
print("Total Sales for Q1: " + str(total_sales))
While this works, it requires converting the variable (total_sales) to a string using str() and can become tedious with complex outputs. Using commas is simpler and avoids errors when mixing different data types.
When printing multiple items, the course will use the comma (,) to separate values.
Format Strings
Format strings provide a more powerful way to combine text from the print() function and variables. They allow you to control the formatting of the output, including rounding numbers.
Suppose the variable total_sales from previous examples now has a decimal component to it. For example:
total_sales = 5000.456
print(f"Total Sales for Q1: {total_sales:.2f}")
The output will be:
Total Sales for Q1: 5000.46
In this example, the f before the contents enclosed in quotes indicates that it is an f-string (formatted string). The {total_sales:.2f} part tells Python to format the total_sales variable to show only 2 decimal places. This is useful for rounding values and ensuring consistent formatting in your output.
You can modify the number of decimal places by changing the number after the period. For example:
- {total_sales:.1f} will format the total_sales variable to show 1 decimal place.
- {total_sales:.0f} will format the total_sales variable to show no decimal places (rounding to the nearest whole number).
By using format strings, you can easily include variables in your text and control their appearance.
Comments
Another important concept in programming is comments. Comments are lines of text in your code that Python ignores when running the program. They are essential for adding explanations, notes, or reminders about what your code does, making it easier for you or others to understand.
In Python, comments start with a #. Anything after the # is considered a comment and is ignored by Python:
# This line calculates total sales
total_sales = 5000
Commenting is extremely important to all programming for several reasons:
-
Clarity: Helps you understand what the code does when revisiting it later.
-
Collaboration: Makes your code easier for others to follow.
Case Sensitivity in Python
Python is a
case-sensitive language, meaning that variables, functions, and keywords must match their case exactly. This is important when naming variables or using built-in commands.
Revenue = 1000  # This is different from "revenue"
print(Revenue)  # Works fine
print(revenue)  # Error: NameError: name 'revenue' is not defined
Best Practices for Case Sensitivity:
- Use consistent naming conventions, such as lowercase words separated by underscores (total_revenue).
- Avoid mixing cases to prevent errors.
Correct way:
total_sales = 5000
print(total_sales)  # Works fine
Incorrect way:
print(Total_Sales) # Error: NameError
-
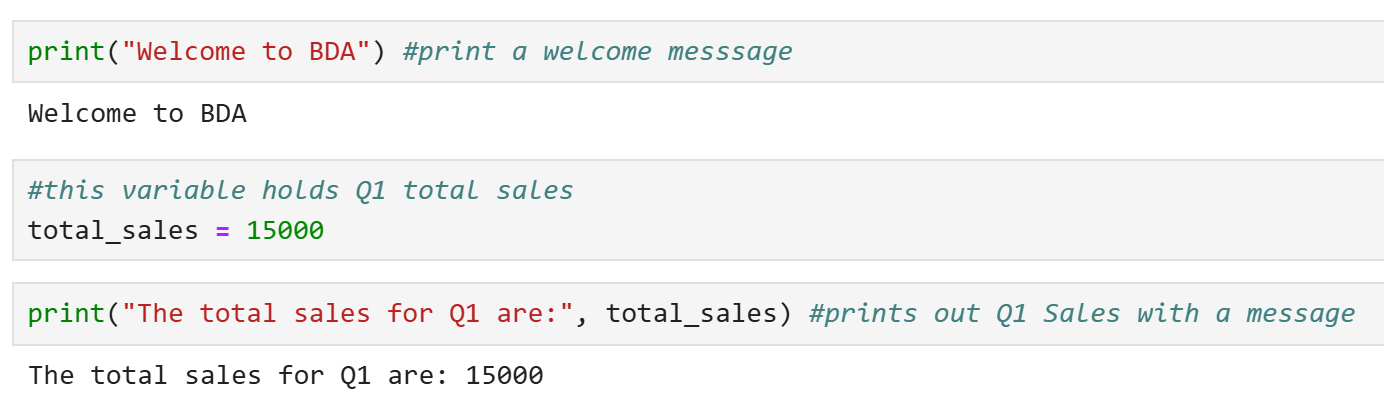
Here’s a simple exercise to apply what you’ve learned. Try writing the following code in a Python notebook on JupyterLab:
- Print a welcome message (“Welcome to BDA”)
- Add a comment to explain the variable below
- Assign a variable called total_sales amount for Q1 ($15,000)
- Print the total sales with a descriptive message before the value that states “The total sales for Q1 are:”
Solution:
-
In programming, libraries, modules, methods, functions, and procedures are distinct concepts, each with a specific role. A library is a collection of pre-written code that provides a set of functionalities (e.g., data manipulation, visualization) to simplify development; for instance, pandas or NumPy in Python. A module is a single file or a collection of Python files (with a .py extension) that contain code, such as variables, functions, and classes, which can be imported and reused in other programs. A function is a reusable block of code designed to perform a specific task, and it typically takes input (arguments) and returns a result. A method is a function that is associated with an object (a particular data structure) and a procedure is similar to a function but focuses on executing a series of actions rather than returning a value. While there are some distinctions in this course, method, function, and procedure may be used interchangeably.
-
- Variable
- A name that refers to a value stored in the computer's memory, used to store and manipulate data.
- Function
- A block of reusable code that performs a specific task.
- Printing
- The process of displaying information to the user.
- String Formatting
- The process of inserting variables, expressions, or values into a string in a structured and readable way.
- Comments
- Non-executable text intended to provide explanations and notes.
- Case Sensitivity
- The distinction a programming language makes between uppercase and lowercase letters.
2. Working with Data with Pandas
Data is the foundation of business data analytics. To analyze data effectively, you need a way to organize it so that it’s easy to explore and manipulate. This is where the Python library pandas comes in.
Pandas is a powerful tool that allows us to structure data into tables called DataFrames. These DataFrames are similar to Excel spreadsheets: they have rows, columns, and labels to organize information. With pandas, you can:
- Read data from files like Excel or CSV.
- Filter, sort, and manipulate data efficiently.
- Perform calculations directly on data columns.
Let’s start by understanding what DataFrames are and why they are so important.
-
- DataFrame
- A two-dimensional, tabular data structure used by pandas.
2a. What DataFrames Are and How They Help Organize Data
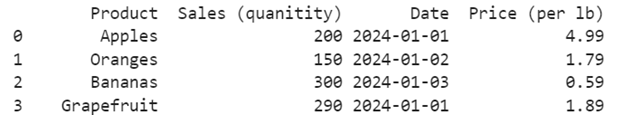
Imagine you’re working with a table of sales data, where each row represents a transaction, and each column contains details like the product name, sales amount, and date. In Python, you can use a DataFrame to represent this table.
A DataFrame is a structure that organizes data in rows and columns, just like an Excel spreadsheet. It’s one of the most important tools in pandas because it makes working with data simple and intuitive.
DataFrames are designed to help you:
1. Organize Data Clearly:
- Each row represents a record (like a transaction).
- Each column represents a feature (like sales or product name).
2. Label Rows and Columns:
- DataFrames use labels (called indices) for rows and columns, making it easy to reference specific parts of the table.
3. Work with Large Data:
- Unlike Excel, DataFrames can handle millions of rows of data efficiently.
Here’s an example of a DataFrame that tracks sales:
2b. Practice Importing Excel Files and Exploring Data Using Pandas
Now that you understand what DataFrames are, let’s practice creating one by importing an Excel file and exploring it with basic pandas functions. You'll use the Excel file fruit.xlsx, which contains information about different fruits, their prices, and quantities.
First, ensure you have pandas and other preparation work covered above to ensure your Python environment is set up. If you haven't already completed this and have it in the notebook you are using, use the following commands:
import pyodide_http
pyodide_http.patch_all()
import micropip
await micropip.install('pandas') # Install pandas for working with data
await micropip.install('openpyxl') # Install openpyxl to handle Excel files
import pandas as pd
Once you have set up your Python environment and installed the necessary packages, you can use the read_excel() function to load an Excel file into a pandas DataFrame. Follow these steps:
-
1. Specify the File Path:
First, you need to specify the path to the Excel file you want to load. In this example, we'll use an online file.
2. Load the Excel File:
Use the
read_excel() function from pandas to read the Excel file and load it into a DataFrame. This function converts the content of the Excel sheet into a structured table (DataFrame) that you can explore and manipulate.
data = pd.read_excel(file_path)
3. Display the DataFrame:
To see the contents of the DataFrame, you can use the print() function. However, printing the entire DataFrame might not be practical for large datasets.
print(data)
For large datasets, it's better to use the
head() function to display only the first few rows. This function shows the first 5 rows by default, making it safer and more practical for previewing the contents.
data.head()
The print(data) function displays the entire DataFrame. For small datasets, this is fine, but for large datasets (e.g., thousands of rows), it can overwhelm your screen or even crash your environment.
The head() function displays only the first few rows (default is 5), which makes it safer and more practical for previewing the contents of large datasets.
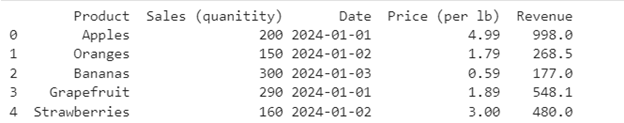
Using data.head() will display:
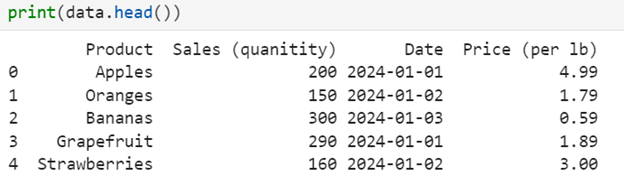
Also included in this image, each row is labeled with an index number starting from 0 and the column headers are taken directly from your Excel file. After loading your data, it’s important to explore its structure and content. Here are some key methods:
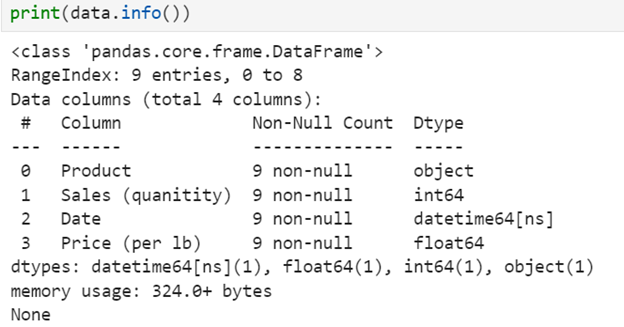
Use
info() to provide a concise summary of a DataFrame, including the number of rows and columns, column names and data types, and non-null value counts.
print(data.info())
Use
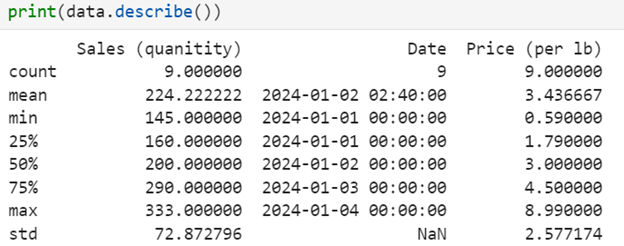
describe() to get statistical summaries, such as mean, median, and standard deviation, for numerical columns.
print(data.describe())
When working with DataFrames in pandas, you'll often need to extract specific rows or columns from a DataFrame. The
.loc[] method in pandas is a simple and intuitive way to do this. Let’s continue working with fruit.xlsx to explore how .loc[] can help you efficiently view parts of your dataset.
The general syntax for .loc[] is:
dataframe.loc[row_selection, column_selection]
- row_selection: Specifies the rows to include (e.g., all rows, specific indices).
- column_selection: Specifies the columns to include.
If you want to view a specific row, you can use its index label. Remember, the index in a pandas DataFrame is a unique identifier for each row. It helps you locate and reference rows in your DataFrame. By default, pandas assigns numeric index labels starting from 0 when you load or create a DataFrame.
For example:
print(data.loc[0]) # Access the row with index label 0, which is the first row
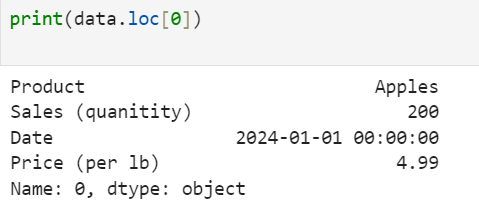
The output can sometimes include additional information at the bottom, such as:
Name: 0, dtype: object.
Here, "Name: 0" indicates that this is the row with the index label 0. Also, "dtype: object" indicates that the data is not a single type but a mix type. This is expected because the row includes a combination of different kinds of values: text for the product column, whole numbers for the sales column, and specially formatted numerical values that represent dates in the date column.
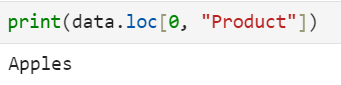
If you need only certain columns for a row, you can specify the column names:
# Access the "Sales" column for the row with index label 0
print(data.loc[0, "Product"]):
-
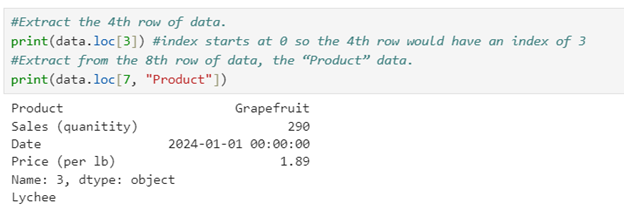
Use the fruit.xlsx dataset to complete these tasks:
- Extract the 4th row of data.
- Extract from the 8th row of data, the “Product” data.
Solution:
-
- read_excel()
- A method used to read data from an Excel file into a pandas DataFrame.
- head()
- A pandas method used to display the first few rows of a DataFrame.
- info()
- Provides a concise summary of a DataFrame, including the number of rows and columns, column names and data types, and non-null value counts.
- describe()
- Method in pandas that provides a summary of statistical information for numerical columns in a DataFrame.
- loc[]
- A pandas method used for accessing rows and columns in a DataFrame by labels or index.
3. Control Structure in Python – For Loops
Control Flow in Python
Conditional Statements: if/else
Conditional statements allow you to execute different blocks of code depending on whether a condition is met. The most common conditional statement in Python is the if statement, often combined with else.
Why if/else Statements are Important
-
Decision Making: They allow programs to make choices and respond dynamically to different inputs.
-
Flexibility: They provide multiple paths of execution depending on conditions.
-
Efficiency: They help eliminate redundant code by handling multiple scenarios in a structured way.
-
Readability: They improve code clarity, making it easier to understand logic and flow.
Code example:
x = 10
if x > 5:
    print("x is greater than 5")
else:
    print("x is 5 or less")
Output:
x is greater than 5
Here’s a breakdown:
- if x > 5: checks if x is greater than 5.
- If true, print("x is greater than 5") runs.
- Otherwise, the else block runs.
-
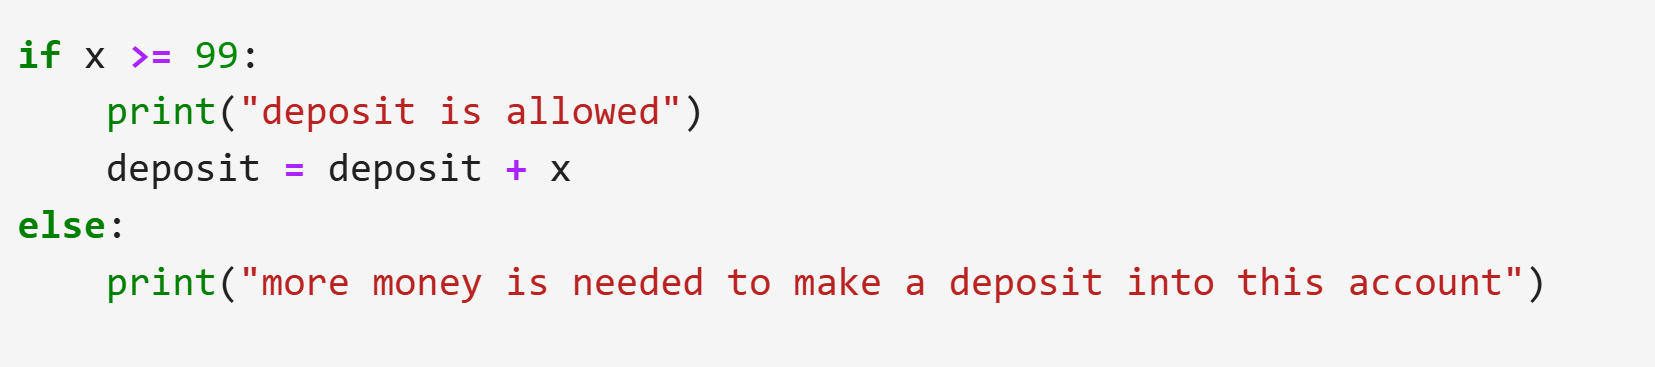
Write an if/else statement that if x is greater than or equal to 99, then the deposit is allowed and the variable deposit increases by x. Otherwise, print out "more money is needed to make a deposit into this account."
Solution:
Introducing Loops
Loops are a fundamental concept in programming that allow you to repeat a block of code multiple times. They are essential for automating repetitive tasks, making your code more efficient and easier to manage. There are two main types of loops in Python: for loops and while loops.
Why Loops are Important:
-
Efficiency: Automate repetitive tasks without writing redundant code.
-
Readability: Make your code cleaner and easier to understand.
-
Flexibility: Handle varying amounts of data dynamically.
Basic for Loop
A for loop is used to iterate over a sequence (like a list, string, or even a DataFrame) and execute a block of code for each item in the sequence.
for x in range(5):
    print(x)
This code will print numbers from 0 to 4. Here's a breakdown:
- range(5) generates a sequence of numbers from 0 to 4.
- for x in range(5): means "for each number x in this sequence, do the following."
- print(x) prints the current value of x.
Output:
0
1
2
3
4
Using for Loop with DataFrames
Now, let's apply a for loop to a DataFrame. Suppose we have a DataFrame, fruits, with a column named "Product." Suppose we want to use the previous data we loaded from fruits.xlsx and now will use a for loop to print each value in the Product column. The new code is shown below circled by yellow.
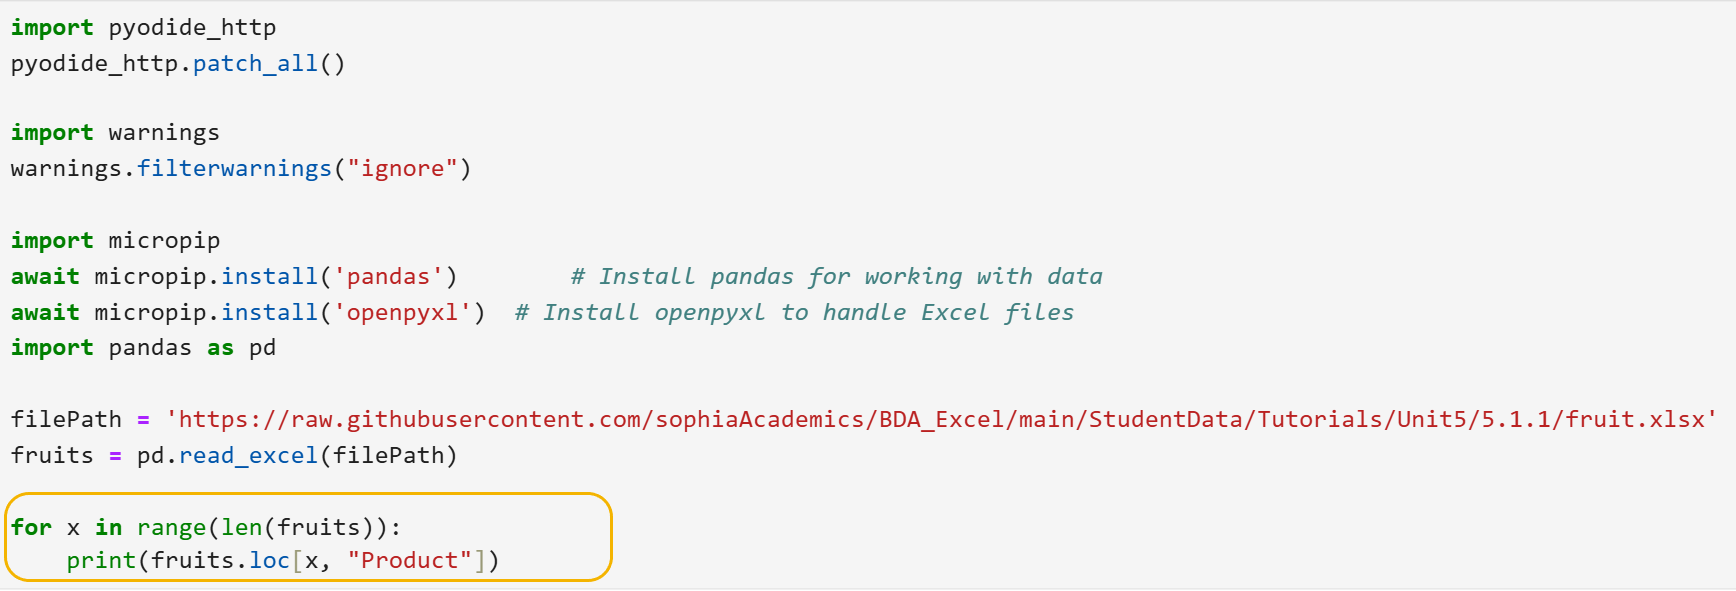
Here's a breakdown:
- range(len(data)) generates a sequence of numbers from 0 to the number of rows in data minus one.
- for i in range(len(data)): means "for each index i in this sequence, do the following."
- data.loc[i, 'Product'] accesses the value in the "Product" column at row i.
- print(data.loc[i, 'Product']) prints this value.
Output:
Apples
Oranges
Bananas
Grapefruit
Strawberries
Blueberries
Pears
Lychee
Mangos
Understanding loops is crucial for anyone learning to program, especially in the context of data analytics. Loops allow you to automate repetitive tasks, making your code more efficient and easier to manage. As you progress in your studies, you'll encounter many situations where loops will be invaluable. Whether you're iterating over rows in a DataFrame, processing large datasets, or performing complex calculations, loops will help you handle these tasks effectively.
By mastering loops now, you'll be well-prepared to tackle more advanced topics and real-world data challenges. You'll find that loops are a powerful tool in your programming toolkit, enabling you to write cleaner, more efficient code and solve problems more effectively.
-
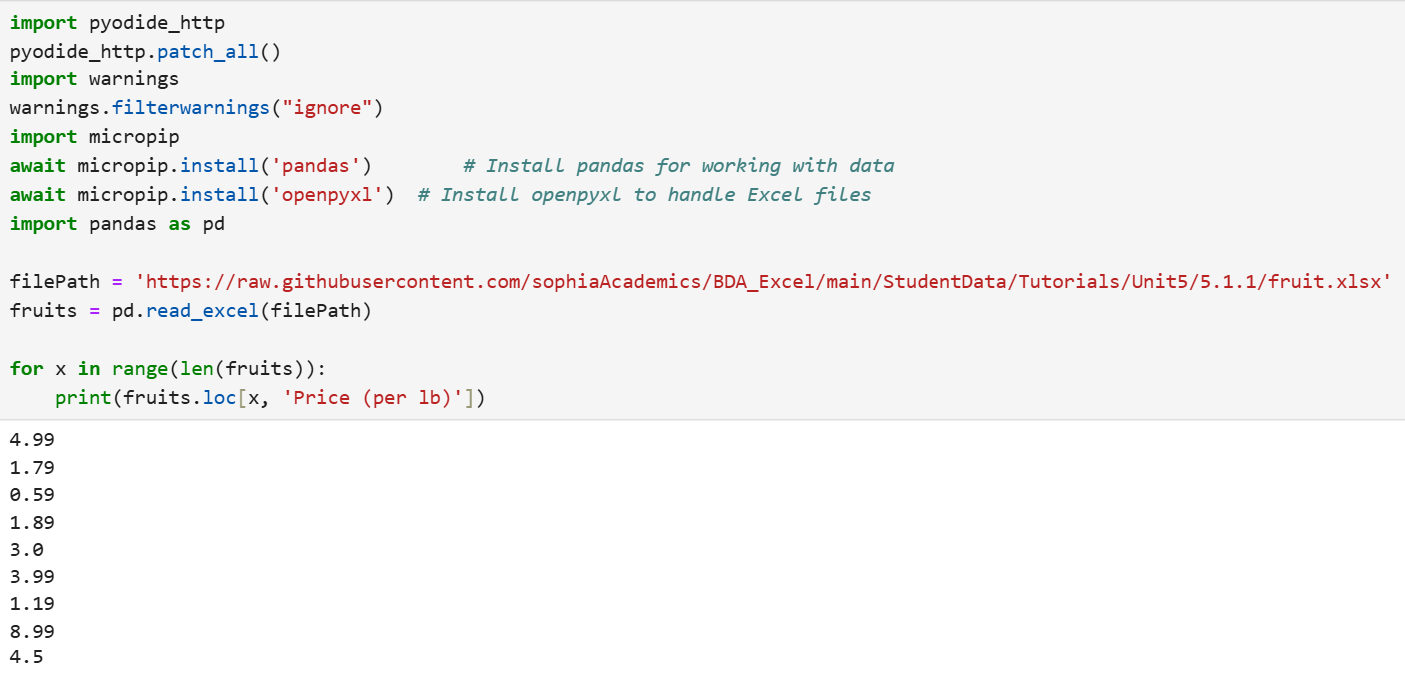
Using the fruit.xlsx data file, print out each value in the Price column.
Solution:
4. Visualizing Data with Matplotlib
Data visualization is an essential part of data analysis. It allows us to see patterns, relationships, and trends that might not be immediately apparent from raw data alone. In this section, you will explore how to create visualizations using Matplotlib, a widely used Python library for creating a variety of charts and plots. By following along, you will learn how to:
- Create scatter plots to examine relationships between variables.
- Label axes and add titles to make your charts more informative.
- Add calculated columns to your data and visualize these insights.
You will use the fruit.xlsx dataset, which contains information about fruits, their prices, and quantities.
4a. Getting Started with Matplotlib
To create visualizations, you first need to ensure Matplotlib is installed in your Python environment. If it is not already installed, you can add it using the following command:
import micropip
await micropip.install('matplotlib') # Install matplotlib for creating charts
Next, import the necessary libraries at the start of your script:
import matplotlib.pyplot as plt
You should have already loaded the fruit.xlsx dataset into a pandas DataFrame named data.
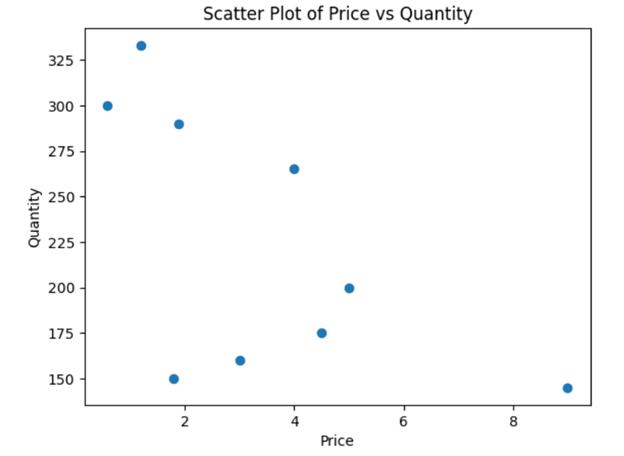
Scatter plots are an excellent way to visualize relationships between two numerical variables. For instance, you might want to see if there is a connection between the price of a fruit and the quantity sold.
To create a scatter plot, use the plt.scatter() function. Below is an example that plots Price on the x-axis and Quantity on the y-axis:
plt.scatter(data["Price (per lb)"], data["Sales (quanitity)"])
plt.xlabel("Price")  # Label for the x-axis
plt.ylabel("Quantity")  # Label for the y-axis
plt.title("Scatter Plot of Price vs Quantity")  # Title for the chart
plt.show()
This plot will help you determine if fruits with higher prices tend to have lower quantities or if there is another pattern. Labels and titles are critical for making visualizations understandable. Without them, a scatter plot would be just a collection of points, leaving viewers guessing about what the axes represent. Always label your axes and provide a clear, descriptive title.
Adding calculated columns to your dataset is a powerful way to extract new insights. In this example, we will calculate a new column called Revenue. For example, revenue can be calculated as:

To add a new column in pandas, use the following syntax:
data['New Column Name'] = calculation
Here, we multiply the Price (per lb) column by the Sales (quantity) column to compute revenue:
data['Revenue'] = data['Sales (quanitity)'] * data['Price (per lb)']
This creates a new column named Revenue, which is added to the dataset.
It’s always a good idea to verify that the new column is calculated correctly. Use the head() function to display the first few rows of the dataset:
print(data.head())
This will show the Revenue column alongside the existing columns. Ensure that the values make sense (e.g., for a product with a price of $4.99 and sales of 200 units, the revenue should be  ).
).
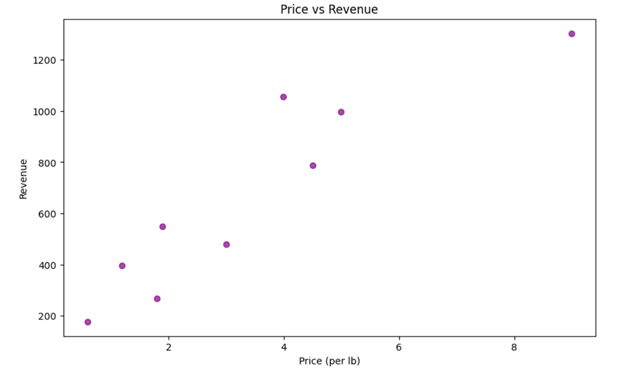
Once calculated, we can explore the relationship between price and revenue using a scatter plot.
Code Example:
plt.scatter(data['Price (per lb)'], data['Revenue'], color='purple', alpha=0.7)
plt.xlabel('Price (per lb)')
plt.ylabel('Revenue')
plt.title('Price vs Revenue')
plt.show()
-
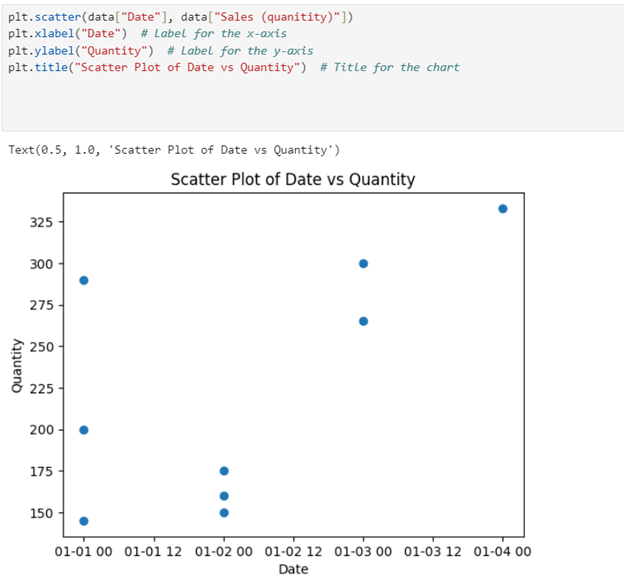
Create a scatter plot that plots Date on the x-axis and Quantity on the y-axis.
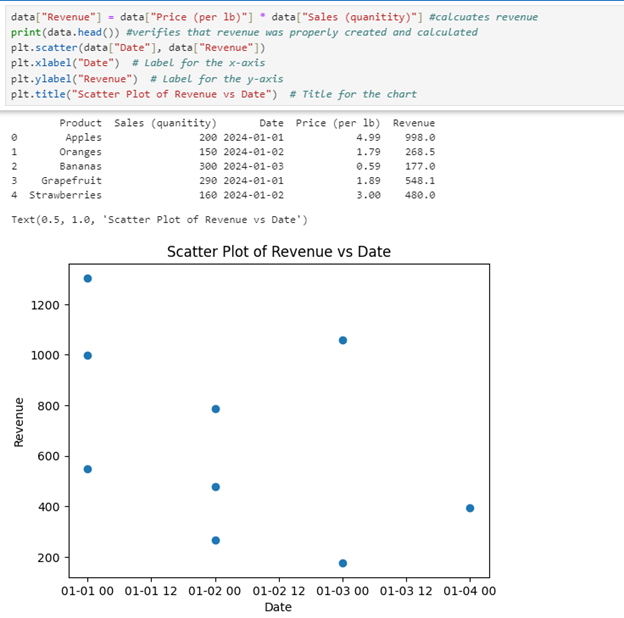
Create a second scatter plot that plots Revenue vs. Date.
Solution for First Scatter Plot:
Solution for Second Scatter Plot:
In this lesson, you learned how to use Python for organizing, analyzing, and visualizing data in business data analytics. You started by setting up your environment in JupyterLab, a web-based platform for writing and running Python code, and installing essential libraries like pandas and Matplotlib using micropip. You explored Python basics such as variables, functions, and control structures like loops to automate tasks and handle decision-making in code. With pandas, you worked with DataFrames to import, organize, and manipulate data from Excel files, using methods like head() and .loc[] to explore datasets. Then, you used Matplotlib to create visualizations like scatter plots, helping to uncover patterns and relationships in data. Finally, you accessed shared datasets directly from GitHub, improving efficiency and collaboration. You should now have a strong foundation in Python for data analysis and visualization in business contexts.