In this lesson, you will begin your exploration of graphs. You will also discover how graphs enhance your productivity. Specifically, this lesson will cover:
1. The Coordinate Plane
In math, graphs are frequently used to demonstrate patterns. Identifying patterns helps us form connections to seemingly unrelated bits of information and draw conclusions from what we see. With practice, you’ll be able to use your understanding of patterns to identify the best organizational strategy for different situations, which will ultimately make you more productive in your personal and professional life. First, we’ll look at the coordinate plane of a graph.
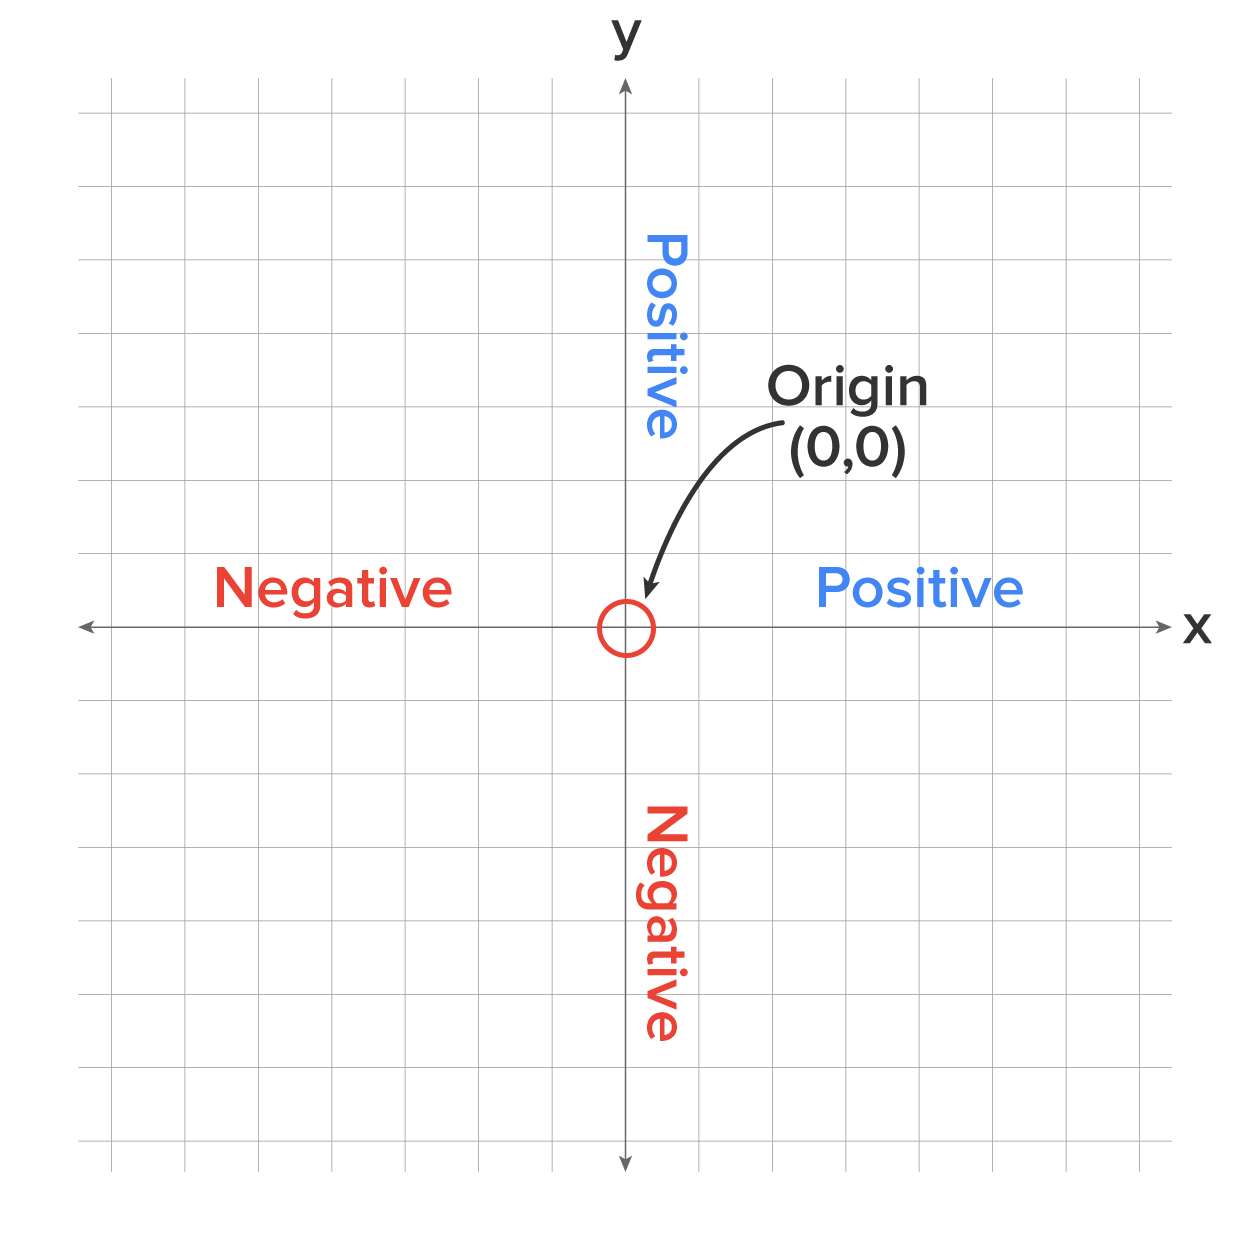
The coordinate plane is a two-dimensional surface used to plot and identify points. It consists of a horizontal number line called the x-axis and a vertical number line called the y-axis. Both the x-axis and the y-axis have a positive and negative side and both have a center at 0. Think about both the x- and y-axes as a number line. The centers of the x- and y-axes intersect at a point in the coordinate plane called the origin. The origin is at 0 on both the x-axis and the y-axis.
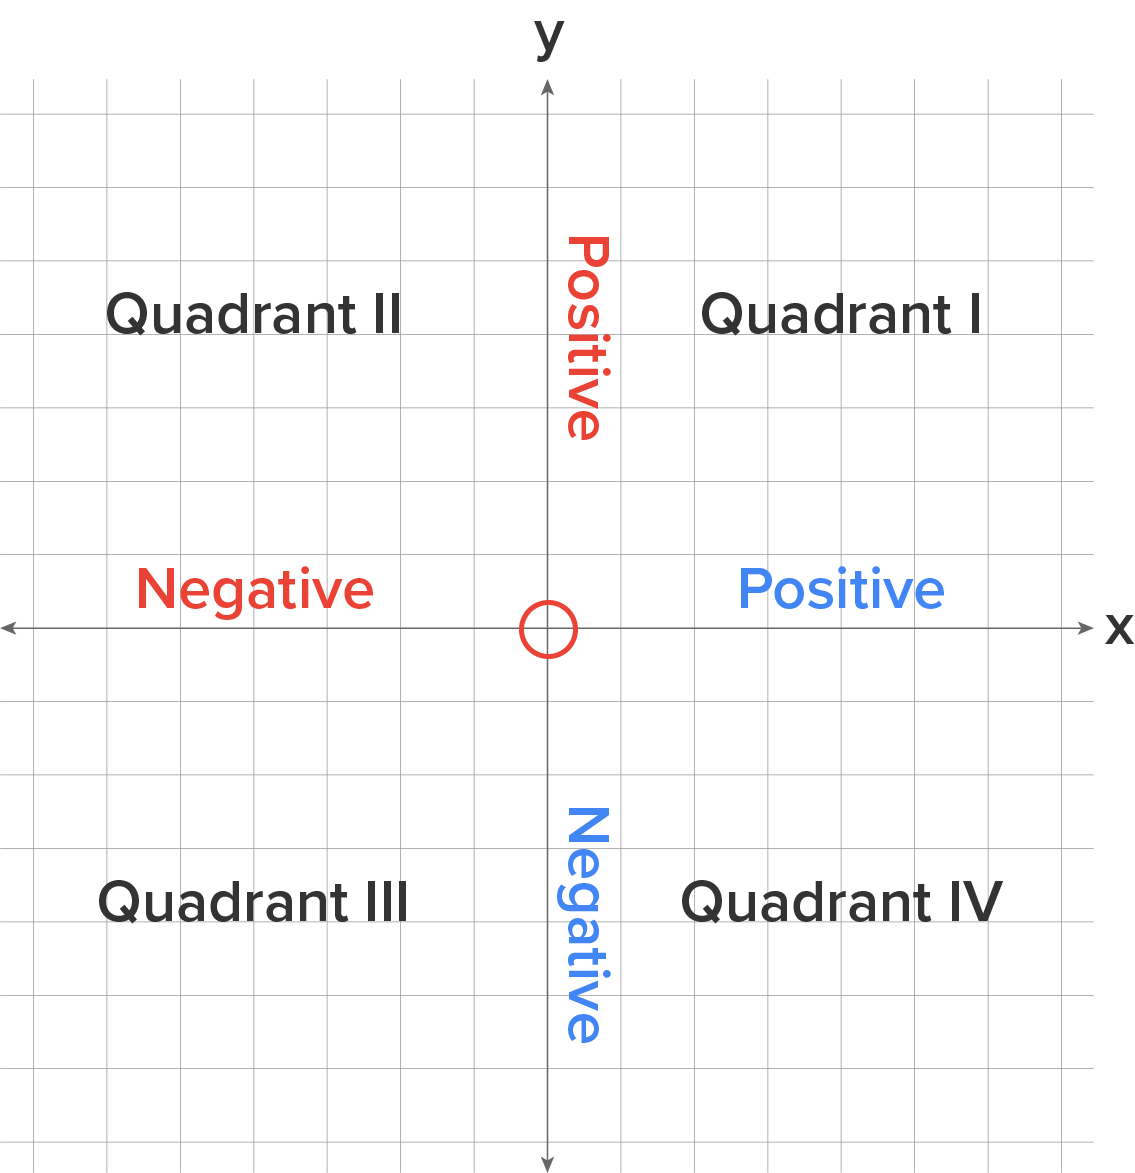
The x- and y-axes divide the coordinate plane into four quadrants:
- In quadrant 1, x and y are both positive. This means all points in quadrant I are above and to the right of the origin.
- In quadrant 2, x is negative and y is positive. This means all points in quadrant II are above and to the left of the origin.
- In quadrant 3, x and y are both negative. This means all points in quadrant III are below and to the left of the origin.
- In quadrant 4, x is positive and y is negative. This means all points in quadrant IV are below and to the right of the origin.
-
- Coordinate Plane
- A two-dimensional surface used to plot and identify points.
2. Coordinate Points
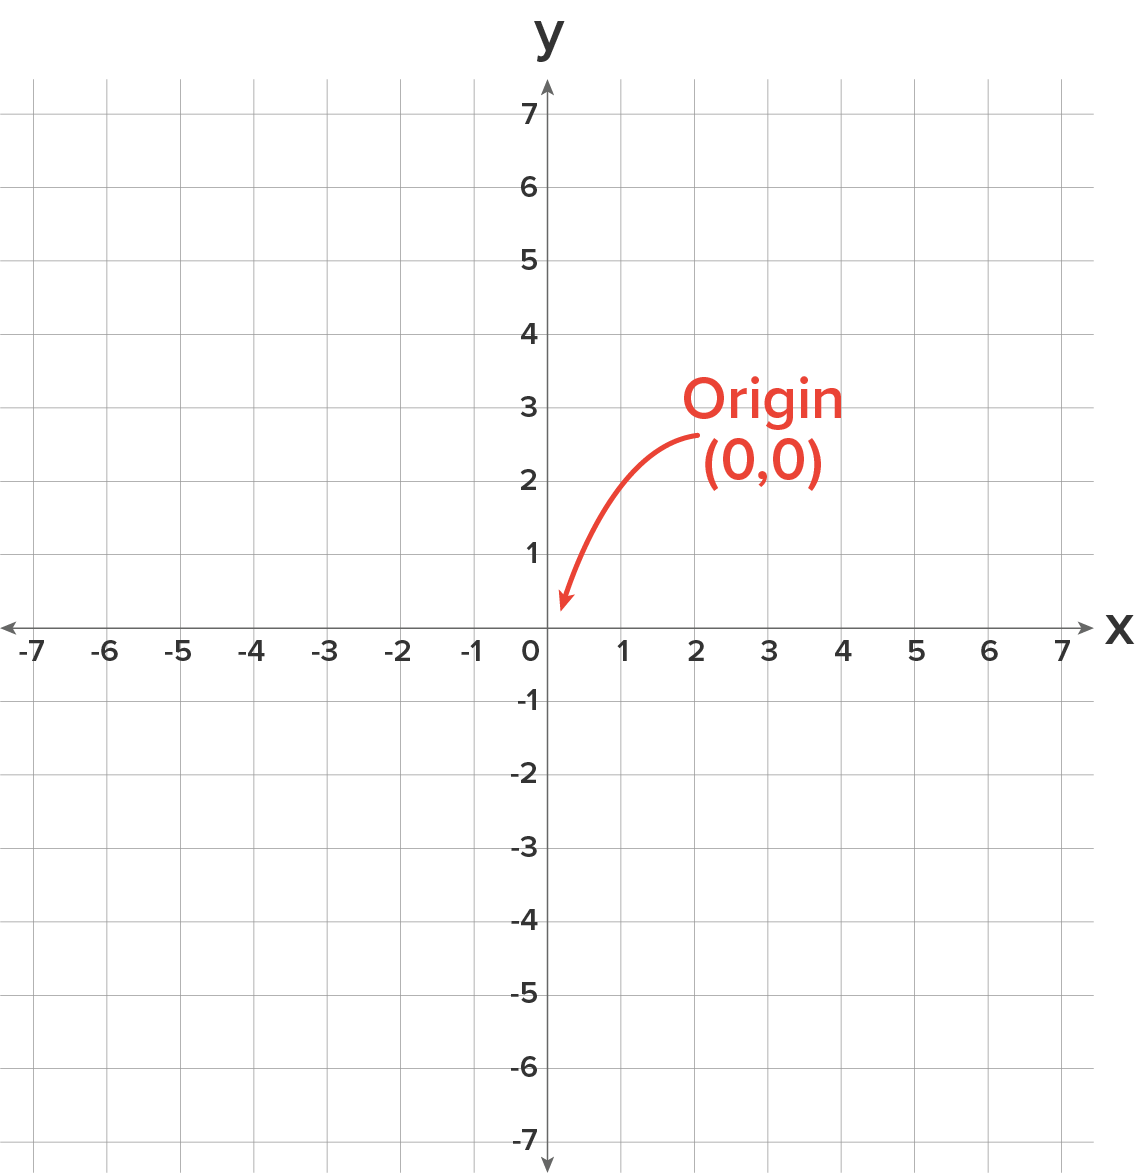
All points on the coordinate plane, known as coordinate points, can be indicated by an x value and a y value. These two values form a coordinate pair, which is written as (x, y). As we covered earlier, the point at the origin is represented by the coordinate pair (0, 0).
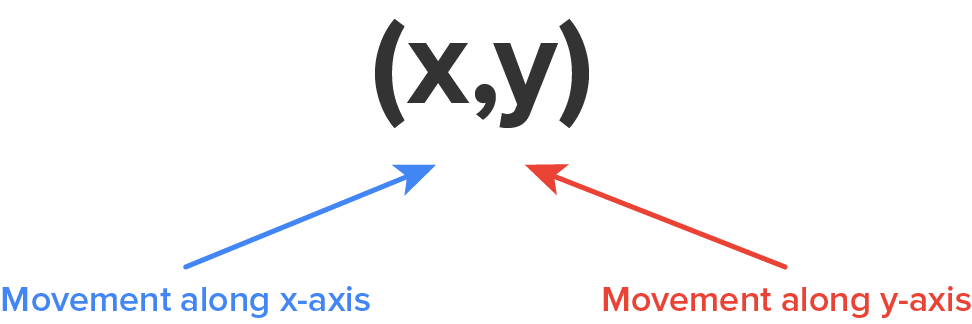
Starting at the origin, the first coordinate indicates how far to move in the horizontal direction (left or right) along the x-axis. The second coordinate indicates how far to move in the vertical direction (up or down) along the y-axis.
-
EXAMPLE
The coordinate plane below illustrates different ordered pairs in each quadrant:
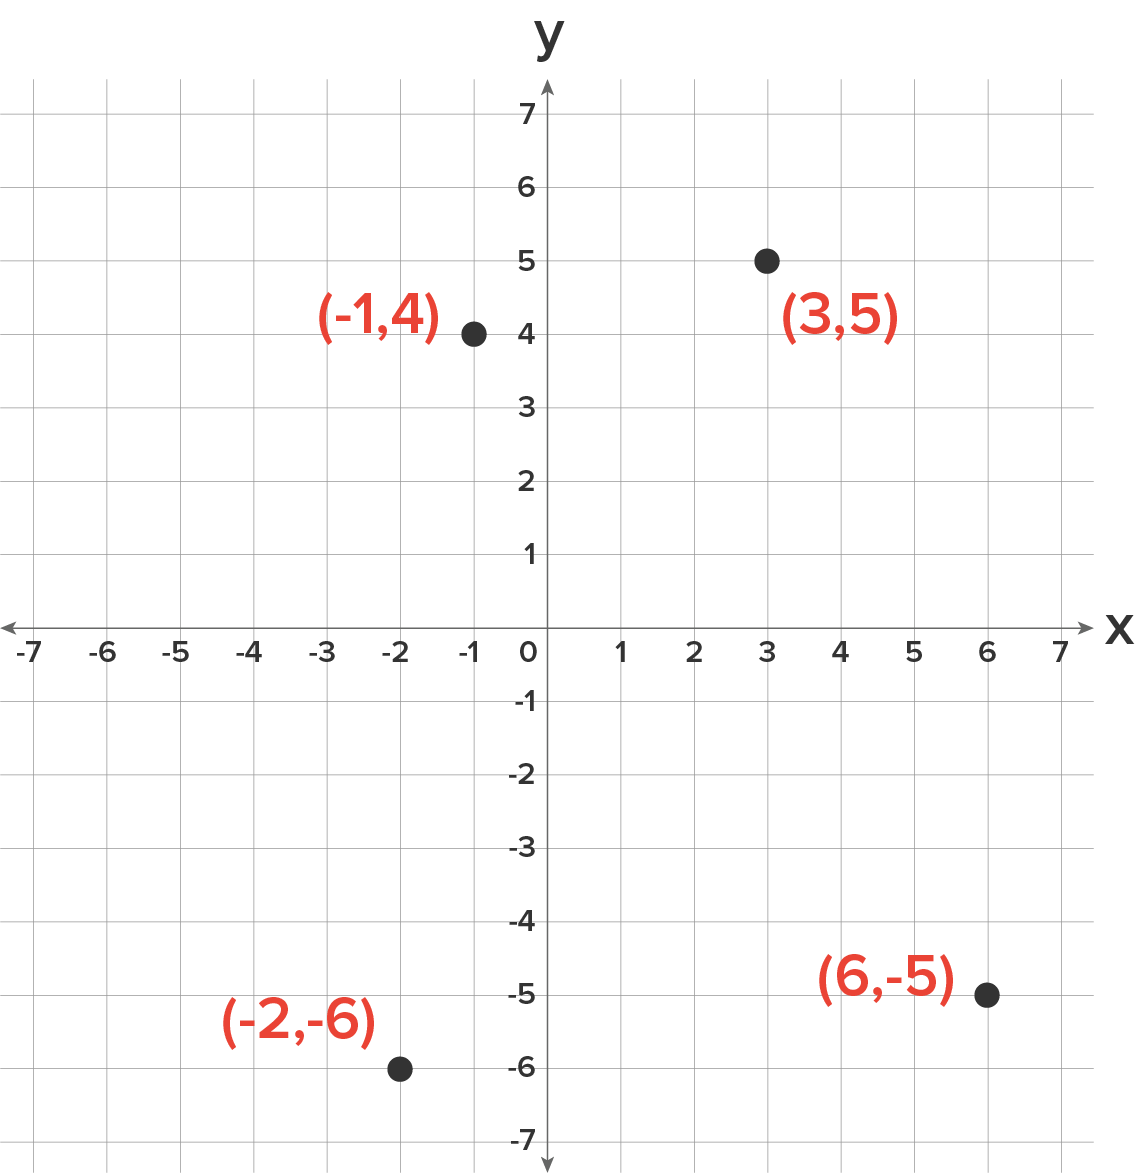
- The ordered pair (3, 5) is 3 units in the positive x direction and 5 units in the positive y direction from the origin. It’s also the point where x is 3 and y is 5.
- The ordered pair (-2, -6) is 2 units in the negative x direction from the origin and 6 units in the negative y direction from the origin. It is also the point where x is -2 and y is -6.
- The ordered pair (-1, 4) is 1 unit in the negative x direction and 4 units in the positive y direction. It’s also the point where x is -1 and y is 4.
- The ordered pair (6, -5) is 6 units in the positive x direction and 5 units in the negative y direction. It’s also the point where x is 6 and y is -5.
-
Consider the following graph.
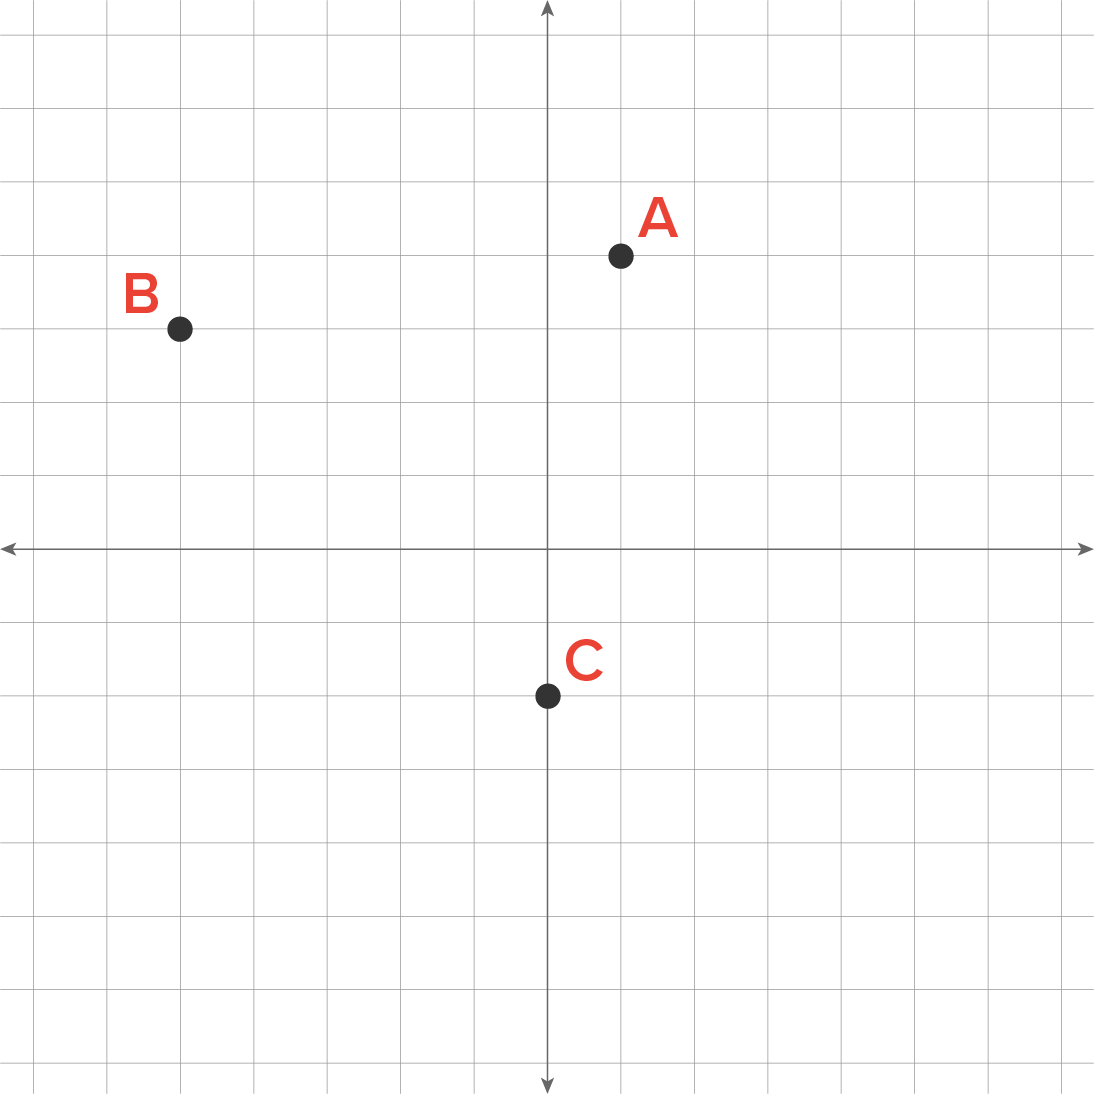
What are the coordinates of each point?
- Point A is to the right 1 from the origin point and up 4. This becomes A (1, 4).
- Point B is to the left 5 and up 3. Left is backwards or negative, so we have B (-5, 3).
- Point C is straight down 2 units. There is no left or right. This means we go right zero so the point is C (0, -2).
Using graphs to plot data can help you in your personal and professional life. In fact, you already likely use graphs frequently. Runners may use apps that track their speed and distance on a graph. When you look at your energy bill, you will see that your energy company uses a graph to plot the amount of energy you used during the month. Understanding and being able to use graphs will make you more productive by enabling you to look at and analyze large amounts of data quickly.
-
- Coordinate Point
- A point on a graph where the first coordinate indicates how far to move in the horizontal direction along the x-axis and the second coordinate indicates how far to move in the vertical direction along the y-axis.
Today you learned that the coordinate plane is a two-dimensional surface used to plot and identify points. It consists of a horizontal number line called the x-axis and a vertical number line called the y-axis, which intersect at a point in the coordinate plane called the origin. The x- and y-axes divide the coordinate plane into four quadrants. You also learned that the point of the origin is represented by the coordinate pair (0, 0) and all coordinate points count from the origin point on the x-axis and then the y-axis and are shown as (x, y). Finally, you examined how plotting data on graphs enhances your productivity skill.
Best of luck in your learning!